Bioinformatic analyses reveal the prognostic significance and potential role of ankyrin 3 (ANK3) in kidney renal clear cell carcinoma
Article information

Abstract
Kidney renal clear cell carcinoma (KIRC) is one of the most aggressive cancer type of the urinary system. Metastatic KIRC patients have poor prognosis and limited therapeutic options. Ankyrin 3 (ANK3) is a scaffold protein that plays important roles in maintaining physiological function of the kidney and its alteration is implicated in many cancers. In this study, we investigated differential expression of ANK3 in KIRC using GEPIA2, UALCAN, and HPA databases. Survival analysis was performed by GEPIA2, Kaplan-Meier plotter, and OSkirc databases. Genetic alterations of ANK3 in KIRC were assessed using cBioPortal database. Interaction network and functional enrichment analyses of ANK3-correlated genes in KIRC were performed using GeneMANIA and Shiny GO, respectively. Finally, the TIMER2.0 database was used to assess correlation between ANK3 expression and immune infiltration in KIRC. We found that ANK3 expression was significantly decreased in KIRC compared to normal tissues. The KIRC patients with low ANK3 expression had poorer survival outcomes than those with high ANK3 expression. ANK3 mutations were found in 2.4% of KIRC patients and were frequently co-mutated with several genes with a prognostic significance. ANK3-correlated genes were significantly enriched in various biological processes, mainly involved in peroxisome proliferator-activated receptor (PPAR) signaling pathway, in which positive correlations of ANK3 with PPARA and PPARG expressions were confirmed. Expression of ANK3 in KIRC was significantly correlated with infiltration level of B cell, CD8+ T cell, macrophage, and neutrophil. These findings suggested that ANK3 could serve as a prognostic biomarker and promising therapeutic target for KIRC.
Introduction
Kidney renal clear cell carcinoma (KIRC) or clear cell renal cell carcinoma is the most common histological type of kidney cancer, accounting for 70% of all cases [1]. According to global cancer statistics, there were 431,288 new cases and 179,368 new deaths for kidney cancer worldwide in 2020 [2]. Although localized KIRC can be cured by surgical treatment, patients frequently present with metastasis at diagnosis or develop recurrence after treatment, resulting in high mortality rate and limited therapeutic options [3,4]. Therefore, the identification of biomarkers is beneficial to improve diagnosis and prognosis for KIRC patients.
Ankyrin 3 (ANK3), also known as ankyrin G, belongs to ankyrin protein family. It is a scaffold protein that regulates the organization of membrane and cytoskeletal components [5]. ANK3 is the most abundant ankyrin in kidney [6] and plays a crucial role in membrane assembly, epithelial cell polarization, and regulation of ion channels [7-9]. In cancers, genetic and expression alterations of ANK3 have been reported in several studies [10-16]. Decreased ANK3 expression was associated with poor survival outcome in prostate cancer [14] and androgen receptor‑positive breast cancer [15]. It has been shown that ANK3 regulates cell cycle and inhibits cell invasion in prostate cancer cells [14]. Overexpression of ANK3 promotes cell apoptosis and suppresses epithelial-mesenchymal transition in papillary thyroid carcinoma cells [16]. These findings indicate the prognostic value and tumor suppressive function of ANK3 in cancers. Nevertheless, its prognostic significance and role in KIRC remain largely unknown.
In the present study, we performed an integrative bioinformatic analysis of molecular and clinical data from the publicly available datasets through various online databases. The expression of ANK3 and its relationship to clinicopathologic outcomes in KIRC were explored in Gene Expression Profiling Interactive Analysis 2 (GEPIA2), University of ALabama at Birmingham CANcer data analysis portal (UALCAN), and Human Protein Atlas (HPA) databases. Prognostic significance of ANK3 for KIRC was assessed by GEPIA2, Kaplan-Meier (KM) plotter, Online consensus Survival analysis for KIRC (OSkirc), and Tumor Immune Estimation Resource (TIMER) databases. ANK3 mutations and co-mutations in KIRC were analyzed by the cBioPortal database. Potential roles of ANK3 in KIRC carcinogenesis and immune infiltration were also investigated using GeneMANIA, Shiny GO, and TIMER2.0 databases.
Methods
Differential expression analysis
Differential expression of ANK3 in KIRC compared to normal tissues was explored using GEPIA2 database (http://gepia2.cancer-pku.cn/) [17] and the UALCAN database (http://ualcan.path.uab.edu) [18]. The mRNA expression of ANK3 was analyzed in KIRC (n = 533) and normal (n = 72) tissue samples in The Cancer Genome Atlas (TCGA) dataset using GEPIA2. The differential expression of ANK3 protein in KIRC (n = 110) and normal (n = 84) tissue samples was examined in the Clinical Proteomic Tumor Analysis Consortium (CPTAC) dataset using UALCAN. In addition, the protein expression levels of ANK3 in renal cancer and normal kidney tissues were explored in the HPA database (http://www.proteinatlas.org) [19,20].
Analysis of the association of ANK3 expression and clinicopathological features of KIRC patients
Relationships between ANK3 mRNA expression and clinicopathological features, including age, race, sex, cancer stage, tumor grade, and nodal metastasis status in KIRC patients were analyzed in the TCGA dataset using the UALCAN database.
Survival analysis
Survival analysis of ANK3 expression in KIRC patients was performed using various databases, including GEPIA2, KM plotter (https://kmplot.com/analysis/) [21], OSKirc (https://bioinfo.henu.edu.cn/KIRC/KIRCList.jsp) [22]. In GEPIA2, patients (n=516) were split into low- and high-expression groups based on median expression value. Survival analysis by KM plotter was conducted for 530 KIRC patients. Low- and high-ANK3 expression groups were divided using “Auto select best cut-off” option. For OSkirc, a total of 629 KIRC patients from combined data sources (TCGA, GSE22541, GSE29609, and GSE3) were subjected to survival analysis with the patients split by “upper 50%” option. The KM curves of overall survival of KIRC patients were plotted along with the log-rank p-value and hazard ratio (HR). Multivariable Cox proportional hazard regression analysis to assess an independent predictive value of ANK3 expression was performed using the TIMER database (https://cistrome.shinyapps.io/timer/) [23,24].
Genetic alteration analysis
Genetic alterations of ANK3 were explored using cBioPortal for Cancer Genomics database (https://www.cbioportal.org/) [25,26]. The ANK3 mutations and co-mutations in KIRC were analyzed in 1,496 samples in TCGA datasets (TCGA, Firehose Legacy; TCGA, Nature 2013; TCGA, PanCancer Atlas). Heatmap representing HR and the KM curve of ANK3 co-mutated gene expression for overall survival of KIRC patients were created by GEPIA2.
Interaction network and functional enrichment analyses of ANK3-correlated genes
The top 50 genes that were positively correlated with ANK3 in KIRC based on Pearson correlation coefficient, were retrieved from GEPIA2 and subjected to further analyses. Interaction networks of ANK3-correlated genes were constructed using GeneMANIA (https://genemania.org/) [27]. Gene Ontology (GO) and Kyoto Encyclopedia of Genes and Genomes (KEGG) pathway enrichment analyses were performed and graphically visualized using ShinyGO (version 0.76.3) (http://bioinformatics.sdstate.edu/go/) [28]. The significance threshold for the enrichment was set at the false discovery rate ≤ 0.05.
Analysis of relationship between ANK3 and peroxisome proliferator-activated receptors in KIRC
Correlations of ANK3 expression and peroxisome proliferator-activated receptors (PPARs), including PPARα (PPARA), PPARβ/δ (PPARD), and PPARγ (PPARG) expression in KIRC were analyzed in 516 samples using GEPIA2. KM curves of PPARA, PPARD, and PPRRG expressions for overall survival of KIRC patients were generated by GEPIA2. The protein expression levels of PPARA and PPARG in renal cancer and normal kidney tissues were explored in the HPA database.
Immune infiltration analysis
Correlation between ANK3 expression and abundance of tumor-infiltrating immune cells, including B cells, CD8+ T cells, CD4+ T cells, neutrophils, macrophages, and dendritic cells in KIRC was estimated by TIMER, TIDE, CIBERSORT, CIBERSORT-ABS, QUANTISEQ, XCELL, MCPCOUNTER, and EPIC algorithms through TIMER 2.0 database (http://timer.cistrome.org/) [29] with tumor purity adjustment. A heatmap representing the partial Spearman's correlation coefficient was plotted using GraphPad Prism version 8.0.1 (GraphPad Software, San Diego, CA, USA). Scatter plots of ANK3 expression level and infiltration level of immune cells were visualized by the TIMER2.0 database.
Statistical analysis
Differential expression analysis of ANK3 was performed using one-way ANOVA in the GEPIA database and Student's t-test in the UALCAN database. Survival analysis was performed with the Kaplan-Meier method and log-rank test. Multivariate analysis was conducted by Cox’s proportional hazard model. Genetic alterations were analyzed by one-sided Fisher’s exact test in the cBioportal database. Pearson’s correlation analysis was used to evaluate the correlation between two genes expression. Correlation between ANK3 expression and immune infiltration level was evaluated by the purity-adjusted partial Spearman’s correlation test. The p-value less than 0.05 was considered statistically significant.
Results
Differential expression of ANK3 in KIRC and normal tissues
Differential expressions of ANK3 in KIRC compared to normal tissue at mRNA and protein levels were investigated using GEPIA2 and UALCAN, respectively. GEPIA2 analysis showed that ANK3 mRNA expression was significantly down-regulated in KIRC compared to normal tissues in the TCGA dataset (Fig. 1A). Similarly, a significant decrease of ANK3 protein expression in KIRC was observed from CPTAC dataset in UALCAN (Fig. 1B). Moreover, result from HPA database also demonstrated a decrease of ANK3 protein level in renal cancer compared to normal kidney tissues (Fig. 1C). These findings indicated that ANK3 expression was significantly decreased in KIRC compared to normal tissues at both mRNA and protein levels.
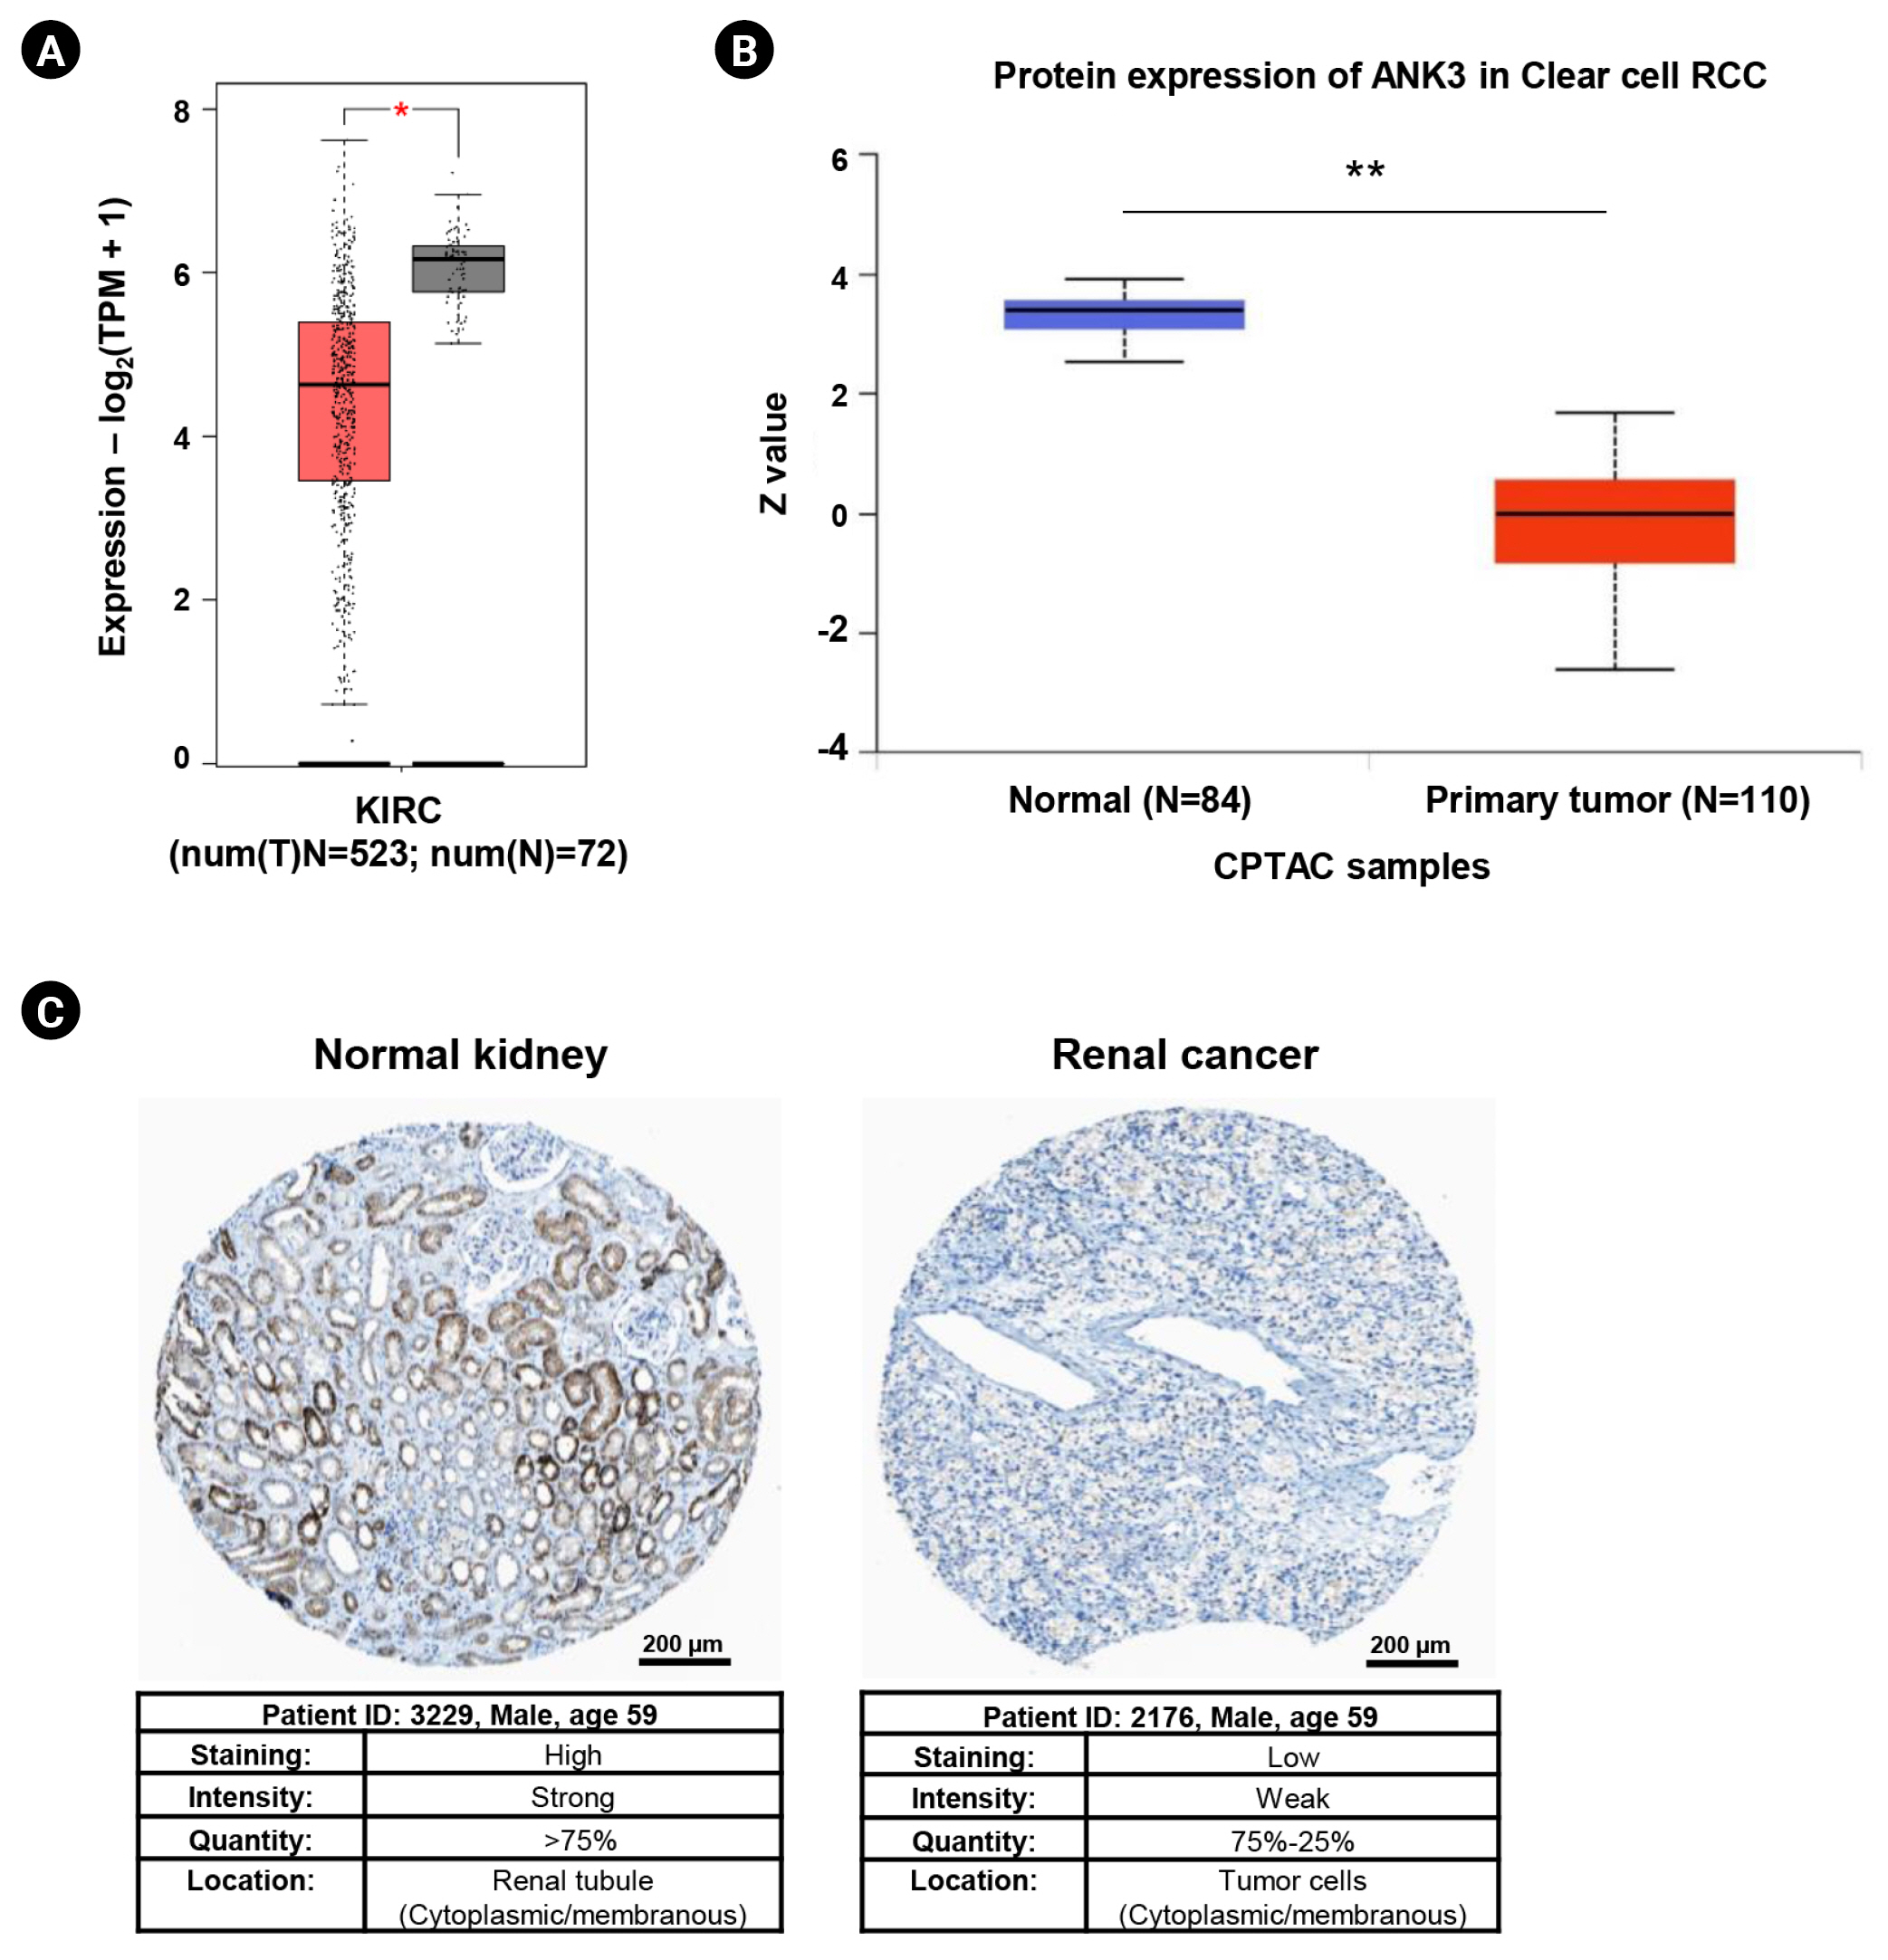
Expression of ANK3 mRNA and protein in KIRC tissues. (A) Boxplot of ANK3 mRNA expression in KIRC (red) and normal (grey) tissues from The Cancer Genome Atlas dataset (GEPIA2 database). (B) Boxplot of ANK3 protein expression in KIRC (red) and normal (blue) tissues from the CPTAC dataset (UALCAN database). (C) Representative immunohistochemical image of ANK3 protein expression in normal kidney and renal cancer tissues (HPA database). ANK3, ankyrin 3; KIRC, kidney renal clear cell carcinoma; GEPIA2, Gene Expression Profiling Interactive Analysis 2; CPTAC, Clinical Proteomic Tumor Analysis Consortium; UALCAN, University of ALabama at Birmingham CANcer data analysis portal; HPA, Human Protein Atlas; RCC, renal cell carcinoma; TPM, transcripts per million. *p < 0.05, **p < 0.01.
Association between ANK3 expression and clinicopathological features of KIRC patients
We assessed the associations between ANK3 mRNA expression and clinicopathological features of KIRC patients using UALCAN. Based on the TCGA dataset, ANK3 expression was not significantly associated with patient’s age and race (Fig. 2A and 2B). Male patients had a significantly lower level of ANK3 expression compared to female patients (Fig. 2C). In addition, the data showed that ANK3 expression was significantly correlated with cancer stage (Fig. 2D), tumor grade (Fig. 2E), and nodal metastasis status (Fig. 2F). These findings suggested that the decreased expression of ANK3 may be a predictive indicator for KIRC severity and progression.

Relationship between ANK3 mRNA expression and clinicopathological features in KIRC. Boxplot of ANK3 mRNA expression in KIRC based on patient’s age (A), patient’s race (B), patient’s sex (C), individual cancer stage (D), tumor grade (E), and nodal metastasis status (F) from The Cancer Genome Atlas dataset (UALCAN database). ANK3, ankyrin 3; KIRC, kidney renal clear cell carcinoma; UALCAN, University of ALabama at Birmingham CANcer data analysis portal; TCGA, The Cancer Genome Atlas. *p < 0.05, **p < 0.01.
Prognostic impact of ANK3 expression in KIRC
We analyzed an association between ANK3 expression and overall survival of KIRC patients with low- and high-ANK3 expression using GEPIA2, KM plotter, and OSkirc databases. The data from GEPIA2 showed that KIRC patients with low ANK3 expression had significantly shorter overall survival than those with high ANK3 expression (Fig. 3A). Significant associations of ANK3 expression with overall survival of KIRC patients were consistently observed in KM plotter (Fig. 3B) and OSkirc (Fig. 3C) databases. In order to assess an independent predictive value of ANK3 expression, multivariate analysis was performed using the TIMER database. The analysis results confirmed that ANK3 expression was an independent prognostic factor for KIRC (Table 1). Thus, the low ANK3 expression could indicate poor prognosis in KIRC patients.
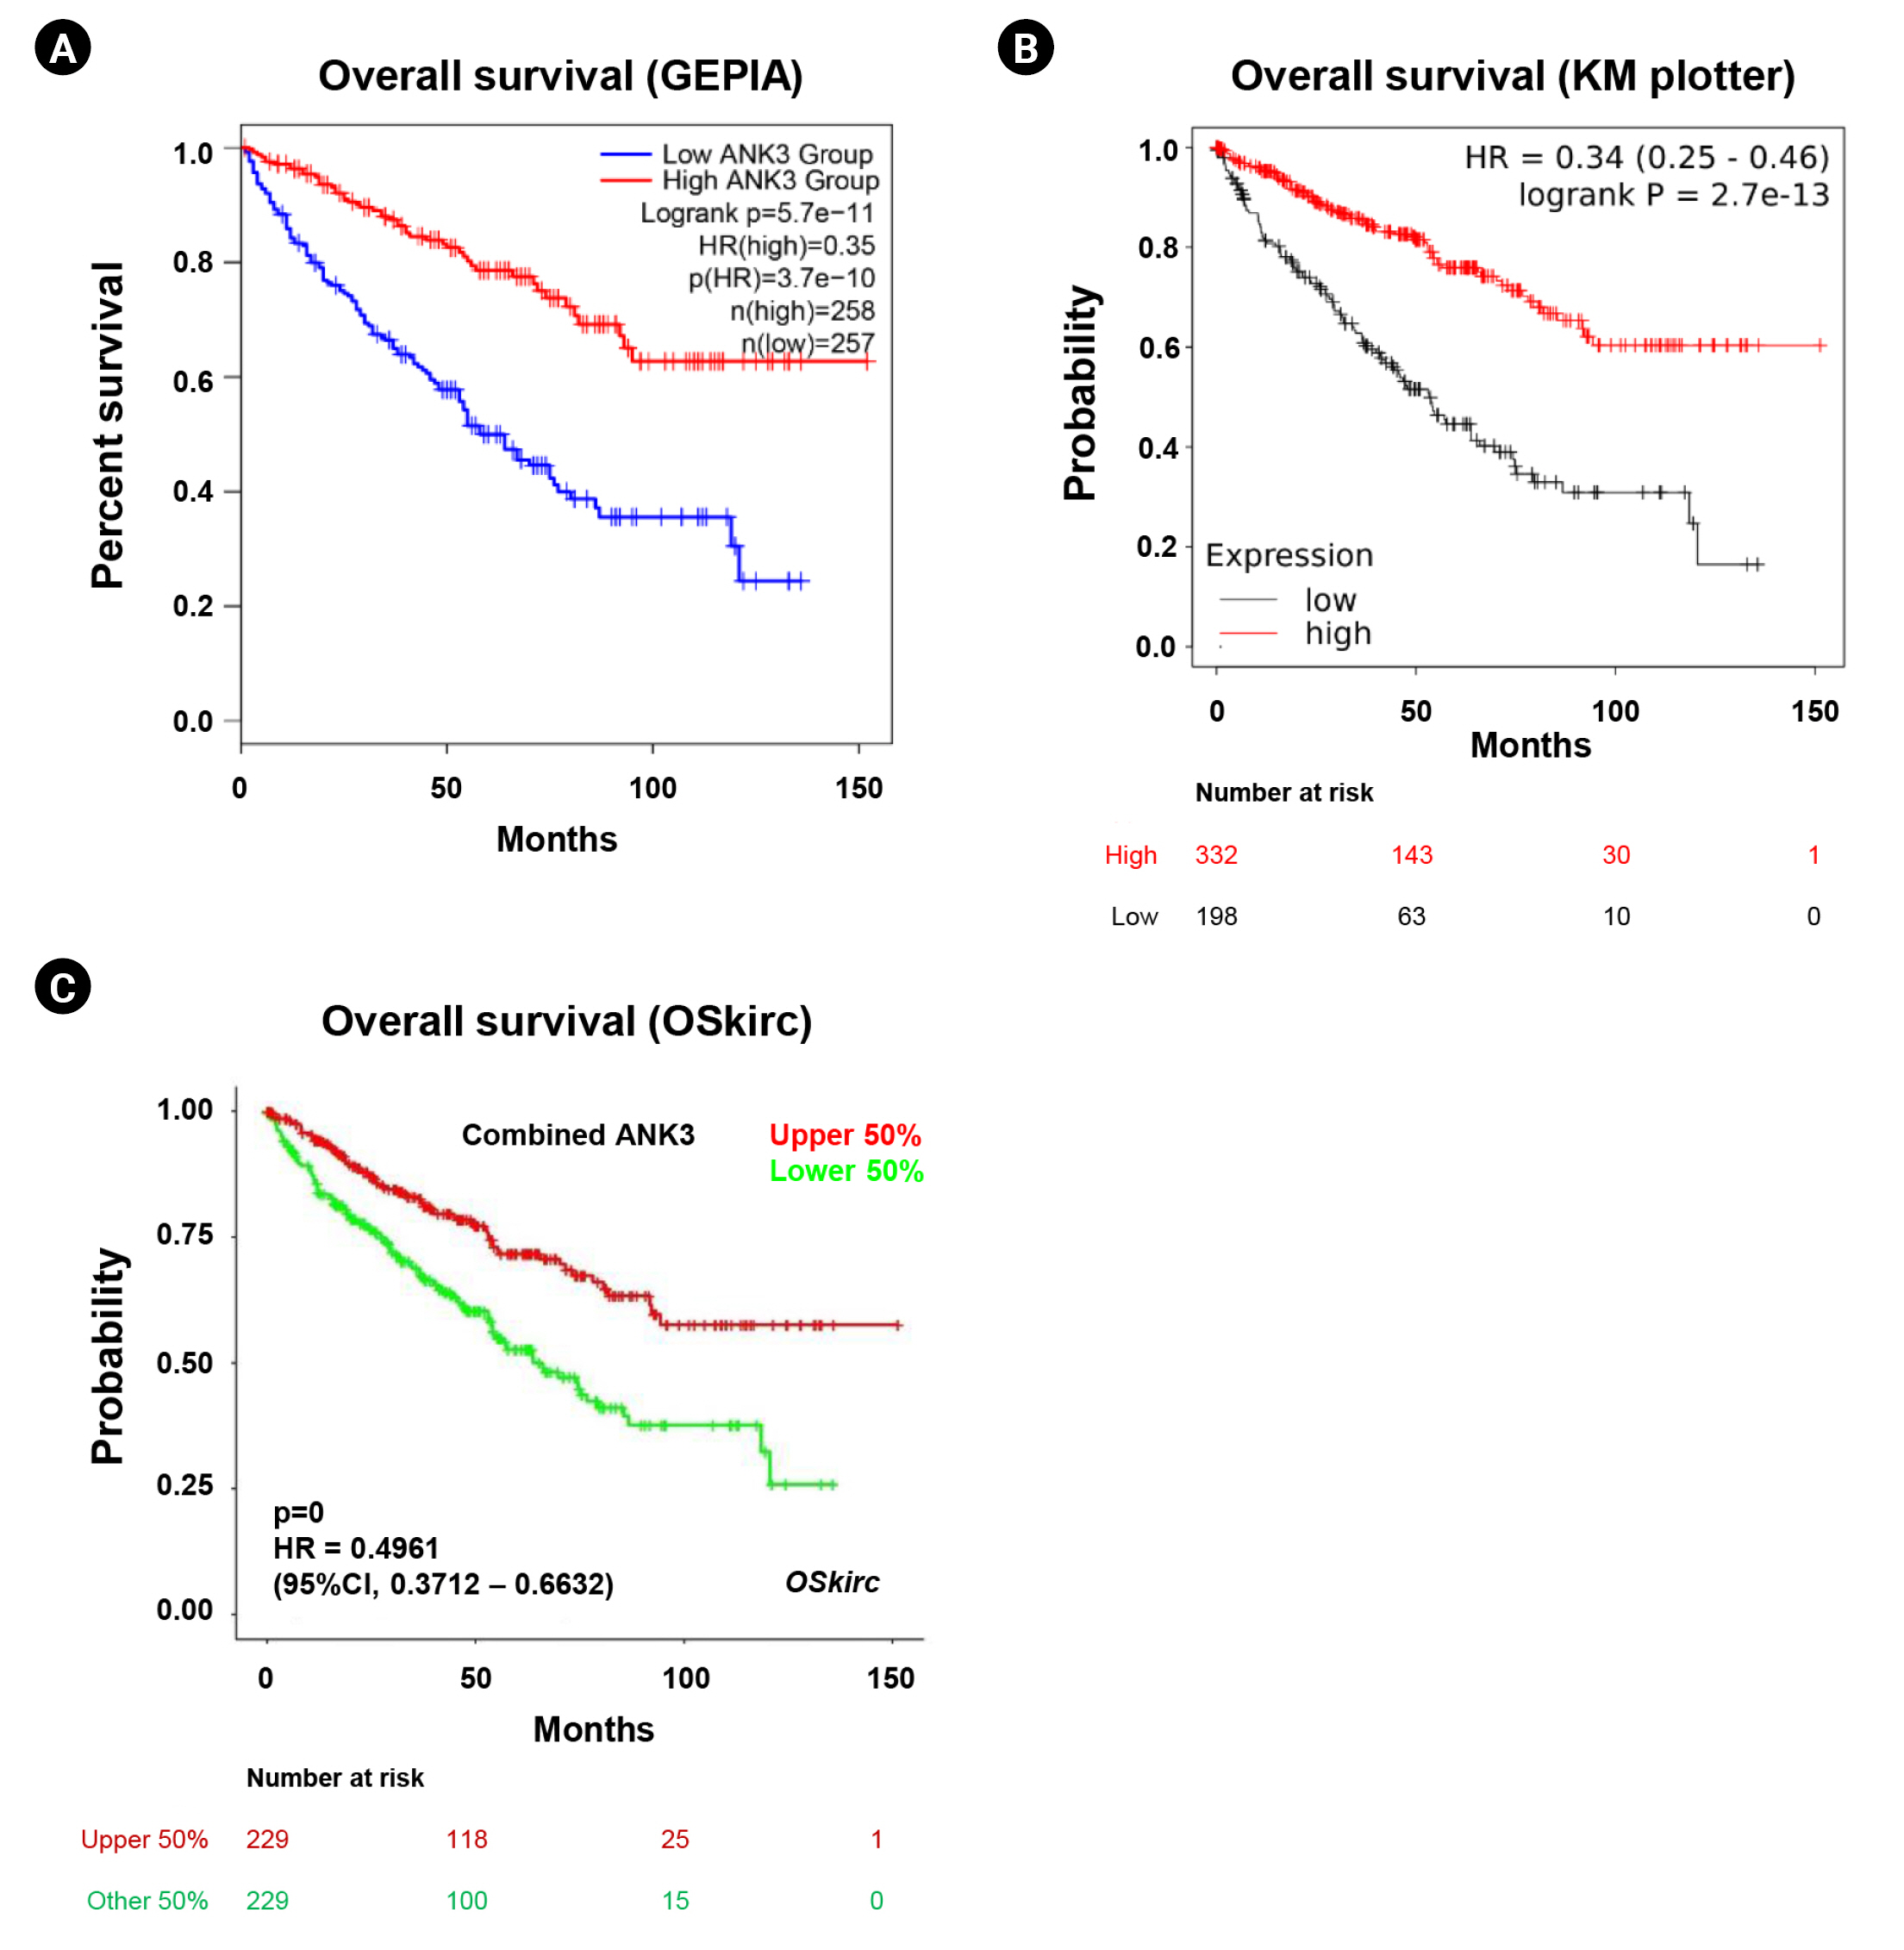
Relationship between ANK3 mRNA expression and survival outcomes of KIRC patients. KM curves for overall survival in KIRC patients with low- and high-ANK3 expression obtained from GEPIA2 (A), KM plotter (B), and OSkirc (C) databases. ANK3, ankyrin 3; KIRC, kidney renal clear cell carcinoma; KM, Kaplan-Meier; GEPIA2, Gene Expression Profiling Interactive Analysis 2; OSkirc, Online consensus Survival analysis for KIRC; HR, hazard ratio; CI, confidence interval.
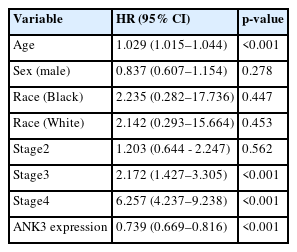
Multivariable Cox proportional hazard regression analysis of factors affecting overall survival of KIRC patients (TIMER database)
Genetic alteration of ANK3 in KIRC
Genetic alteration of ANK3 in KIRC patients was analyzed using cBioPortal. Based on TCGA datasets, ANK3 mutations were found in about 2.4% (36 of 1495 cases) of KIRC patients (Fig. 4A). There were 36 mutations distributed across the gene, in which missense mutations were the most frequent (28 of 36), followed by truncating (7 of 36) and splicing (1 of 36) mutations (Fig. 4B). In order to gain more insights into the underlying molecular mechanisms of cancer development, we further analyzed co-mutation pattern of ANK3 in KIRC. Genetic alterations of 124 genes were significantly identified in KIRC patients with ANK3 mutations (Fig. 4C, Supplementary Table 1). Top 10 genes with the most significantly co-mutated with ANK3 were MCRS1 (microspherule protein 1), SDAD1 (SDA1 domain containing 1), TTN (titin), NFAT5 (nuclear factor of activated T cells 5), PCLO (piccolo presynaptic cytomatrix protein), AJUBA (Ajuba LIM protein), NFASC (neurofascin), MSH6 (MutS homolog 6), HOXA9 (homeobox A9), and SLC7A6 (solute carrier family 7 member 6) (Fig. 4D). Among these genes, SDAD1, NFAT5, PCLO, AJUBA, and MSH6 had a significant prognostic impact on overall survival for KIRC (Fig. 4E and 4F). These data suggested that mutations of ANK3 and its co-mutated genes may involve cancer development and predict a high risk of poor prognosis in KIRC patients.
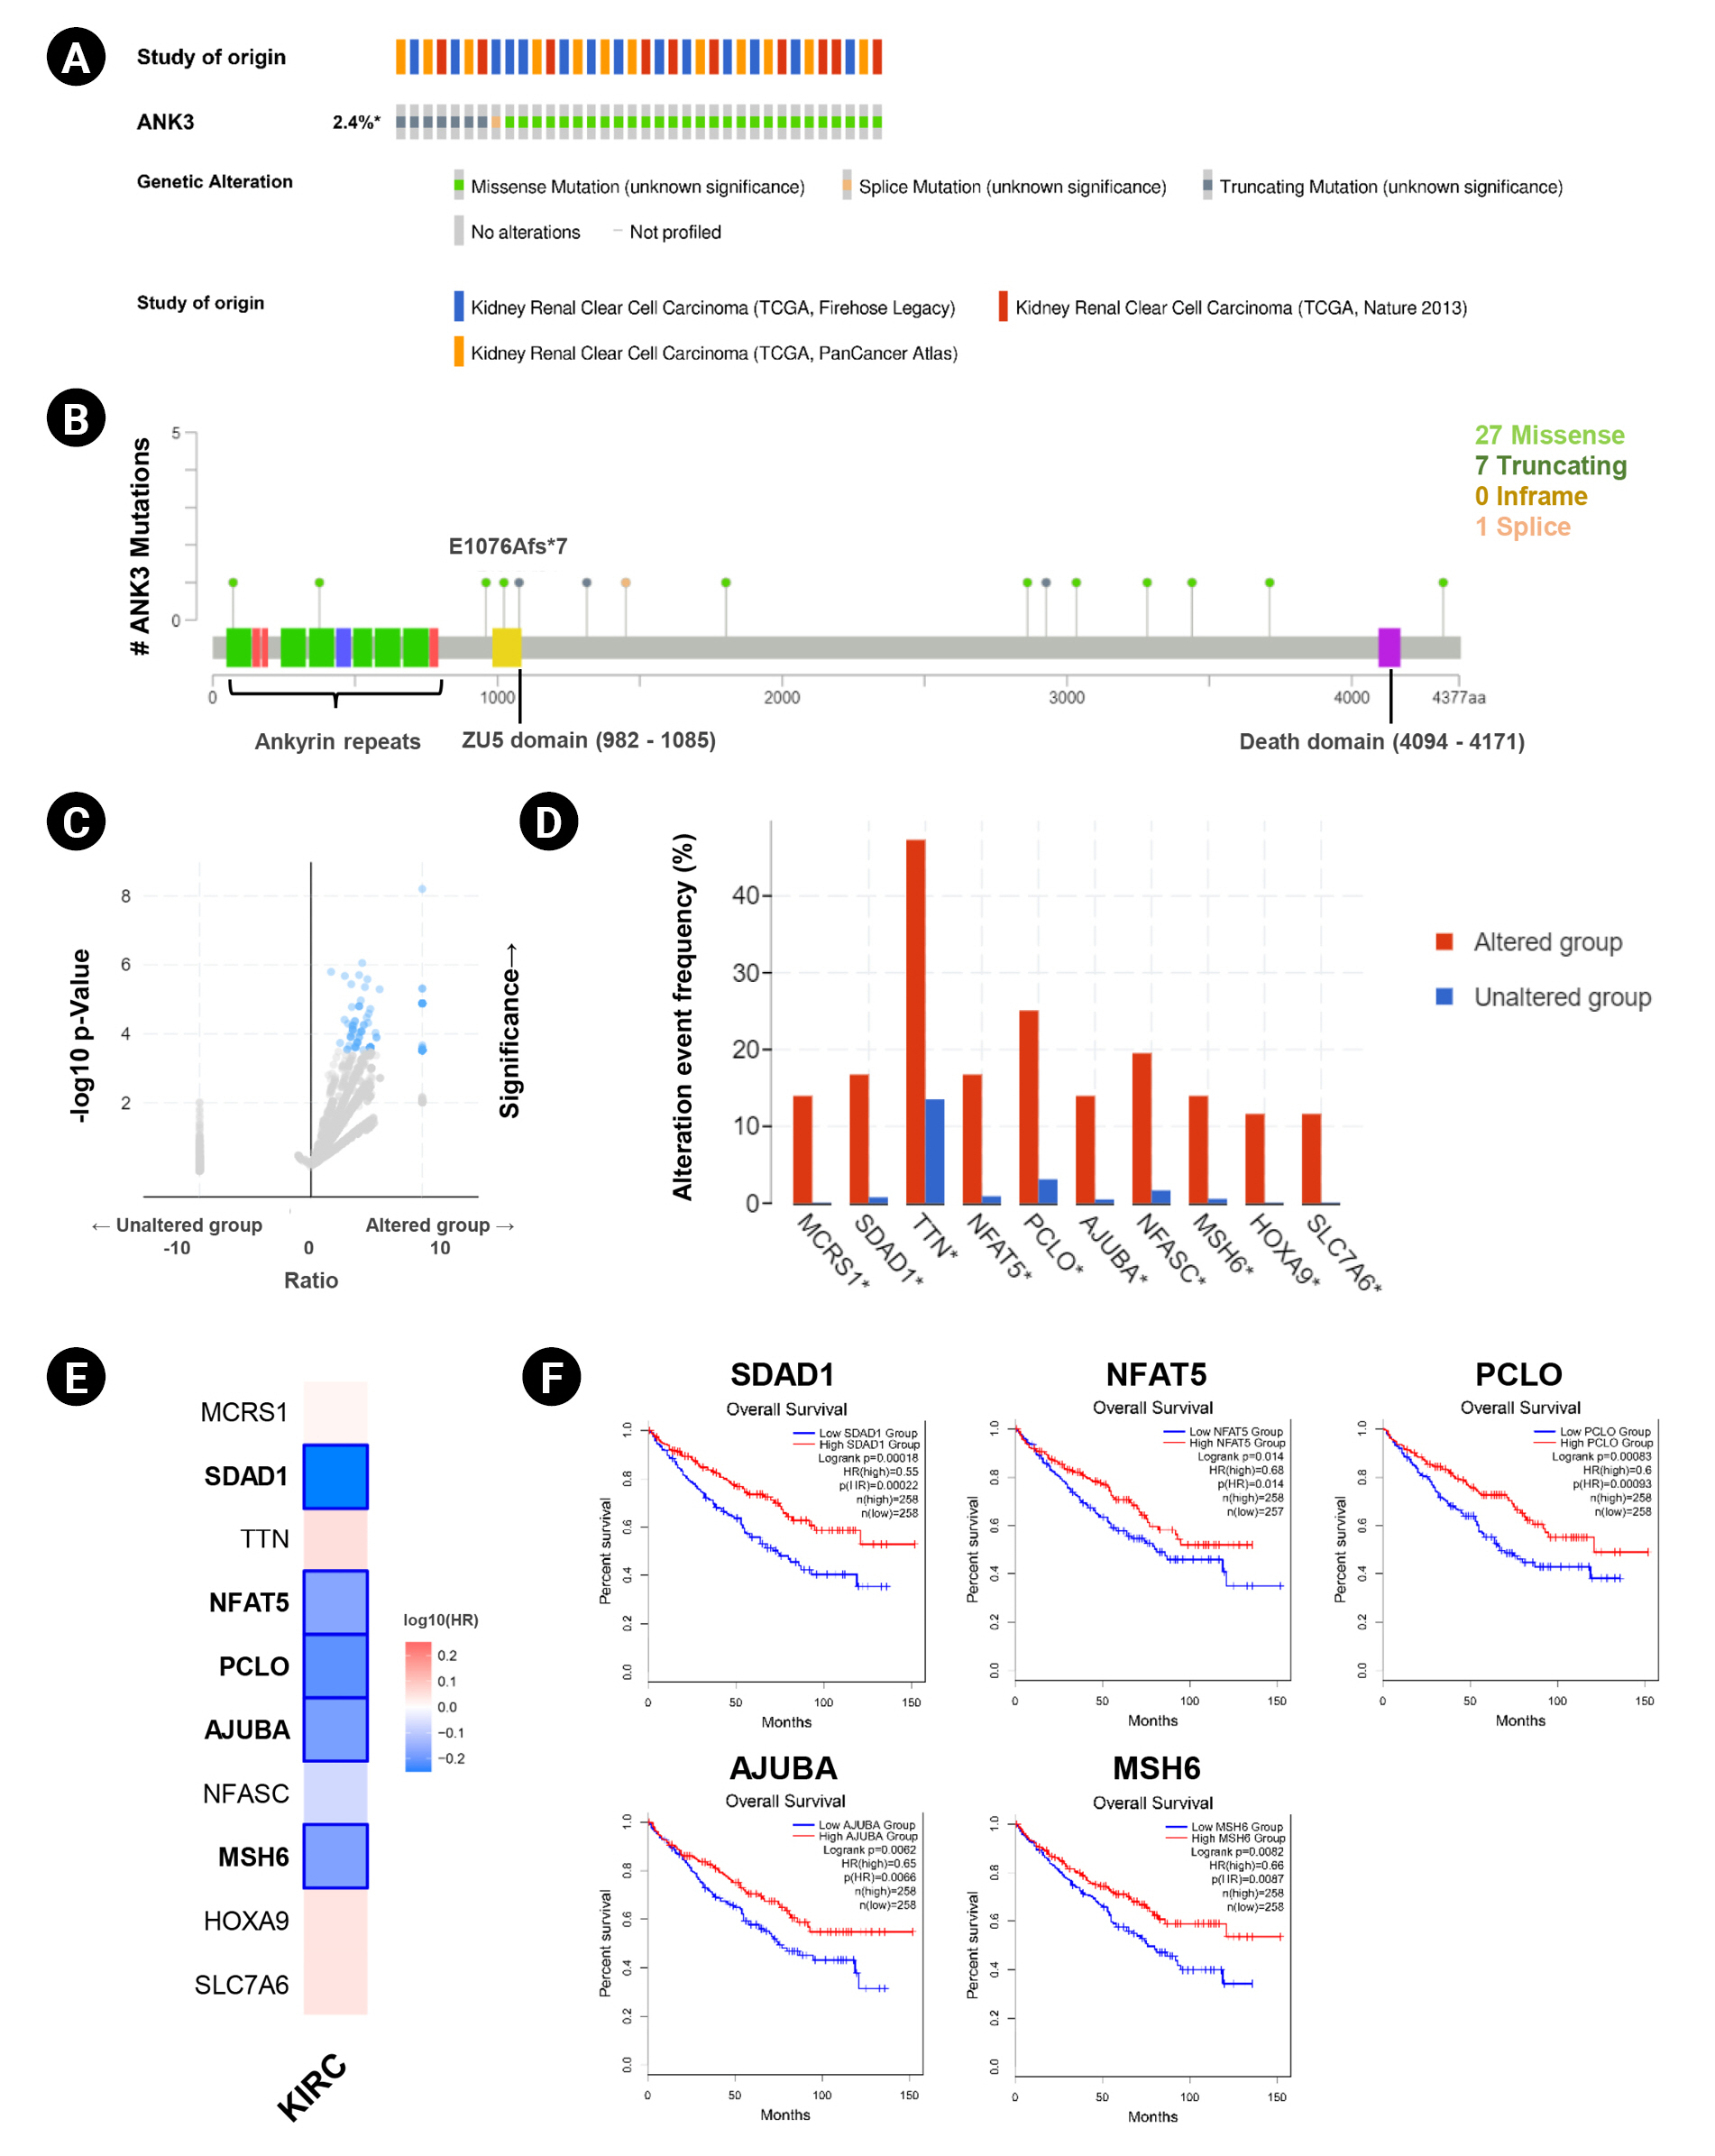
ANK3 mutations and co-mutations in KIRC. (A) Genetic alteration frequency of ANK3 in KIRC patients (cBioportal database). (B) Distribution of mutations along the ANK3 gene in KIRC (cBioportal database). (C) Volcano plot of mutated genes in KIRC patients with and without ANK3 alterations (cBioportal database). (D) Bar graph representing the alteration frequency of the top 10 genes with the most significantly co-mutated with ANK3 in KIRC patients (cBioportal database). (E) Heatmap representing HR of each ANK3 co-mutated gene for overall survival of KIRC patients (GEPIA2 database). (F) KM curves of ANK3 co-mutated genes with a significant prognostic impact on overall survival for KIRC (GEPIA2 database). ANK3, ankyrin 3; KIRC, kidney renal clear cell carcinoma; GEPIA2, Gene Expression Profiling Interactive Analysis 2; KM, Kaplan-Meier; HR, hazard ratio.
Interaction network, prognostic impact, and functional enrichment of ANK3-correlated genes in KIRC
In this study, we obtained the top 50 genes with the highest correlation with ANK3 in KIRC dataset from GEPIA2 for further analyses to define the possible roles of ANK3 in KIRC development and progression. A list of these genes is provided in Supplementary Table 2. The interaction network of ANK3-correlated genes was analyzed using GeneMANIA. As shown in Fig. 5A, these correlated genes closely interacted with each other in the network. The interactions among these genes were co-expression (91.98%), co-localization (3.53%), predicted (2.09%), physical interactions (1.85%), shared protein domains (0.3%), and genetic interactions (0.25%). Many of the genes in the network were significantly involved in several biological functions related to fatty acid and lipid metabolisms. Survival analysis using GEPIA2 revealed that most ANK3-correlated genes (49 of 50 genes) had a significant prognostic impact on overall survival for KIRC (Fig. 5B). In addition, functional enrichment analysis was also performed using ShinyGO. The data showed that these correlated genes were mainly enriched in GO biological process terms, such as “fatty acid beta-oxidation”, “carboxylic acid catabolic process”, and “fatty acid catabolic process” (Fig. 6A). The significantly enriched GO cellular component terms were predominantly involved with “peroxisome” and “microbody” (Fig. 6B). There was no significant enrichment of GO molecular function term in these correlated genes. For KEGG pathway enrichment analysis, ANK3-correlated genes were significantly enriched in several pathways, mainly including “PPAR signaling pathway”, “fatty acid degradation”, and “valine, leucine and isoleucine degradation” (Fig. 6C). These enriched pathways were closely connected with each other (Fig. 6D). Taken together, these findings suggested that ANK3 and its correlated genes may play a role in KIRC through PPAR signaling pathways and lipid metabolism.
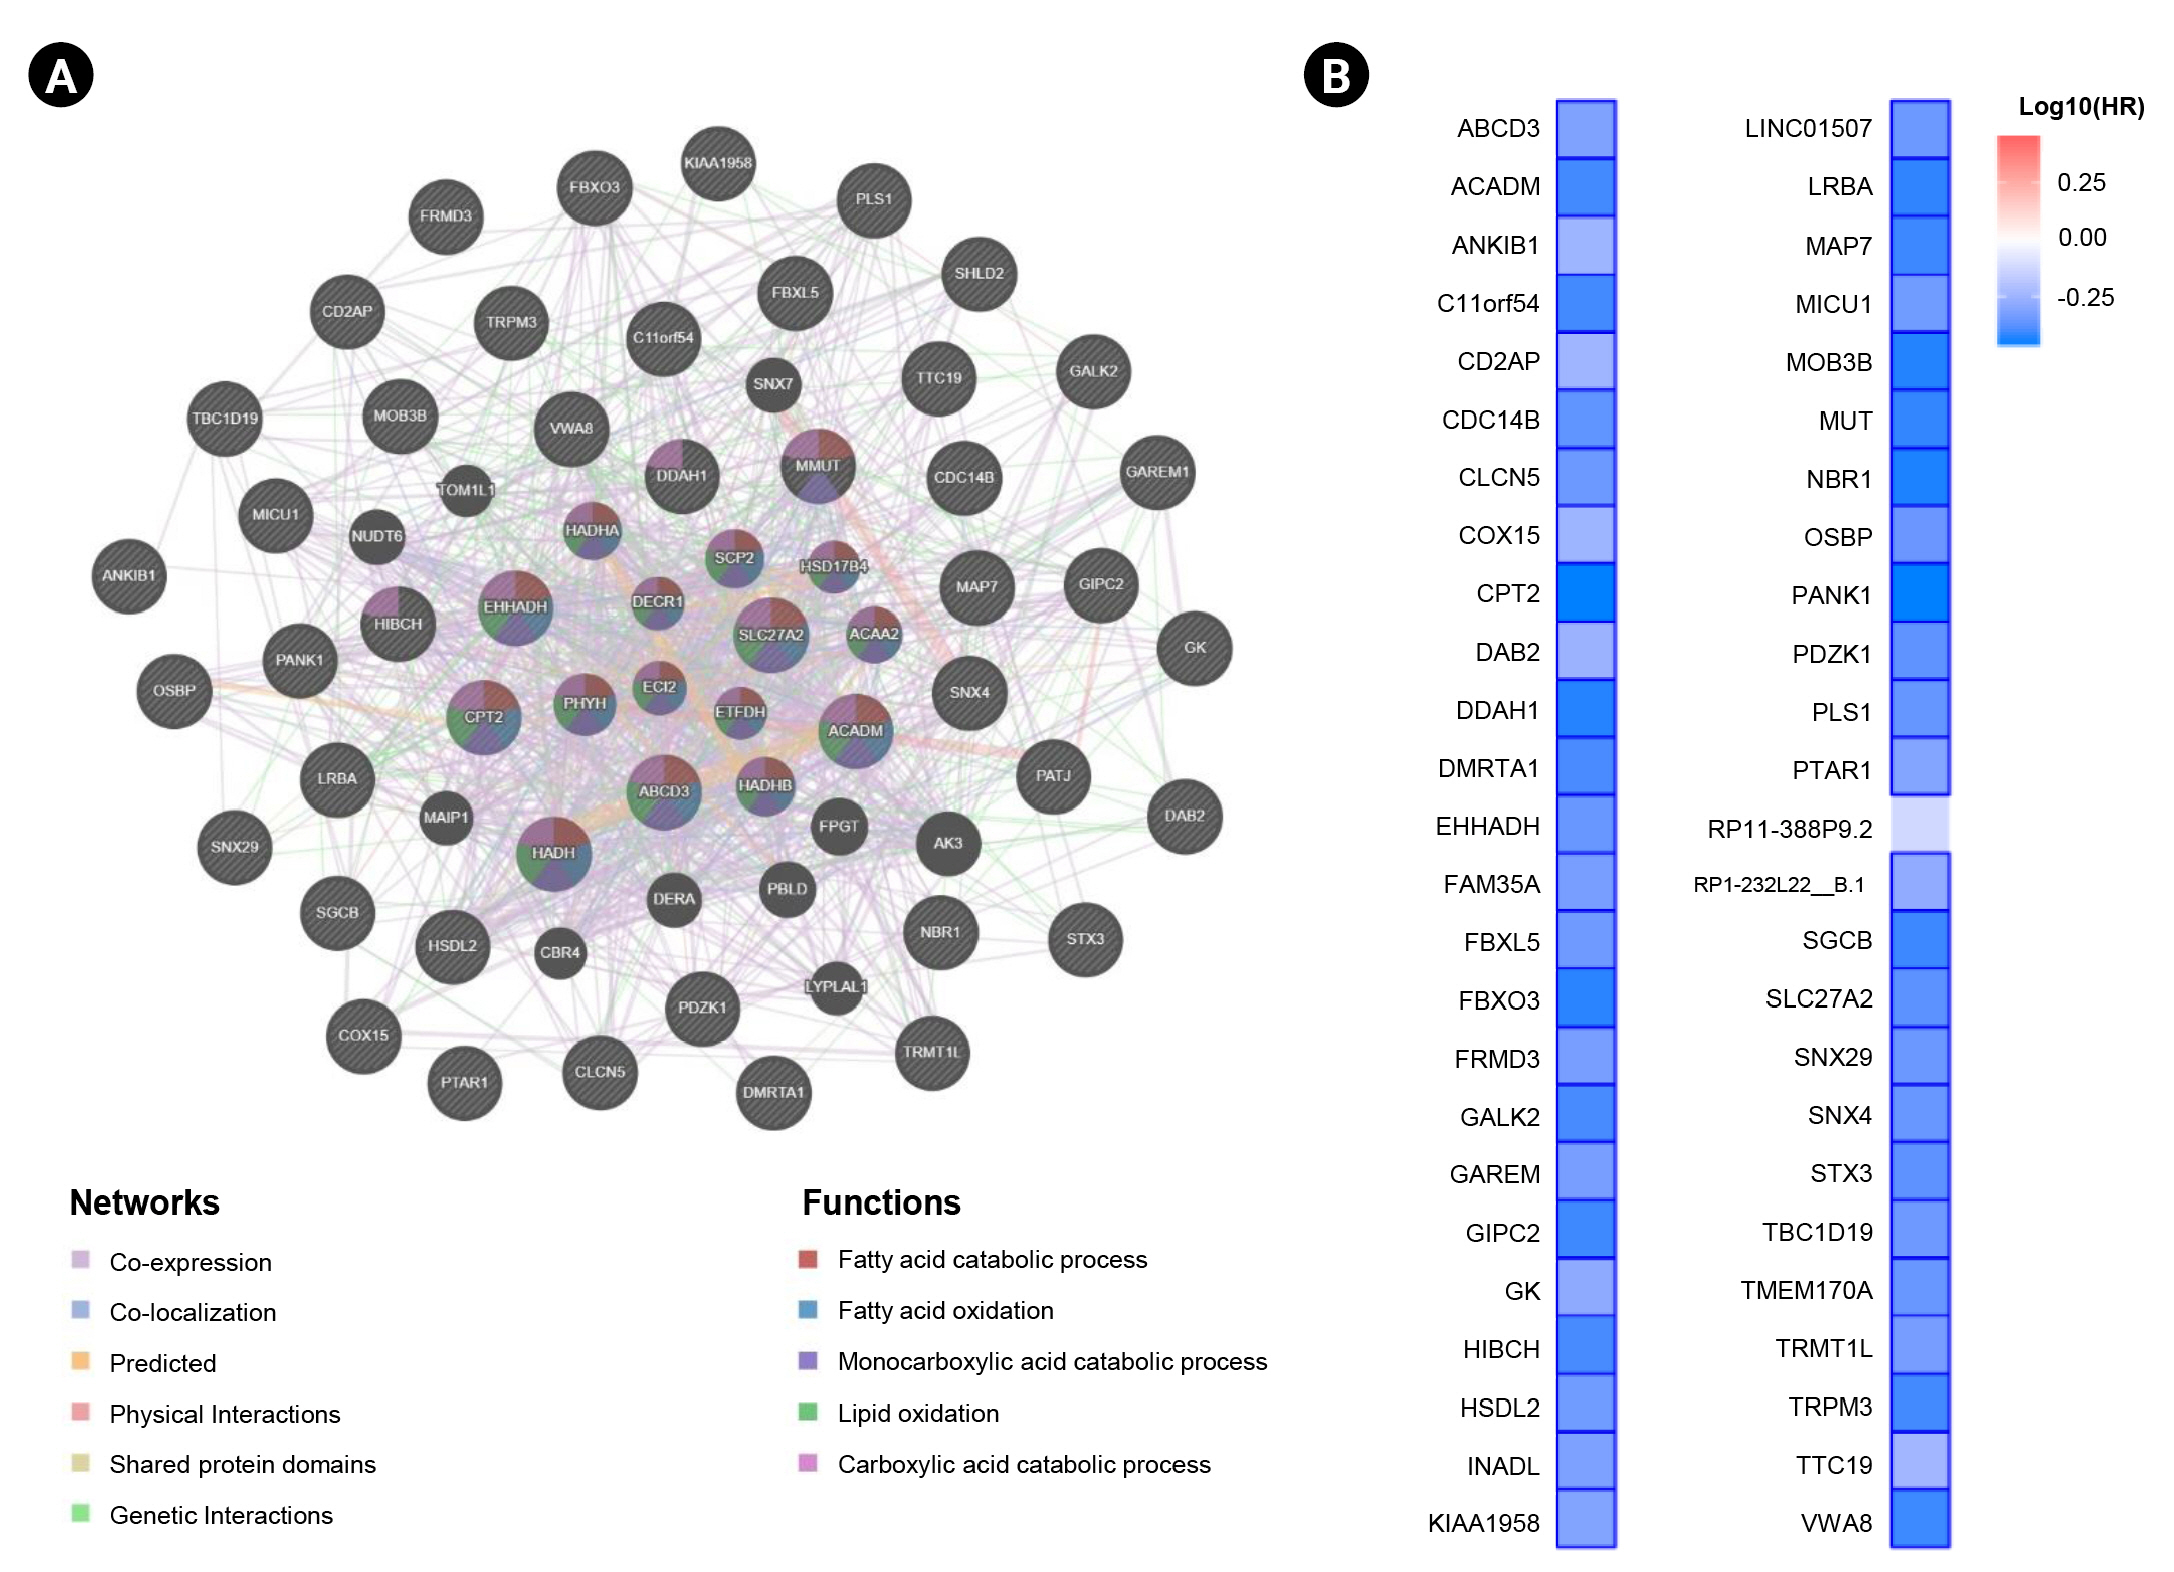
Interaction network and prognostic impact of ANK3-correlated genes in KIRC. (A) Interaction network of the top 50 genes with the highest correlation with ANK3 in KIRC (GeneMANIA database). (B) Heatmap representing HR of each ANK3-correlated gene for overall survival of KIRC patients (GEPIA2 database). ANK3, ankyrin 3; KIRC, kidney renal clear cell carcinoma; HR, hazard ratio; GEPIA2, Gene Expression Profiling Interactive Analysis 2.
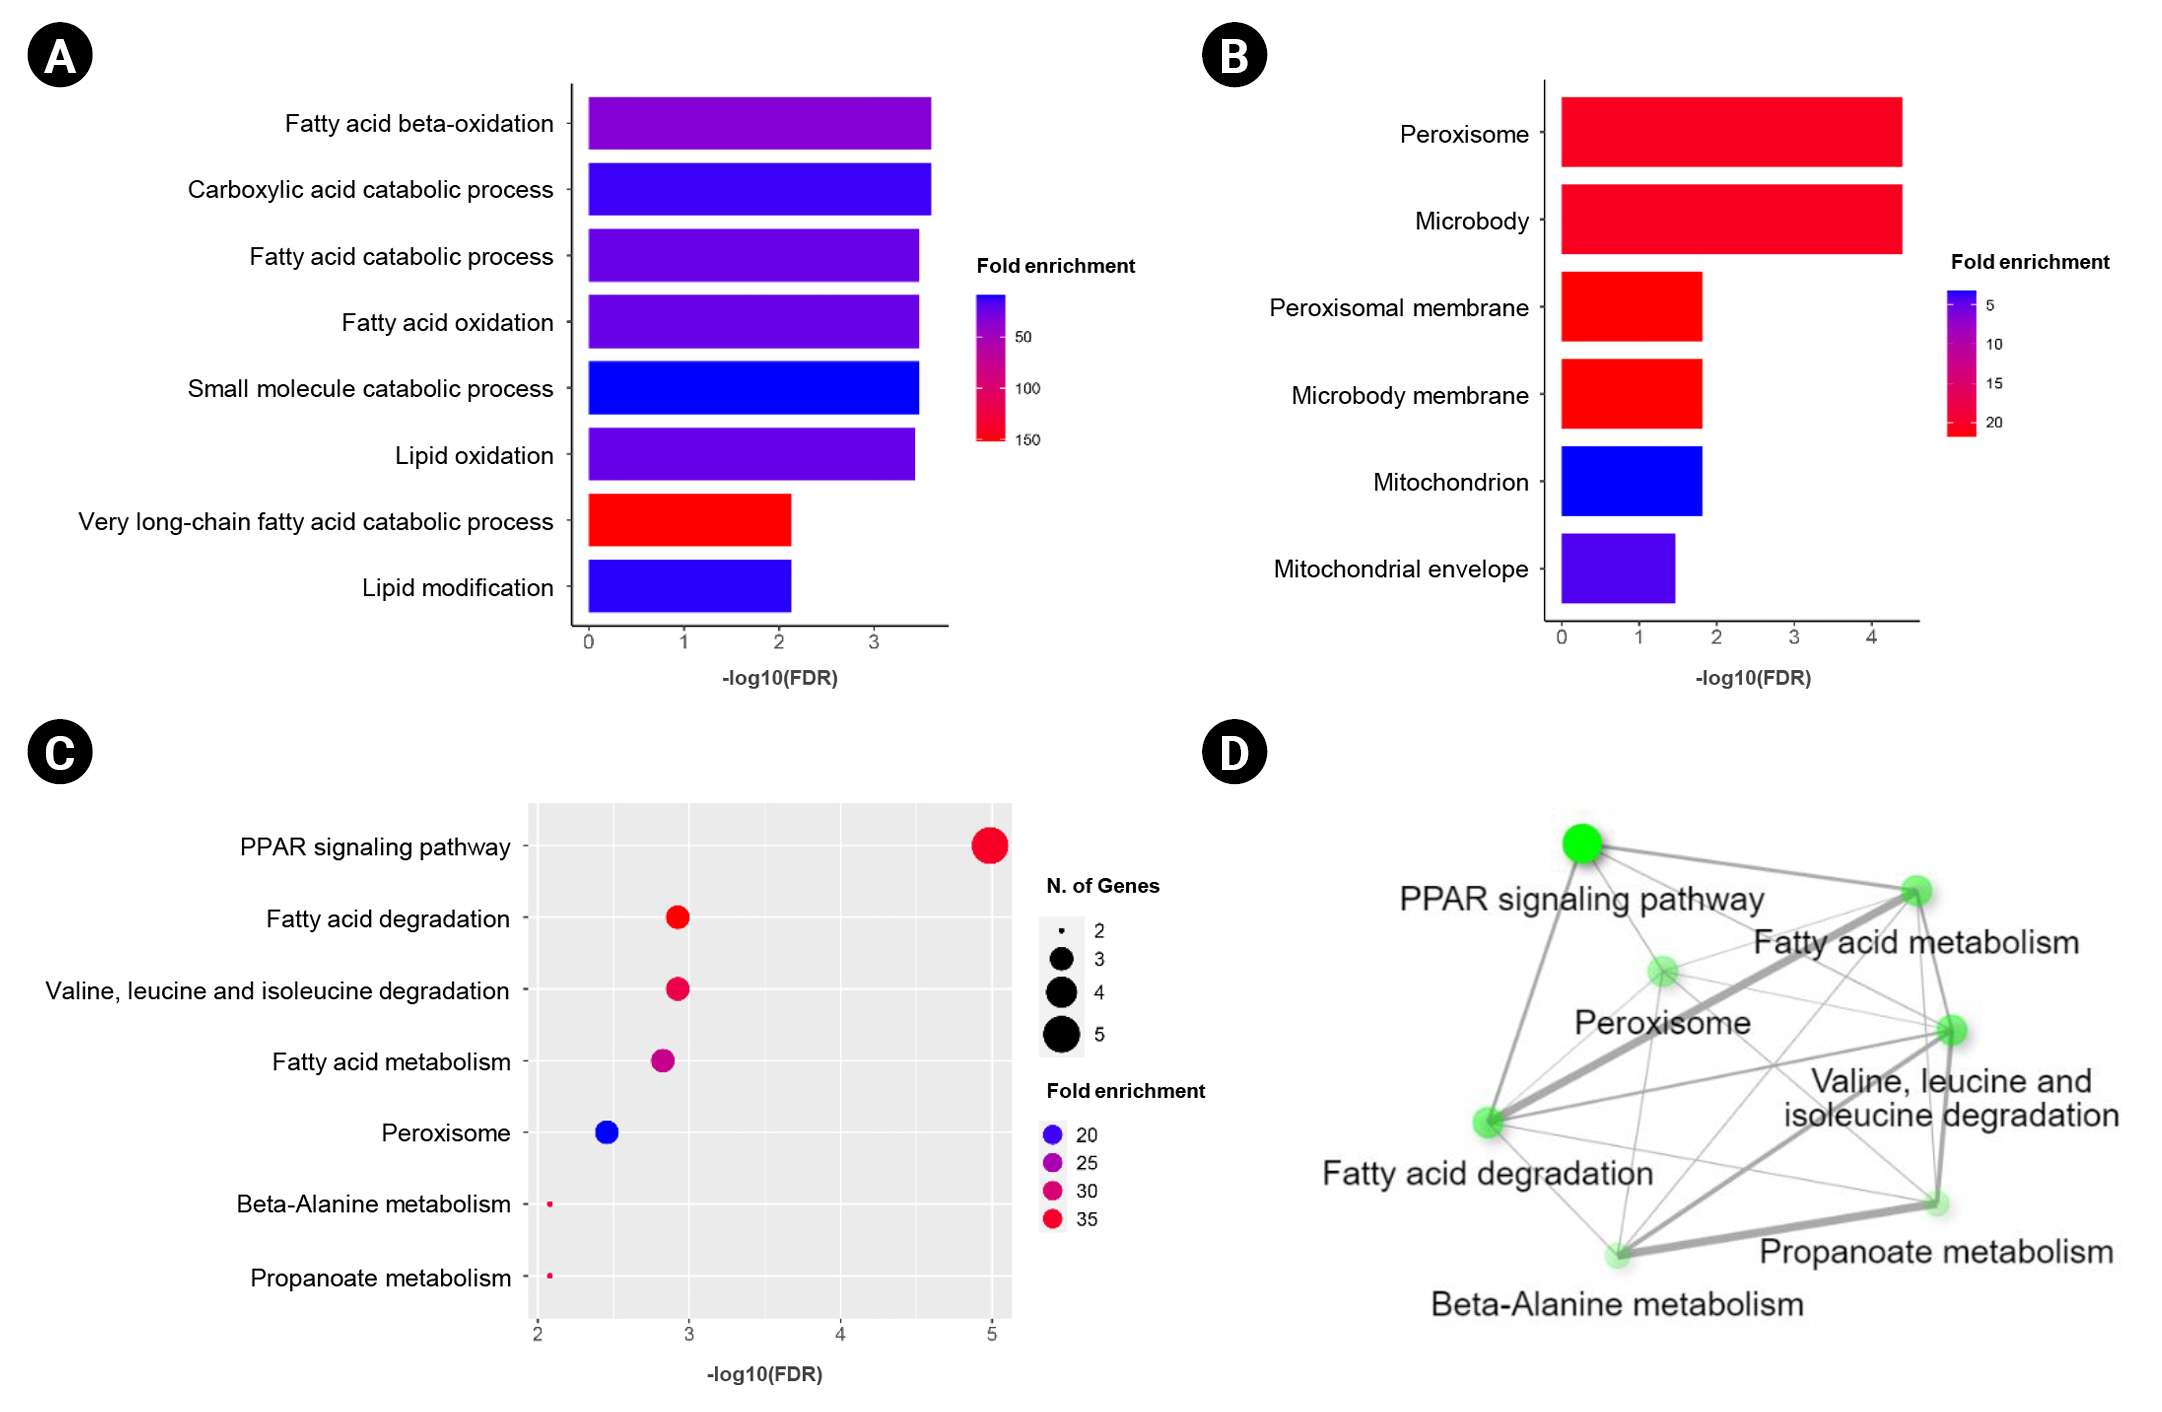
Functional enrichment of ANK3-correlated genes in KIRC. Bar graphs representing significantly enriched GO biological process terms (A) and GO cellular component terms (B) of ANK3-correlated genes in KIRC (ShinyGO database). (C, D) Dot plot and network of significantly enriched Kyoto Encyclopedia of Genes and Genomes pathway of ANK3-correlated genes in KIRC (ShinyGO database). ANK3, ankyrin 3; KIRC, kidney renal clear cell carcinoma; GO, gene ontology; FDR, false discovery rate.
Relationship between ANK3 and PPAR genes in KIRC
In order to explore a relationship between ANK3 and PPAR signaling pathway in KIRC, we employed GEPIA2 to analyze the correlation between ANK3 expression and three subfamilies of PPARs, including PPARA, PPARD, and PPARG in KIRC [30]. As shown in Fig. 7A, ANK3 expression was significantly positively correlated with PPARA and PPARG expressions, but not correlated with PPARD expression in KIRC. Furthermore, survival analysis using GEPIA2 showed that KIRC patients with low expressions of PPARA and PPARG had significantly shorter overall survival compared to high-expression groups. There was no significant association between PPARD expression and overall survival in KIRC patients (Fig. 7B). The results from the HPA database confirmed a decrease of PPARA and PPARG protein in renal cancer compared to normal kidney tissues (Fig. 7C). These results demonstrated a possible relationship of ANK3 to PPARα and PPARγ signaling pathways in KIRC pathogenesis and prognosis.
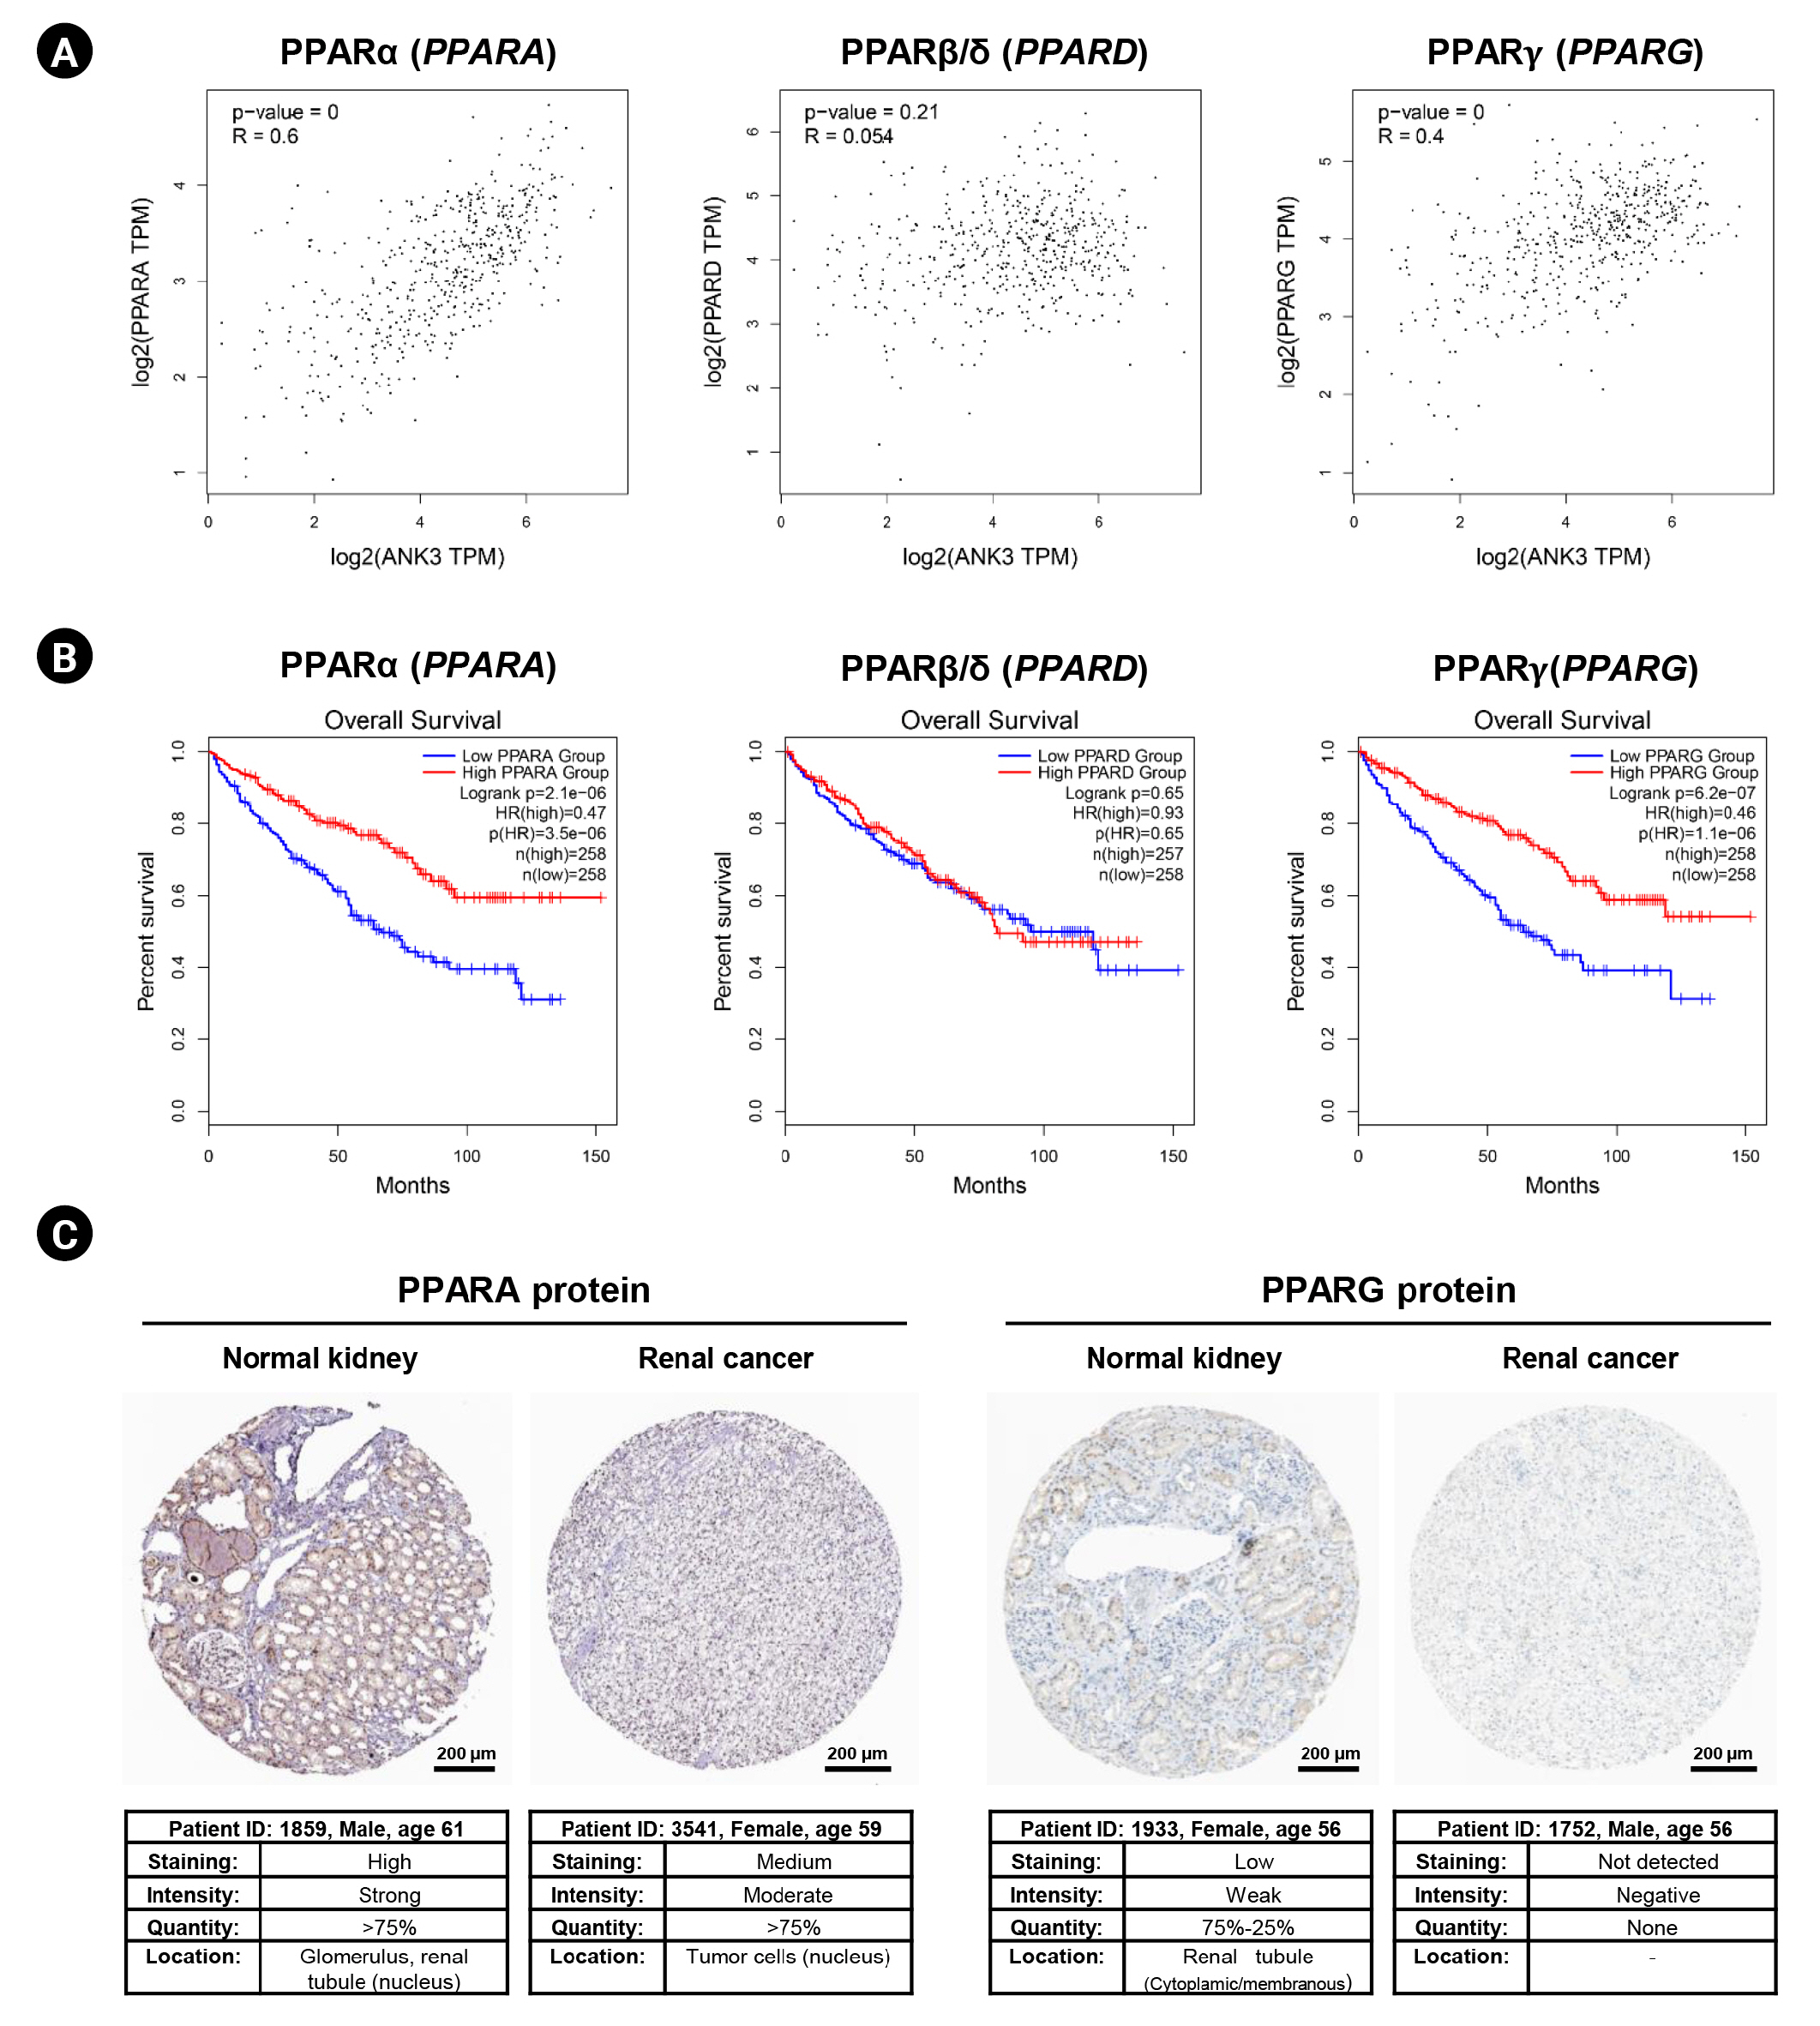
Correlation of PPAR expression with ANK3 expression and patient’s overall survival in KIRC. (A) Scatter plots representing correlation of ANK3 expression with PPARA, PPARD, and PPARG expressions in KIRC (GEPIA2 database). (B) KM curves for overall survival in KIRC patients with low- and high-expression of PPARA, PPARD, and PPARG (GEPIA2 database). (C) Representative immunohistochemical image of PPARA and PPARG protein expressions in normal kidney and renal cancer tissues (Human Protein Atlas database). PPAR, peroxisome proliferator-activated receptor; ANK3, ankyrin 3; KIRC, kidney renal clear cell carcinoma; GEPIA2, Gene Expression Profiling Interactive Analysis 2; KM, Kaplan-Meier; TPM, transcripts per million; HR, hazard ratio.
Correlation between ANK3 expression and immune cell infiltration in KIRC
Because PPAR signaling pathway does not only involve energy homeostasis, but also plays a crucial role in regulating immune function and response in cancers [31,32]. Therefore, we further investigated the correlation between ANK3 and immune cell infiltration in KIRC using TIMER2.0. As shown in Fig. 8, ANK3 expression was consistently and significantly correlated with B cells, macrophages, neutrophils, and CD8+ T cells in KIRC. These findings suggested that ANK3 expression was associated with abundance of tumor-infiltrating immune cells in KIRC tissue. The ANK3 expression may be related to anti-tumor immunity and therapeutic responses in KIRC.

Correlation between ANK3 expression and immune cell infiltration level in KIRC. (A) A heatmap representing the partial Spearman's correlation coefficient for correlation of ANK3 expression with infiltration level of immune cells, estimated by different algorithms in the TIMER2.0 database with tumor purity adjustment. (B) Scatter plots representing significant correlation of ANK3 expression and infiltration level of immune cells (TIMER2.0 database). ANK3, ankyrin 3; KIRC, kidney renal clear cell carcinoma; TIMER, Tumor Immune Estimation Resource; TPM, transcripts per million.
Discussion
ANK3 is the major form of ankyrin which is widely expressed in all nephron segments of the kidney [6,33]. It plays an important role in maintaining structural and physiological integrities of the kidney [7-9]. Recently, several studies have demonstrated that ANK3 expression is positively associated with patient’s prognosis and exerts a tumor-suppressive function in many cancers [14-16]. Therefore, ANK3 is an interesting target for further investigations on its prognostic value and role in KIRC.
In this study, our data analyses demonstrated that ANK3 mRNA and protein expression levels were significantly decreased in KIRC compared to normal tissues. Decreased ANK3 expression was positively correlated with disease stage and progression. The patients with low ANK3 expression had poor survival outcomes. These findings indicated that ANK3 expression had a favorable prognostic impact on KIRC. Our results are in line with previous studies in other types of cancer, including prostate and breast cancers [14,15], where low ANK3 expression was associated with poor survival outcomes. Therefore, ANK3 expression could serve as a predictive indicator for progression and prognosis in KIRC patients.
A number of genetic alterations have been described in KIRC. The von Hippel–Lindau (VHL) mutation is considered as an initiating factor for KIRC development [3]. Mutations in several genes, including polybromo 1 (PBRM1), SET domain containing 2 (SETD2), and BRCA-associated protein 1 (BAP1), are frequently identified and closely associated with the prognosis of KIRC [34]. To our knowledge, ANK3 mutation and its functional impact on KIRC have not been previously reported. In this study, mutations were distributed throughout the ANK3 gene. Among these, missense and frameshift mutations were found in ZU5 domain. It has been shown that the ZU5 domain of ANK3 serves as a binding site for β-spectrin to organize membrane components [35] and also plays a role in regulation of apoptosis [35,36]. These findings implied that ANK3 mutations may affect its function in kidney homeostasis and carcinogenesis. ANK3 mutations were found in only a small number of KIRC patients (2.4%), suggesting that such mutations might not directly influence ANK3 expression level. Thus, epigenetic mechanisms could play a role in regulation of ANK3 expression in KIRC and merit further studies. Because ANK3 mutations occur at a very low frequency in KIRC patients, they may not have a direct association with prognosis. However, patients with ANK3 mutations frequently carry additional mutations in several genes with strong favorable prognostic impact on overall survival for KIRC. Among these ANK3-comutated genes, mutations and loss of expression of MSH6 have been reported and thought to be related to KIRC development [37,38]. In addition, MSH6 has been identified as a predisposition gene in early-onset colorectal cancer and sporadic triple-negative breast cancer [39,40]. On the basis of these findings, it was suggested that mutations of ANK3 and its co-mutated genes might involve cancer development and predict a high risk of a poor prognosis. However, further investigations are needed to confirm their clinical relevance in KIRC patients.
Previous studies have demonstrated that ANK3 regulates various cellular processes in cancer cells, including cell cycle, apoptosis, and invasion [14-16]. Its tumor suppressive mechanisms are related to modulation of androgen receptor signaling pathway [14,15] and suppression of epithelial-mesenchymal transition process [16]. However, the precise role of ANK3 and its mechanisms in KIRC carcinogenesis remains largely unknown. In this study, functional enrichment analyses of ANK3-correlated genes revealed potential involvement of ANK3 in PPAR signaling pathways and lipid metabolism in KIRC. PPARs are nuclear receptor transcription factors which are classified into three main subfamilies: PPARA, PPARD, and PPARG. They play a major role in regulation of lipid metabolism and energy homeostasis [30]. Several lines of evidence have indicated that PPARs have a strong implication in cancers and have been recognized as promising therapeutic targets [31]. PPARα and PPARγ are widely considered to exert tumor suppressive function, whereas PPARβ/δ seems to play oncogenic role in many types of cancers [31]. In KIRC, PPARα and PPARγ have been shown to regulate tumor growth and metastasis via modulations of lipid and other metabolic pathways [41-44]; but there was no study reporting the role PPARβ/δ in this cancer. In concordance with these findings, our analyses revealed that ANK3 expression was positively correlated with PPARA and PPARG, but not PPARD expression in KIRC. Low expressions of PPARA and PPARG were associated with poor prognosis in the patients. Decreased protein levels of PPARα and PPARγ were also confirmed in renal cancer tissue. Taken together, our results implied that PPARα and PPARγ play a more prominent role than PPARβ/δ in carcinogenesis and prognosis of KIRC. A previous study has reported that C-terminal region of ANK3 protein binds to sterol regulatory element-binding protein (SREBP), which is a transcriptional factor involved in regulation of fatty acid metabolism [45]. SREBP can activate PPARγ through stimulating the production of its endogenous ligand [46]. These findings suggested that ANK3 might exert its tumor suppressive role in KIRC through modulation of PPARα and PPARγ pathways.
Emerging evidence indicates that PPARs play a crucial role in regulation of immune cell function and response [32]. Cancer progression, prognosis, and treatment outcomes of the patient with KIRC are strongly influenced by immune cells in tumor microenvironment [47-52]. Therefore, it was hypothesized that ANK3 expression might be related to tumor-infiltrating immune cells in KIRC. In our study, we found a significant correlation between ANK3 expression and infiltration level of various immune cells, including B cell, macrophage, neutrophils, and CD8+ T cell. However, there was a weak to moderate correlation observed from our analysis. Therefore, further experimental validations should be conducted to confirm the potential of ANK3 as an indicator for immune infiltrate and response in KIRC.
To our knowledge, our study is the first to show the potential role of ANK3 in prognosis and its possible relationships with PPARα/PPARγ signaling pathway and immune infiltration in KIRC. However, there are several limitations to this study that should be considered. First, we conducted bioinformatics analysis with a limited number of publicly available datasets. Although TCGA is a large and comprehensive dataset, it may not fully represent all KIRC patients. Future perspective and more independent cohort studies would help to confirm the prognostic significance of ANK3 in KIRC. Second, further in vitro/in vivo experiments are needed to address the oncogenic role of ANK3 and its mechanisms involved in regulating PPARα/PPARγ signaling pathways in KIRC. Finally, clinical relevance and underlying mechanism of ANK3 in modulating immune response in KIRC requires further investigations.
In conclusion, our findings demonstrated the prognostic significance of ANK3 and its potential involvement with PPARα/PPARγ signaling pathway and immune cell infiltration in KIRC. ANK3 could serve as a prognostic biomarker and promising therapeutic target for KIRC.
Notes
Authors’ Contribution
Conceptualization: KS, SA. Data curation: KS, SA. Formal analysis: KS, SA. Funding acquisition: KS, SA. Methodology: KS, SA. Writing – original draft: KS, SA. Writing – review & editing: KS, SA.
Conflicts of Interest
No potential conflict of interest relevant to this article was reported.
Acknowledgements
This work was supported by the Office of the Permanent Secretary, Ministry of Higher Education, Science, Research and Innovation (OPS MHESI), Thailand Science Research and Innovation (TSRI) and Mae Fah Luang University.
Supplementary Materials
Supplementary data can be found with this article online at http://www.genominfo.org.
List of mutated genes that were significantly enriched in kidney renal clear cell carcinoma patients with ANK3 mutations (cBioPortal database)
List of the top 50 genes that were positively correlated with ANK3 in kidney renal clear cell carcinoma (GEPIA2 database)