Introduction
The Convention on Biological Diversity (CBD) defines biodiversity as "the variety of life on Earth and the natural patterns" [1,2]. CBD has underlined the importance of abundant biodiversity in the sustainable use of natural resources [3]. Moreover, maintaining biological coexistence for all organisms on earth, including animals, plants, and microbes, is imperative for human welfare and quality of life [4]. Thus, many researchers use quantitative measures of biodiversity in an attempt to sustain and restore ecosystems [5].
Biodiversity is generally measured by statistical indices based on the emergence and/or existence of various organisms such as plants, animals, and microbes; these indices can provide quantitative criteria with increased confidence for biodiversity [6,7]. Of the statistical indices, Shannon-Wiener index [8], species richness, and evenness [9] have been widely used as the gold standards, in spite of traditional methods. The Shannon-Wiener index is based on information theory and is measured using the concept of entropy, and it is applied to estimate the degree of species diversity in a region [10]. Species richness and evenness measure the number of different species per sample and the relative abundance of the different species, respectively [11].
For measuring biodiversity, there are a few non-commercial tools, such as the Vegan package in R [12], EstimateS [13], and the web-based Shannon Entropy Calculator (http:// www.changbioscience.com/genetics/shannon.html). Although they are highly useful, some of them are difficult and complicated for biologists to use, especially some programs involving R package. While the web-based tools are easy to use, they are not suitable for personal and/or big data sets. Furthermore, some programs do not serve any function for long-term investigations of data sets using time-series analyses for biodiversity.
We developed the VBioindex tool to aid scientists in evaluating the Shannon-Wiener index, species richness, and evenness. Additionally, this program depicts relative dominance for each species. As VBioindex supports biodiversity analyses for a given period (e.g., for a month, quarter, or year), users can easily analyze a variety of biodiversity data while applying a time-series analysis.
VBioindex
VBioindex supports four statistical indices-the Shannon-Wiener index, species richness, evenness, and the relative dominance of species-that are widely used as important criteria to evaluate ecosystems.
The Shannon-Wiener index (H') was designed to predict the next letter of communication in a random set of data and to quantify entropy in terms of uncertainty or information content [10]. It has been widely applied in a variety of fields, such as biology and ecology. H' is measured using entropy with the proportion of individuals (n) for total emerged species (s) [10].
Species richness (DMg), known as Margalef's richness index, is a measure of the variety of species in a given area or sample [10], which is calculated based on emerged species (s), and the individuals (n) of total emerged species [14].
Species evenness (E) is the degree of the distribution of individual organisms among species [15], which is measured using H' and the log of emerged species (s) [16].
Relative dominance (RD) is the frequency of individuals of a species, which generally presents the degree of dominance for a species as a percentage [17].
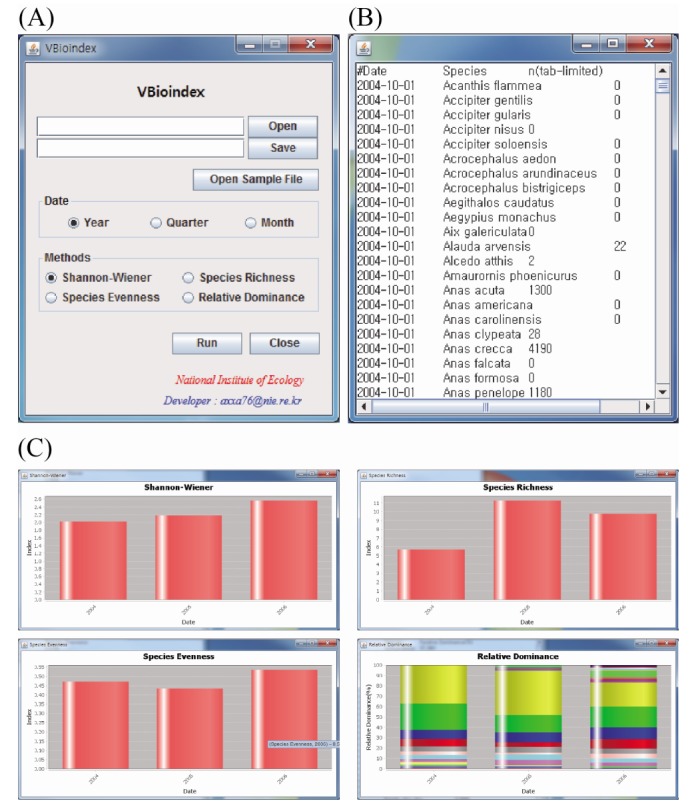
VBioindex is implemented by clicking a few buttons, such as Open, Save, and some selectable radio buttons (Fig. 1A). An input data file is accepted as a tab-delimited file, labeled with the date, species name, and number of individuals (Fig. 1B). The results of the four methods are graphically represented charts with a tab-delimited text output file (Fig. 1C). Along with presenting these biodiversity indices, VBioindex allows time-series analyses at a monthly, quarterly, and yearly basis for all statistical methods, the functions of which are useful in analyzing long-term species diversity. VBioindex is programmed in Java language (higher than version 1.7), and it can be used in all operating systems in which a Java Virtual Machine has been installed.
Conclusion
Statistical indices evaluating ecology, such as the Shannon-Wiener index, species richness, evenness, and relative dominance, are considered important criteria to sustain and restore ecosystems. Although there are a few programs for these indices, some programs are inconvenient to use and do not support various indices. We developed VBioindex, a user-friendly program that is capable of measuring the Shannon-Wiener index, species richness, evenness, and relative dominance. In addition, VBioindex offers options with which a user can analyze a variety of biodiversity data while applying a time-series analysis. VBioindex outputs a tab-delimited text file with visual charts and users can use the output text file with links to other statistical programs for a variety of ecological studies such as comparative analyses between many datasets. VBioindex is publically accessible at http://sourceforge.net/projects/vbioindex/.