Introduction
Membrane proteins play crucial roles in organismal transduction of information. Molecular recognition in biological membrane systems is the initial process triggering external factors to be passed into the inner part of a cell. G protein-coupled receptors (GPCRs), which consist of 7 transmembrane segments, play pivotal roles for signal transduction in higher eukaryotes and organize the largest families of proteins in the human genome [1]. The fact that drugs targeting GPCRs constitute over one-third of pharmaceuticals shows the importance of GPCRs as drug targets [2].
Adenosine receptors (AdoRs) belong to a family of rhodopsin-like class A GPCRs, which constitute the largest portion of GPCRs in humans, including olfactory receptors, and there are four known subtypes of AdoRs-namely, AdoR1, AdoRA2A, AdoRA2B, and AdoR3 [3, 4]. Although these AdoR subtypes have distinct amino acid sequences and tissue-specific distribution, their endogenous agonist and ligand-binding pockets are highly conserved.
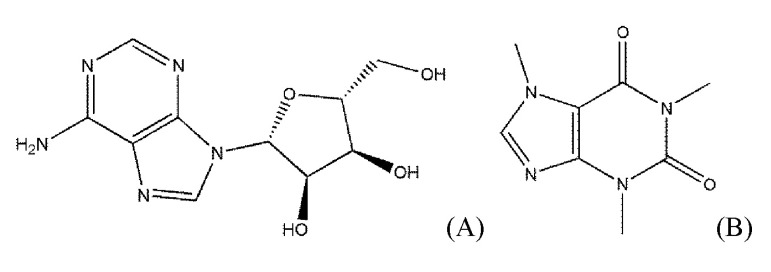
The biogenic nucleoside adenosine (Fig. 1) exerts its effects by interacting with AdoRs that are involved in various diseases, such as cardiac ischemia, arrhythmia, neurodegeneration, diabetes, glaucoma, and inflammation [5]. The physiological effects of AdoRs can be used for diagnoses and planning of the surgical strategies, such as in coronary artery diseases [6].
Olfaction, the sense of smell, is also mediated by class A GPCRs-namely, olfactory receptors. The fundamental mechanism of olfaction is now under some controversy [7-9]. Various attempts were introduced to describe the molecular mechanism of receptor-ligand recognition in olfaction, such as the binding theory and vibration theory [10-12]. The former, where the specificity of ligand is explained by molecular shape, has been developed into a concept of a pharmacophore and is generally accepted by researchers. Nevertheless, this is not sufficient to give the account of ligand variety and agonism complexity of GPCRs.
In recent decades, there have been many efforts to find an efficient way to seek or make appropriate ligands working on the target receptors through a chemogenomic approach. Application of molecular descriptors can make an efficient way to discriminate ligand binding modes in receptor-ligand relationships in such cases as in silico chemogenomic screening [13]. Molecular descriptors encoding information about the molecular structure can be classified by the dimensionality of their molecular representation, and they are almost on the structural, topological, and geometrical bases [14]. They are also including information on dipole moment, electric polarizability, and electrostatic potential in their data types.
Lately, a computational approach was carried out to search for a molecular vibration-activity relationship in the agonism of histamine receptors, and the author suggested that the molecular vibrational frequency pattern may play a role as a possible molecular descriptor for histamine receptor ligands [15]. The EigenVAlue (EVA) descriptor is also based on infrared range molecular vibrations among the various molecular descriptors and is a unique one, based on eigenvalues corresponding to individual calculated normal modes among various molecular descriptors [16, 17].
In the present paper, we tested the potential of the corralled intensity of molecular vibrational frequency (CIMVF) [15] as a molecular descriptor, compared to the EVA descriptor and other descriptors for the classification of AdoR ligands.
Methods
Dataset
All 46 ligand molecules in the dataset, comprising 23 AdoR agonists and 23 antagonists, are shown in Table 1, with the Tanimoto distance of each ligand from adenosine.
The Tanimoto coefficient is a widely used measure of molecular structural similarity. The coefficient is defined as Tc = Nab/(Na + Nb - Nab), with Nab being the number of common bits, Na the unique bits in molecule a, and Nb the unique bits in molecule b, using a molecular fingerprint [18]. In this study, the molecular similarity to adenosine was calculated as the Tanimoto coefficient using the 38-bit set. The simplified molecular-input line-entry system (SMILES) and 3-dimensional structure data format (SDF) files of the dataset were downloaded from the PubChem Compound Database in National Center for Biotechnology Information (NCBI) and used in further analyses.
Molecular descriptors
Molecular fingerprints: MACCS keys, PubChem, and Klekota-Roth fingerprint
Molecular fingerprints are binary bit string representations that capture diverse aspects of molecular structure and properties and are popular tools for virtual screening [19]. In this study, three fingerprints-MACCS keys [20], PubChem fingerprint [21], and Klekota-Roth fingerprint [22]-were tested to be compared with the Tanimoto coefficient and other descriptors. The descriptor numbers of the MACCS, PubChem, and Klekota-Roth fingerprints are 320, 881, and 4860, respectively. The MACCS keys of each ligand were generated by a MACCS key generator, and the other two fingerprints of the ligands were calculated by PaDEL-Descriptor [23].
EVA descriptor
An ideal molecular descriptor should encode all the features of a molecule in numerical form. EVA, based on the normal coordinate eigenvalues, is derived from calculated infrared range vibrational frequencies and consequently has the characteristic feature of molecular-specific vibration. The resulting vibrational frequencies were then convolved using a sum of Gaussian functions to generate a pseudospectrum of 3N-6 overlapping kernels: , where N is the number of atoms, Žā is a fixed standard deviation of the Gaussian function, and fi is the i-th frequency of the molecule. We fixed the value of Žā to 5 cm-1 in this study.

CIMVF descriptor
For a simplified comparison of the molecular vibration patterns, the calculated molecular vibrations of a ligand were sorted in increasing order and taken into each corral with a fixed step (e.g., 5 cm-1) size. The intensities of each molecular vibrational frequency in the same corral were summed up as the representative of the corral. As a molecular descriptor of a ligand, the intensity of each corral is displayed in a 1-dimensional vector containing 800 elements from the vibrational frequency range of 0-4,000 cm-1. The calculations of CIMVF were performed by in-house scripts written in Python.
EVA and CIMVF descriptors were produced from PubChem SDF data of ligands through geometry optimization and calculations of molecular vibrations with the GAMESS program package [24]. The similarity matrices obtained from these five cases of molecular representations were subjected to hierarchical clustering using complete linkage method.
Calculation of molecular vibration
Since the EVA and CIMVF descriptors require geometry optimization of a given molecule, each provided theoretical 3-D conformer SDF underwent single low-energy conformation using the GAMESS program package [24]. Restricted Hartree-Fock calculations using the BLYP DFT method with the 6-31G basis set were performed to optimize the geometries of the molecules. Each result was taken as the representative conformation of the molecule, although the calculation of molecular vibrational frequency has some dependence on conformation. The results of geometry optimization were subjected to the calculation step for the molecular vibrational frequency with RUNTYP of HESSIAN in the GAMESS program.
Hierarchical clustering of molecular descriptors and dendrogram structure comparison
To test the availability of CIMVF as a molecular descriptor for the classification of AdoR ligands, a kind of molecular calculation using agglomerative hierarchical clustering was adopted in this work.
Each fingerprint or descriptor of ligands was gathered into a matrix of cognate fingerprint or descriptor. Finally, the similarity matrix, comprising descriptors of 46 ligands of AdoRs, was then subjected to hierarchical clustering in the agglomerative manner. In this study, each similarity matrix was finally clustered to make a dendrogram of 46 vertices. To compare the structures of the resulting dendrogram, we used a program for pairwise comparison of phylogenies, which shows the topological difference between two dendrograms [25]. The multiple comparison of the 5 dendrograms was also carried out using a meta-tree-generating program for comparing multiple alternative dendrograms [26].
Results and Discussion
As shown in Fig. 1, adenosine and caffeine, a typical agonist and antagonist of AdoRs, respectively, share the structure of purine. However, the Tanimoto coefficient between the two ligands is not high. The Tanimoto coefficient of some agonists to adenosine was lower than 0.3, though they did not take a large share. Moreover, the lowest Tanimoto coefficient of the agonists was 0.12766 (capadenoson) and is a lower value as an antagonist.
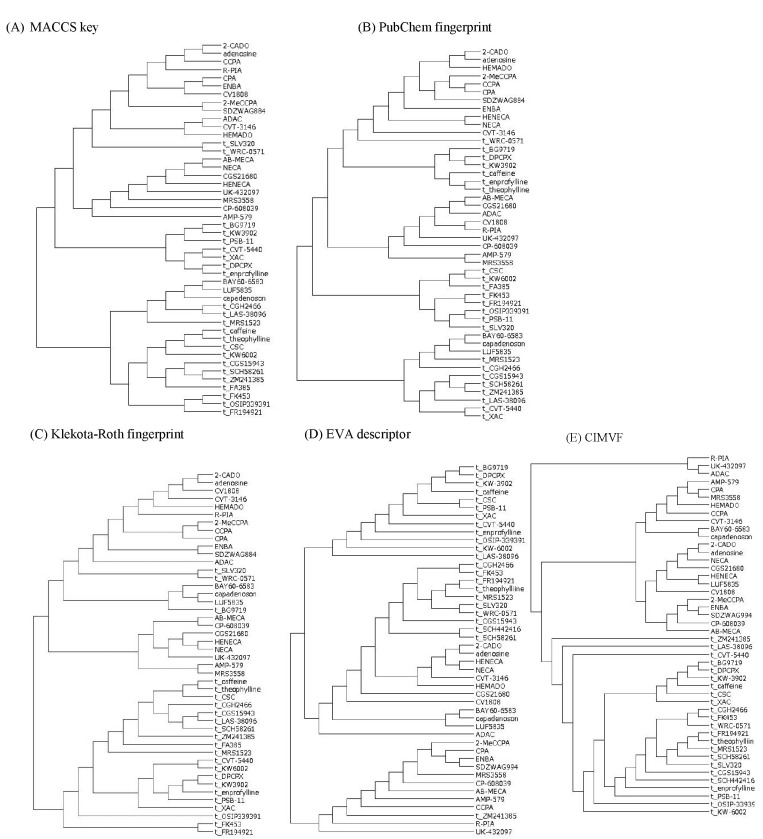
The results of hierarchical clustering of the similarity matrices from the MACCS keys, PubChem, and Klekota-Roth fingerprints; EVA; and CIMVF are shown in Fig. 2.
The dendrograms obtained from MACCS keys and PubChem fingerprint were shown to be similar to the Tanimoto coefficient pattern. The result of the Klekota-Roth fingerprint analysis showed a somewhat different pattern to the fingerprint-based one, as only two antagonists were located in the cluster of agonists. However, the three fingerprint-based results did not match the known facts of AdoR agonism.
In the case of EVA, Takane and Mitchell [27] reported a structure-odor relationship using the EVA descriptor and hierarchical clustering. The authors reported that the dendrograms that were produced by the EVA method outperformed those from UNITY 2D in a classification of odorant molecules. However, the EVA analysis in the current study was positive but not perfect for the molecular property-activity relationship in AdoR agonism. The larger Žā got, the more the clusters in the dendrogram got entangled (data not shown). It might come from the Gaussian function that smeared out the vibrational frequencies, such that vibrations of similar frequency overlapped together. The dendrogram obtained from the EVA descriptor showed an eligible tree for the agonism of AdoRs on the whole (Fig. 2D). One exception in which an antagonist (ZM241385) was clustered in a subtree of agonists might have resulted from smoothing by the Gaussian convolution of molecular vibration data.
All antagonists were clustered into a subtree in the dendrogram obtained from CIMVF analysis, as shown in Fig. 2E. We can tell the regional difference between agonists and antagonists in the dendrogram and also find that the information from the CIMVF analysis can play a role in the discrimination of agonists from antagonists in AdoR agonism. The discreteness of CIMVF data seems to facilitate the performance of the binary classification of AdoR ligands.
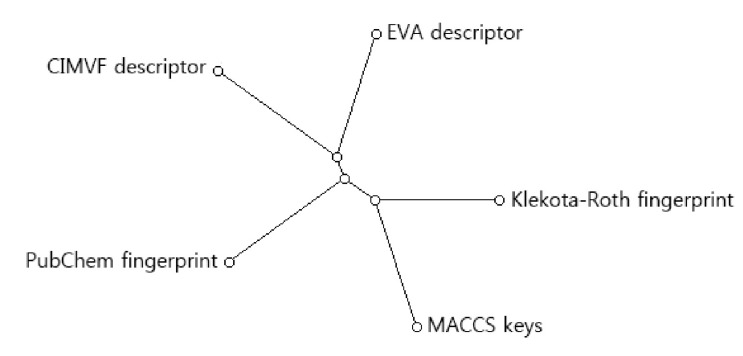
To find the topological difference between dendrograms, similarity scores between every two dendrograms were shown in Table 2. The similarity between two dendrograms was represented as a percentage. For example, the score of topological similarity between the two dendrograms of CIMVF and EVA analyses is 59.6%. The value has the highest similarity among all comparisons. A distance meta-tree build from five dendrograms of 46 AdoR ligands was illustrated in Fig. 3. As shown in the tree, the resulting dendrogram produced from the CIMVF data analysis has the nearest position to that produced from the EVA data analysis and is located the farthest from the dendrogram produced from the analysis of MACCS keys.
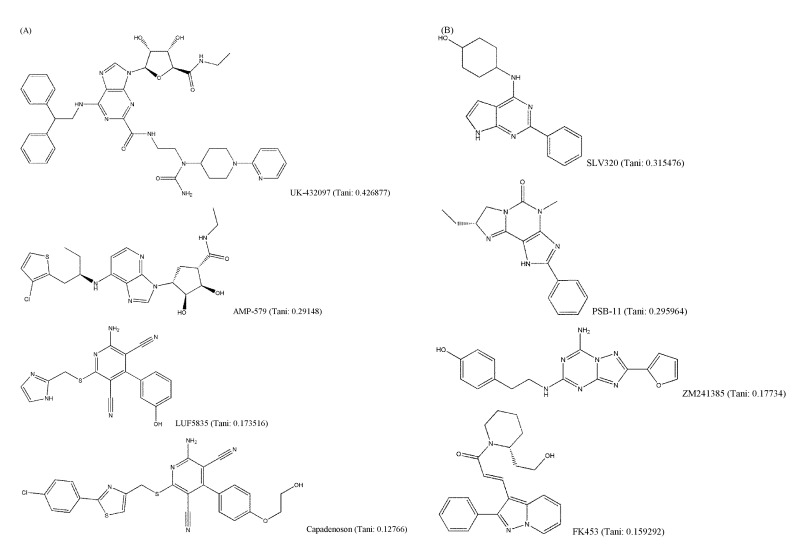
It is generally known that structurally similar molecules have similar properties or functions; however, a small change in molecular structure can fairly affect its vibrational frequencies. The structural variety of AdoR ligands was shown in Fig. 4. The Tanimoto coefficients of LUF5835, BAY60-6583, and capadenoson to adenosine were smaller than 0.18, and the ligands share a hydroxyphenyl pyridine dicarbonitrile backbone (Fig. 4A). They seem to be dissimilar to other agonists that share the structure of purine. Several antagonists (Fig. 4B) do not have a similar structure to caffeine; however, they act as antagonists of AdoRs.
As mentioned above, the current experiment does provide circumstantial evidence for the molecular vibrational information to AdoR agonism, at least. With a more concentrated study on the relationship between the molecular vibrational frequency and pharmacological function of a ligand, the vibrational spectrum of a ligand molecule may explicitly propose a novel path to the field of receptor-ligand interaction mechanisms.