STADIUM: Species-Specific tRNA Adaptive Index Compendium
Article information

Abstract
Due to the increasing interest in synonymous codons, several codon bias-related terms were introduced. As one measure of them, the tRNA adaptation index (tAI) was invented about a decade ago. The tAI is a measure of translational efficiency for a gene and is calculated based on the abundance of intracellular tRNA and the binding strength between a codon and a tRNA. The index has been widely used in various fields of molecular evolution, genetics, and pharmacology. Afterwards, an improved version of the index, named specific tRNA adaptation index (stAI), was developed by adapting tRNA copy numbers in species. Although a subsequently developed webserver (stAIcalc) provided tools that calculated stAI values, it was not available to access pre-calculated values. In addition to about 100 species in stAIcalc, we calculated stAI values for whole coding sequences in 148 species. To enable easy access to this index, we constructed a novel web database, named STADIUM (Species-specific tRNA adaptive index compendium). STADIUM provides not only the stAI value of each gene but also statistics based on pathway-based classification. The database is expected to help researchers who have interests in codon optimality and the role of synonymous codons. STADIUM is freely available at http://stadium.pmrc.re.kr.
Introduction
The central dogma of molecular biology can simply be summarized as follows: mRNA molecules are transcribed based on DNA sequences and translated into protein molecules. However, the detailed mechanisms and regulation are very complex in many aspects. One of the aspects is related to the redundancy of the genetic code. Due to the redundancy, an amino acid can be translated from multiple kinds of codons; so, a single-nucleotide variant/mutation may result in missense mutation but also a synonymous one, depending on its locus. Furthermore, the genomes of a variety of organisms do not use synonymous codons evenly, and the quantity of the bias is different in distinct organisms. Somehow, a synonymous variant is often considered to be silent, non-harmful, and less significant. However, the interest in issues of synonymous mutations is increasing in such fields as medical sciences, genetics, as well as molecular evolution [1–4], as it was revealed that they can affect protein levels, structures, and functions by changing mRNA structures [5] and creating alterations in splicing [6], spliceosomes [7], and miRNA sites [8].
Another important functional effect of a synonymous mutation is that it changes a tRNA, which is a counter-partner of a codon in mRNA, and the abundance of distinct tRNAs, even though transferring the same amino acid. This may affect the speed of translation [9] and protein folding [10]. Thus, from the level of each codon in the mRNA to whole organisms, a measure to reflect translational efficiency based on tRNA abundance should be required. For this purpose, a new metric, the tRNA adaptive index (tAI), was suggested by dos Reis et al. [11], which differs from previously used measures, such as the codon usage index and the codon adaptive index (CAI) [12], in that the tAI is calculated with intracellular tRNA abundance.
To calculate the tAI, parameters that represent the codon-anticodon’s wobble interactions are used to anticipate tRNA abundances, and the values were inferred by gene expression profiles in budding yeast (Saccharomyces cerevisiae) in the first version of tAI [12]. However, because the efficiency of the wobble interaction was expected to be different with respect to different species [13], the weights were not adequate for non-yeast organisms. Despite the need for species-specific weights, the tAI was widely used in various kinds of research [14–16] for a while, because the calculation of species-specific values needed gene expression profiles of whole transcriptomes.
To overcome this limitation, Sabi and Tuller (2014) [13] invented a new metric, the species-specific tAI (stAI), using the tRNA copy number of each species, the rationale for which was based on the fact that a higher level of gene expression is related to higher codon usage and adaptation to intracellular tRNAs. As expected, stAI showed better performance than tAI in the prediction of protein abundances in non-fungal organisms [13]. After the metric was introduced, a web server (stAIcalc), including an online tool that calculates the stAI of query sequences of a selected organism and downloadable stand-alone software, was published [17]. However, the server does not provide pre-calculated stAI values. For greater convenience, we here introduce our web database, Species-specific tRNA adaptive index compendium (http://stadium.pmrc.re.kr), which provides stAI values of 148 genomes.
Methods
We used two sets of species (148 in total); 96 species in set A were chosen from stAIcalc [17], and 55 species in set B were chosen from Ensembl [18]. Three species (S. cerevisiae, Caenorhabditis elegans, and Drosophila melanogaster) were included in both sets. Protein-coding sequences (CDS) for set A and set B were retrieved from NCBI GenBank [19] and Ensembl, respectively. Weight values for each tRNA of set A and set B were obtained from stAIcalc and the genomic tRNA database (GtRNAdb) [20]. According to NCBI taxonomy [21], overall, 148 species were classified into five kingdoms.
The values of stAI for the two sets were calculated in different ways. For each species in set A, species-specific relative adaptiveness values (wi) of 61 codons were obtained by the value provided by stAIcalc; then, the stAI of a gene (g) was calculated by obtaining the geometric mean of relative adaptiveness values of codons in the gene as follows:
where ikg is the codon defined by the kth triplet in gene g and lg is the length of the gene in codons (except the stop codons). For set B, the values were calculated by stand-alone software provided by stAIcalc with inputs of CDS and tRNA copy numbers obtained from GtRNAdb.
Results and Discussion
We used two sets of organisms, A and B. Set A was basically retrieved from stAIcalc. The server does not provide the stAI of genes, but the pre-calculated relative adaptiveness of a codon (w) is accessible. Out of data on 97 species in the server, 96 species were used, except one species whose CDS information was not accessible in NCBI. In addition to set A, we retrieved sequence information of model organisms provided by Ensembl. Among them, we used 55 species, the tRNA copy numbers of which are available in GtRNAdb. In total, the stAI values of genes in 148 species were calculated. The number of species in Fungi and Viridiplantae was relatively small, and most species were classified into Archaea, Bacteria, and Metazoa (Fig. 1).
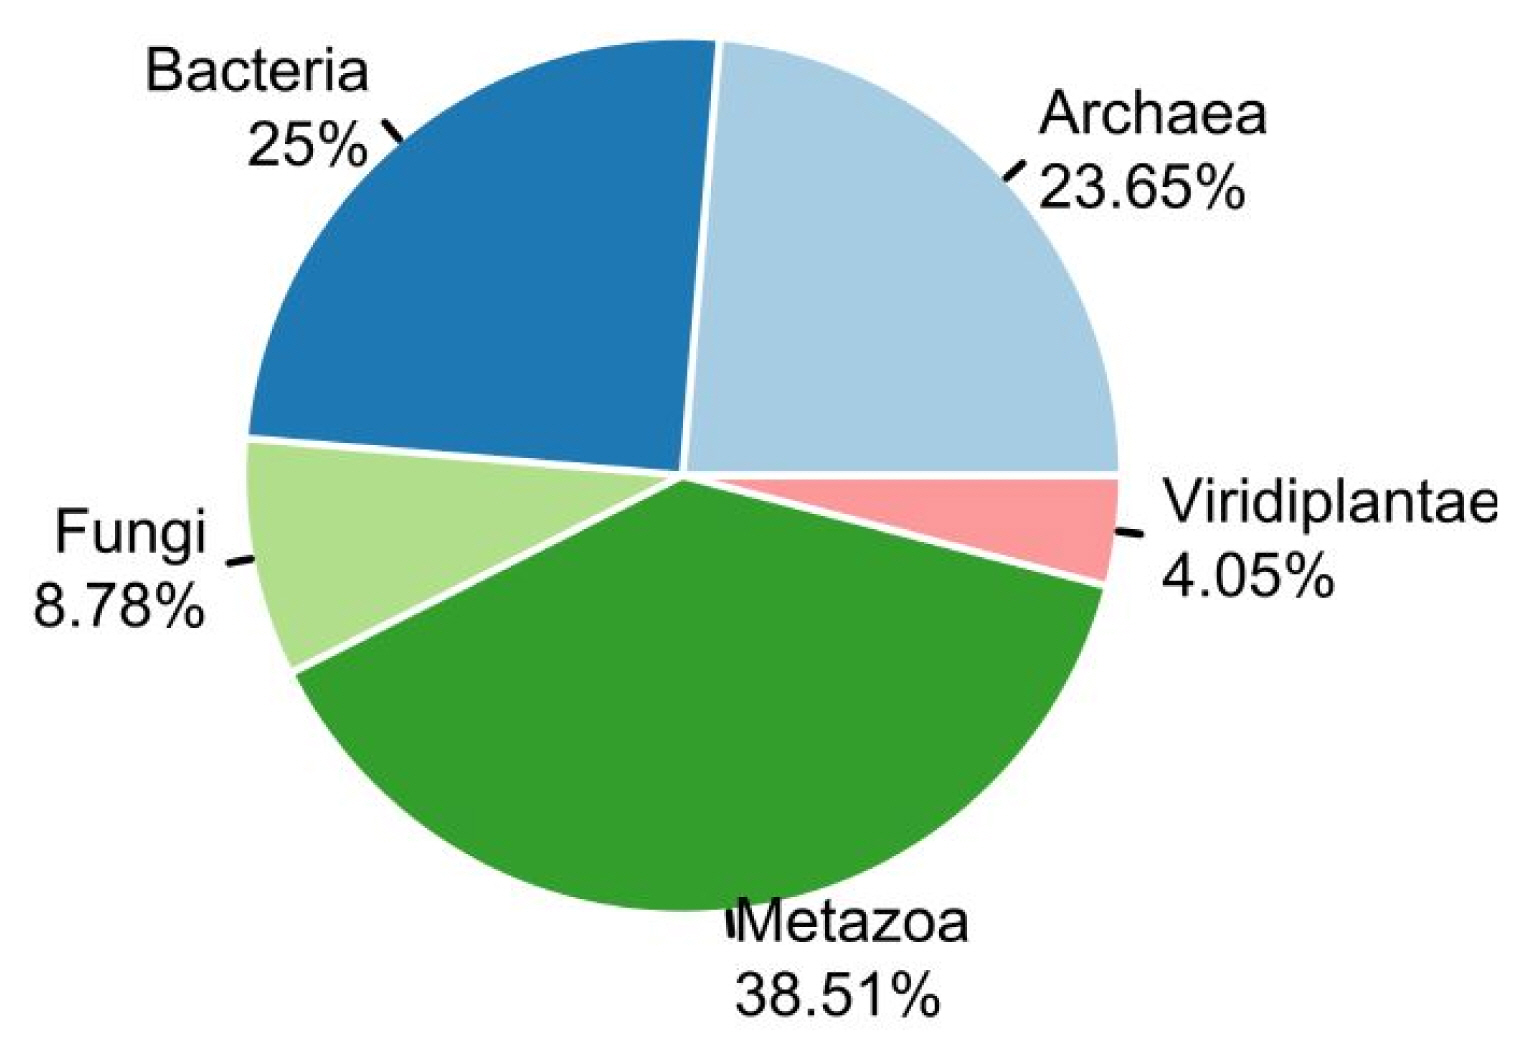
Organisms provided in STADIUM. In total, specific tRNA adaptation index values of 148 species were calculated and provided: Archaea (n = 35), Bacteria (n = 37), Fungi (n = 13), Metazoa (n = 57), and Viridiplantae (n = 6).
Three species (S. cerevisiae, C. elegans, and D. melanogaster) included in both sets were used to compare the stAI values (Fig. 2A–C). The results showed somehow high but not perfect correlations (R = 0.89, 0.86, 0.72 for S. cerevisiae, C. elegans, and D. melanogaster, respectively). It is because species-specific relative adaptiveness values were obtained differently. Values for set A were obtained from precalculated values in stAIcalc; those for set B were calculated based on coding sequences retrieved from a recent version of Ensembl. Indeed, differences between set A and set B were observed for some codons (Fig. 2D–F). Sabi et al. (2017) [17] stated that the values provided by stAIcalc were calculated based on the NCBI genome. Thus, the differences may be caused by the difference between coding sequences that were stored in the NCBI genome at the time when stAIcalc was constructed. Distributions of stAIs were compared with respect to species (Fig. 3). We could not observe any rules, such as organisms in certain kingdom have higher stAIs or multicellular higher organisms have lower stAIs. Similarly, previous studies have failed to find rules on the evolution of codon usage [22, 23].

Comparison of specific tRNA adaptation index (stAI) values of genes and weights of codons calculated in sets A and B. (A–C) stAI values in Saccharomyces cerevisiae, Caenorhabditis elegans, and Drosophila melanogaster, respectively. (D–F) Weights of codons in the corresponding species.
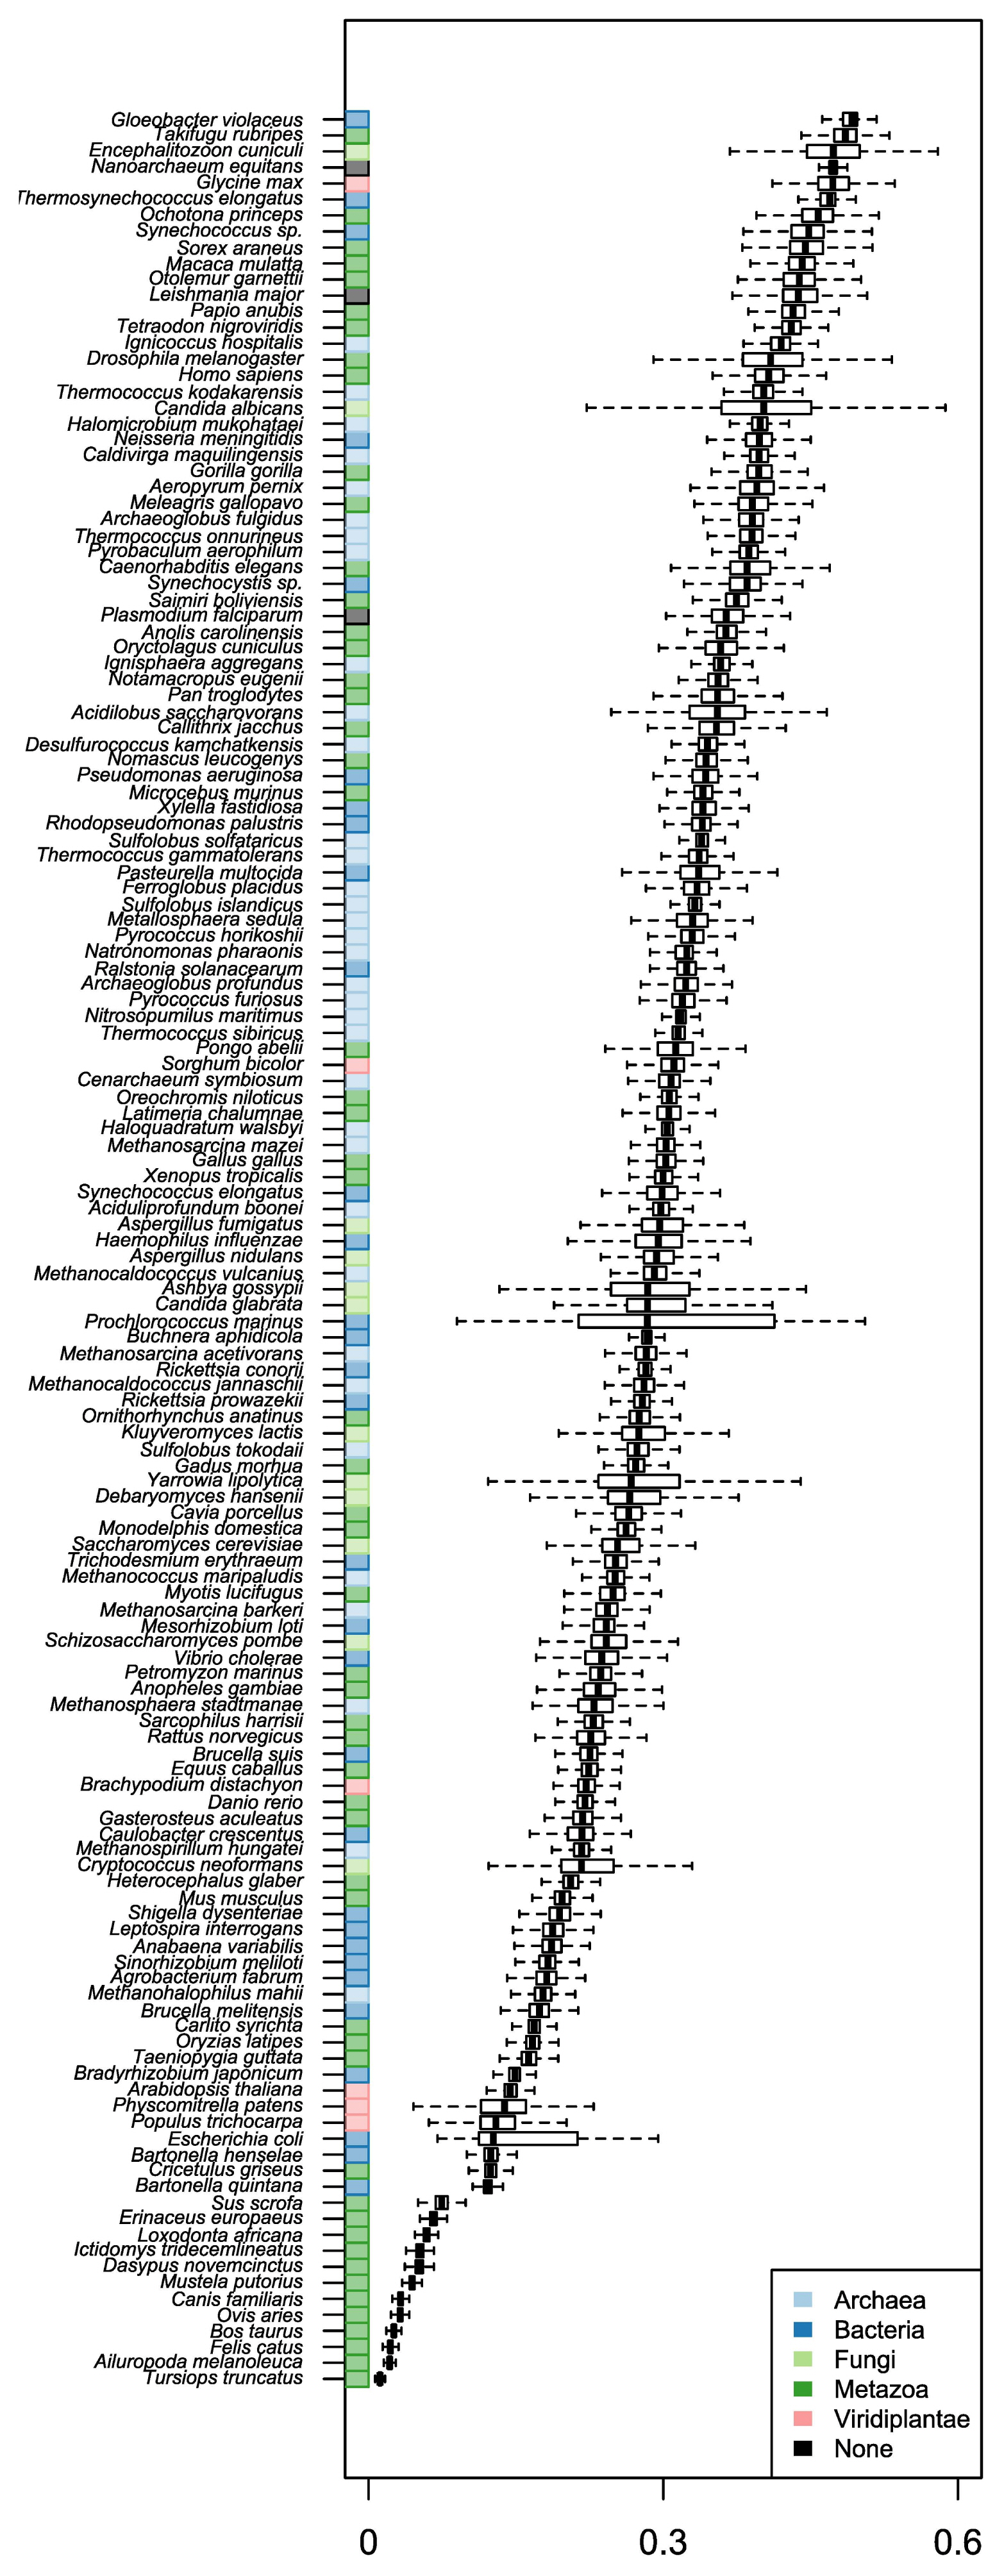
Distributions of specific tRNA adaptation index values with respect to species.
We compared stAI values with respect to the pathway-based gene classification defined in Kyoto Encyclopedia of Genes and Genomes (KEGG) for each species. In most species, including the 3 model organisms in Fig. 4, the genes involved in ‘ribosome’ had the highest stAI values. This seems to be caused by the fact that ribosomal proteins are pivotal house-keeping genes; so, their expressions are highly maintained. Likewise, we expect subsequent studies of pathway-based comparisons of stAI values to help find rules that govern what kinds of biological processes need more tRNA adaptation and how they are to be regulated.
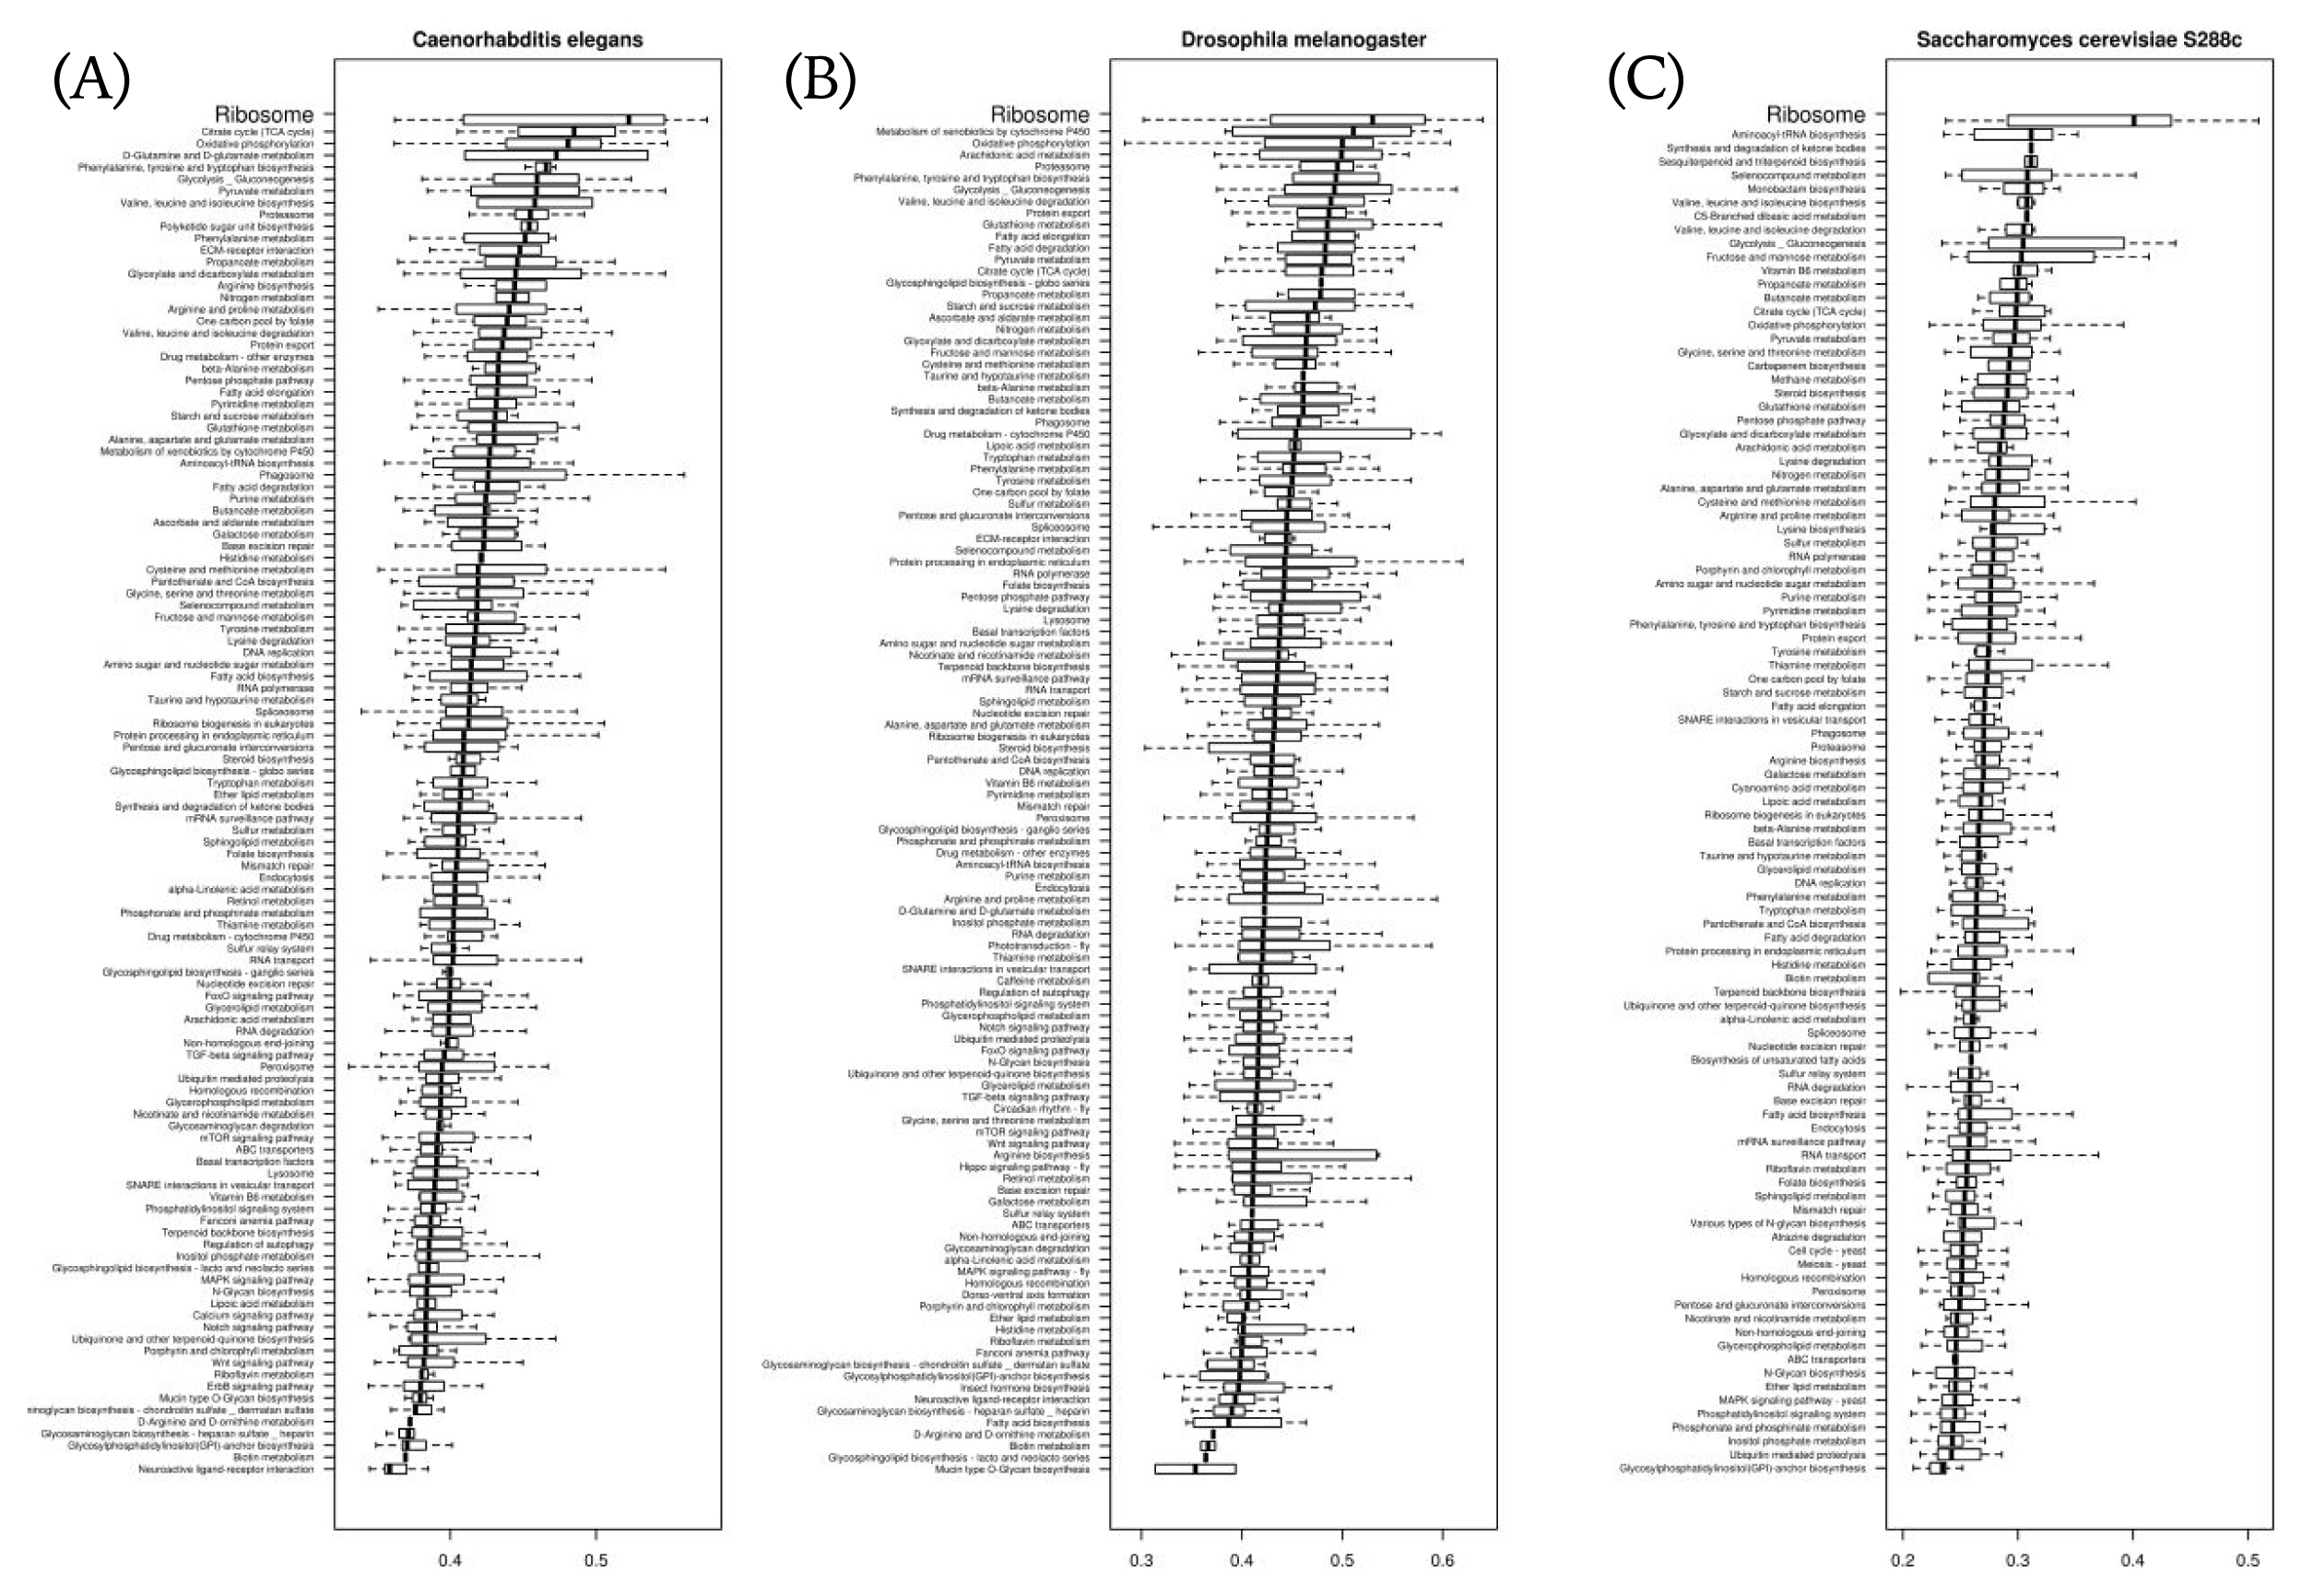
Distributions of specific tRNA adaptation index values with respect to pathway-based gene classification defined in Kyoto Encyclopedia of Genes and Genomes in Saccharomyces cerevisiae (A), in Caenorhabditis elegans (B), and in Drosophila melanogaster (C).
Web server implementation
We constructed a web server, named STADIUM (Species-specific tRNA adaptive index compendium; http://stadium.pmrc.re.kr). The codes for STADIUM were written in the R programming language (version 3.4.4) with the package ‘shiny,’ which is a web application framework. Fig. 5A shows screenshots of STADIUM. It consists of several tabs. In the web interface, users can browse the stAI values of genes by selecting species (Fig. 5B). On the same page, relative adaptiveness values of 61 codons and stAI values categorized by KEGG pathway are available. In the ‘Browse by pathway’ tab, users can select a pathway; then, summarized statistics of stAI values in each species and a boxplot are provided (Fig. 5C). Also, the raw data calculated in this work can be downloaded in the ‘Download’ tab (Fig. 5D).

Screenshots of STADIUM. (A) Main page of STADIUM. STADIUM consists of several tabs. (B) Example results in ‘Browse by species’ tab. (C) Example results in ‘Browse by pathway’ tab. (D) Screenshot of ‘Download’ tab.
Acknowledgments
This work was supported by the National Research Foundation of Korea (NRF), funded by the Ministry of Science and ICT (NRF-2017M3A9B6061511 and NRF-2017 M3C9A6047615) and KREONET (Korea Research Environment Open NETwork), which is managed and operated by KISTI (Korea Institute of Science and Technology Information).
Notes
Authors’ contribution: Conceptualization: ML, YJC
Funding acquisition: ML, YJC
Data analysis: JY
Web server implementation: ML
Writing – original draft: JY, ML
Writing – editing: YJC
Conflict of interest
No potential conflicts of interest relevant to this article was reported.