Comparison of the Genetic Alterations between Primary Colorectal Cancers and Their Corresponding Patient-Derived Xenograft Tissues
Article information
Abstract
Patient-derived xenograft (PDX) models are useful tools for tumor biology research and testing the efficacy of candidate anticancer drugs targeting the druggable mutations identified in tumor tissue. However, it is still unknown how much of the genetic alterations identified in primary tumors are consistently detected in tumor tissues in the PDX model. In this study, we analyzed the genetic alterations of three primary colorectal cancers (CRCs) and matched xenograft tissues in PDX models using a next-generation sequencing cancer panel. Of the 17 somatic mutations identified from the three CRCs, 14 (82.4%) were consistently identified in both primary and xenograft tumors. The other three mutations identified in the primary tumor were not detected in the xenograft tumor tissue. There was no newly identified mutation in the xenograft tumor tissues. In addition to the somatic mutations, the copy number alteration profiles were also largely consistent between the primary tumor and xenograft tissue. All of these data suggest that the PDX tumor model preserves the majority of the key mutations detected in the primary tumor site. This study provides evidence that the PDX model is useful for testing targeted therapies in the clinical field and research on precision medicine.
Introduction
The recent advent of next-generation sequencing (NGS) technologies has accelerated the realization of precision medicine, especially for cancer treatment [1]. With NGS tools, the mutation-based determination of an actionable drug is possible, and side effects of a drug can be minimized [2, 3]. Another technical revolution for precision medicine is the development of the patient-derived xenograft (PDX) model. The basic principle of the PDX model is to engraft human tumor tissues or cells onto immuno-deficient mice and expand the tumor tissues in the immuno-deficient mouse to test the efficacy of candidate anti-cancer drugs [4, 5]. Once a druggable mutation is identified by NGS, the PDX model that has been established from the same patient can provide an efficient way to validate the candidate target therapy. Even though an in vitro culture of the primary tumor cell can also be applicable for drug efficacy screening, the PDX mouse model has advantages compared with in vitro tissue cultures. For example, under artificial in vitro culture conditions, cancer cells may acquire further genomic alterations and phenotypic changes to survive, whereas PDX models appear to have greater similarity to primary tumors [6, 7]. Indeed, according to Gu et al. [8], PDX-based mouse trials have shown similar results as cancer patient-based clinical trials.
According to Fichtner et al. [9], most of the key genetic alterations identified in primary tumors were consistently detected in the PDX models, and the PDX models had similar outcomes as chemotherapy. However, it is still unknown how many of the genetic alterations identified in primary tumors are consistently detected in tumor tissues in the PDX model that has been established from the same patient. Especially, the consistency of key genetic alterations between primary tumors and the PDX model is very important to test the efficacy of candidate anti-cancer drugs that have been designed, based on the mutation profiles in the primary tumor.
To address this issue, we analyzed the mutations of three primary colorectal cancers (CRCs) and matched xenograft tissues in PDX models by NGS-based cancer panel analysis. Then, we compared the mutational status between the primary tumors and PDX models.
Methods
Primary and matched PDX tumor samples
CRC tissues and matched normal samples were collected from three CRC patients at Seoul St. Mary’s Hospital (Seoul, Korea) with the approval of the institutional review board. Corresponding PDX tissues of the xenograft mouse models from the same cases were obtained with the approval of the Institutional Animal Care and Use Committee (IACUC) of Catholic University of Korea (Seoul, Korea). General information on the three CRC cases (normal, primary tumor, and PDX tissue sets) is available in Supplementary Table 1. Primary tumor samples were cut and stained with hematoxylin and eosin (H&E). The H&E-stained slides were reviewed by a pathologist to mark tumor cell-rich areas and used as a guide for the microdissections. DNA was extracted from the microdissected tissue and matched blood using the DNeasy Blood and Tissue Kit (Qiagen, Hilden, Germany). The DNA was quantified with the Qubit dsDNA HS assay kit on a Qubit fluorometer (Thermo Fisher Scientific, Waltham, MA, USA).
Library preparation and Ion S5 sequencing
We used a custom NGS panel, OncoChase-AS01 (ConnectaGen, Seoul, Korea), targeting 95 cancer-related genes (Supplementary Fig. 1) [10]. Ten nanograms of DNA was amplified, digested, and barcoded using the Ion Ampliseq Library kit 2.0 (Thermo Fisher Scientific) and Ion Xpress barcode adapter kit (Thermo Fisher Scientific) according to the manufacturer’s instructions. The amplified libraries were quantified using a Qubit fluorometer, the Qubit dsDNA HS assay kit, and the Ion Library TaqMan Quantitation kit (Thermo Fisher Scientific). The libraries were then templated on an Ion Chef System (Thermo Fisher Scientific) using Ion 520 and Ion 530 Chef Reagents (Thermo Fisher Scientific) according to the manufacturer’s instructions. The prepared libraries were sequenced on an Ion S5 Sequencer using an Ion 530 chip and Ion S5 Sequencing Reagents (Thermo Fisher Scientific).
Data analysis
Using the Ion Torrent Suite v5.2.2 (Thermo Fisher Scientific) for Ion S5, we analyzed raw data and performed alignment of the sequencing reads to the reference genome (Human Genome build 19). The coverage analysis was performed using the Ion Torrent Coverage analysis plug-in software v5.2.1.2, and variants were detected using the Variant Caller plug-in v5.2.2.41 with low-stringency settings. We also used ANNOVAR, which is a tool that annotates called variants, querying a knowledge database with various clinical information. We used in-out pipelines to filter mouse contamination, with reference to a database of SNPs and another study [11]. The variant calls were examined manually with the Integrative Genomics Viewer (IGV) from the Broad Institute [12, 13], and we identified somatic mutations using the COSMIC database and The Cancer Genome Atlas (TCGA) database. The mutations were filtered with matched normal data to reduce false positives. To define copy number alterations (CNAs), we used NEXUS software 9.0 (Biodiscovery, El Segundo, CA, USA) [1, 14].
Sanger sequencing
We conducted PCR amplification and Sanger sequencing to validate single-nucleotide variants and deletions. We selected exon 15 of CDH1, exon 12 of ERBB2, and exon 8 of ESR1. The primers that were used for the Sanger validation are available in Supplementary Table 2.
Results
Histological features of primary and PDX tumors
All of the PDX tumors used in this study were passage-three tissues. The three primary tumors showed adenocarcinomas of the colon, and the histological features of the tumor tissues of the PDX models from the same CRC patients were identical (Fig. 1). The tumor cell purity of the primary tumor tissues and xenograft tumor tissues was comparable, but the xenografts showed slightly higher purity than primary CRCs (all >60%).
Targeted deep sequencing
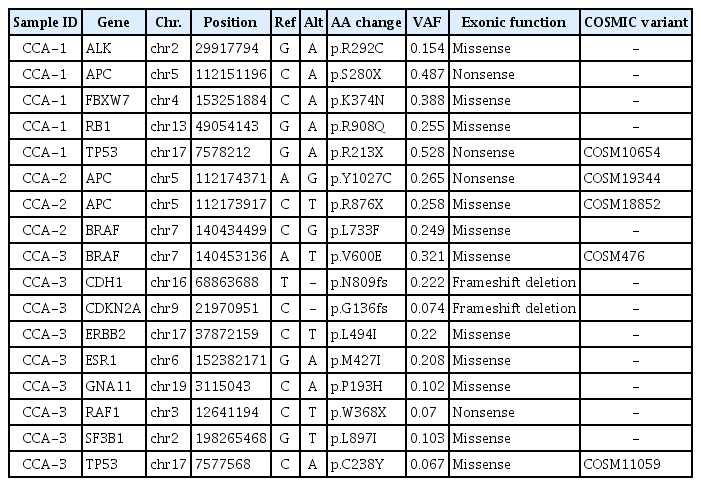
We performed targeted NGS, covering 95 cancer-related genes, for specimens of the three primary CRCs and corresponding PDX tumors. DNA from the blood of the three patients was also sequenced to determine the somatic alterations. The average coverage of the sequencing depth was 958× (range, 834.4 to 1017×) (Supplementary Table 3). Through the filtering steps, we identified 17 non-silent somatic mutations across 13 cancer-related genes (ALK, APC, BRAF, CDH1, CDKN2A, ERBB2, ESR1, FBXW7, GNA11, RAF1, RB1, SF3B1, and TP53) (Table 1). Among them, three mutations (APC, TP53, and FBXW7) overlapped with the TCGA projects and the top 20 colon and rectal adenocarcinoma genes in the COSMIC database (http://cancer.sanger.ac.uk/cosmic).
Comparison of genetic alteration profiles between primary and PDX tumors
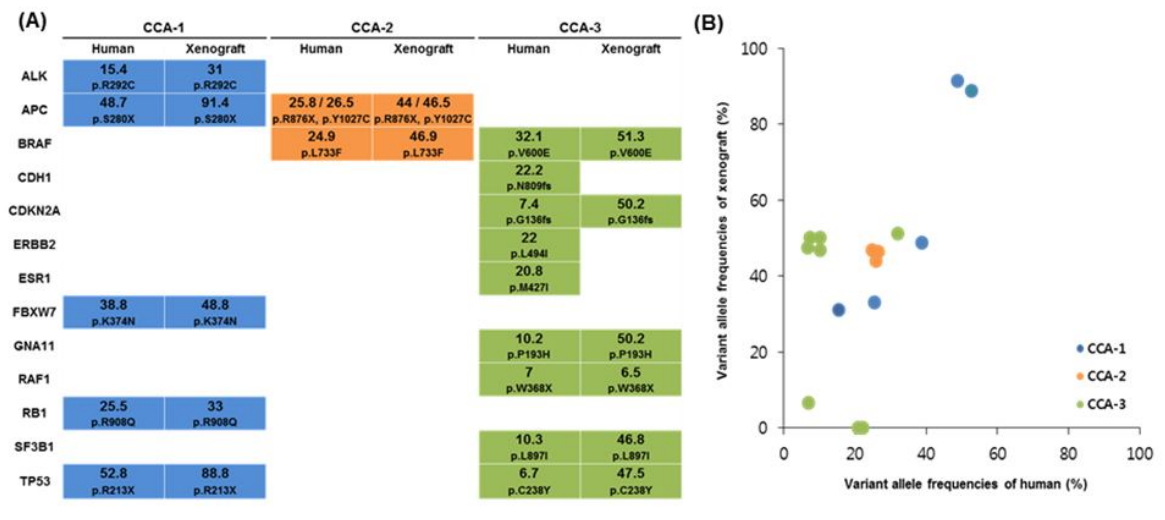
Next, we examined how consistent the somatic mutations identified in the primary CRC tissues and corresponding tumor tissues from the PDX mouse models were. Of the 17 somatic mutations, 14 were consistently identified in both primary and xenograft tumors (Fig. 2A). However, 3 mutations that were identified in the primary tumor were not detected in the xenograft tumor tissue (Fig. 2A). Overall, variant allele frequencies (VAFs) in the xenografts were higher than in the primary CRCs (Fig. 2B). There was no newly identified mutation in the xenograft tumor tissues. In the CCA-1 case, five mutations (ALK, APC, FBWX7, RB1, and TP53) that were identified in the primary tumor were consistently detected in the xenograft tumor. The average VAF in the primary tumor and xenograft was 36.2% ± 15.7% and 58.6% ± 29.6%, respectively. In the CCA-2 case, two mutations (APC and BRAF) in the primary tumor were consistently detected in the xenograft tumor. In this case, two independent mutations were detected in the APC gene (Table 1), and both of them were consistently detected in the primary and xenograft tumors. The average VAF (%) in the primary tumor and xenograft was 25.7% ± 0.8% and 45.8% ± 1.6%, respectively. In the CCA-3 case, nine mutations were identified in the primary tumor, and six of them (BRAF, CDKN2A, GNA11, RAF1, SF3B1, and TP53) were consistently detected in the corresponding xenograft tissue; however, the other three mutations (CDH1, ERBB2, and ESR1) were not detected in the xenograft. The read depths in the three genes in the PDX tissue were 1,694×, 519×, and 613×, respectively, which is similar to the average read depth. This result suggests that the inconsistency of the three mutations between primary tumors and PDX models night not be due to the relatively shallow read. To further verify whether the inconsistent result was a real difference or due to technical errors, we performed Sanger sequencing for the three genes and confirmed that the mutations of the three genes existed only in the primary tumor (Supplementary Fig. 2).

Somatic mutations identified from the three primary colorectal cancers and corresponding patient-derived xenograft tumors. (A) Comparison of somatic mutations between patient’s primary tumor (human) and xenograft tumor (xenograft). Variant allele frequencies (%) and amino acid changes are indicated in each colored box. CCA-1 (blue), CCA-2 (orange), and CCA-3 (green). (B) Respective variant allele frequencies (%) between primary (human) and xenograft tumors.
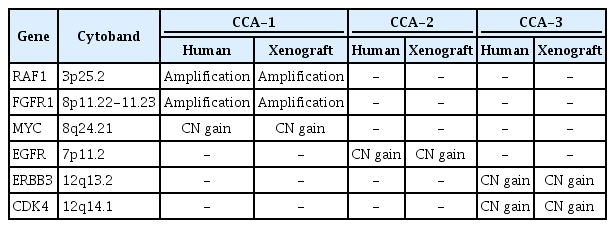
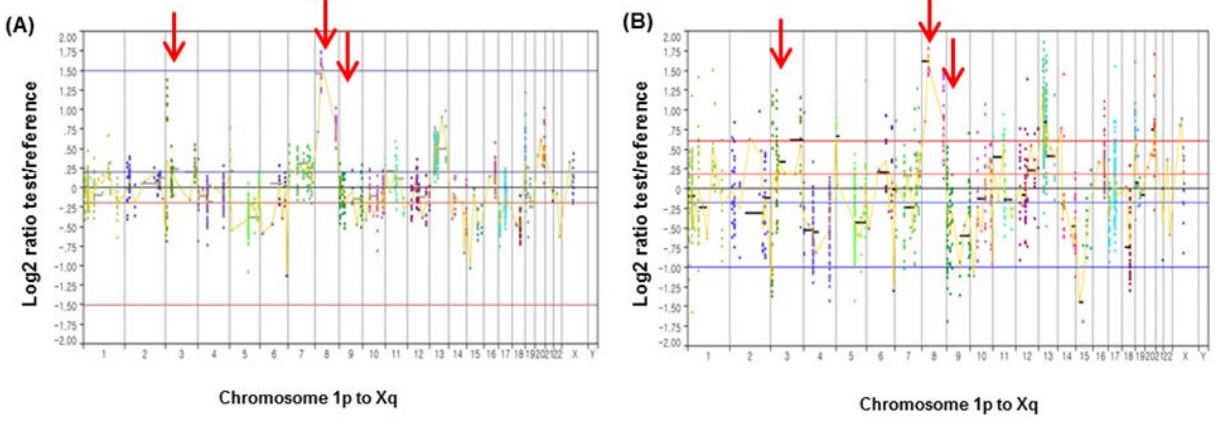
We also examined how consistent the CNAs that were identified in the primary CRC tissues and the corresponding tumor tissues from the PDX mouse models were. The CNA profiles in the primary tumors were largely consistent with those in the xenograft tumors (Table 2). Fig. 3 illustrates an example of CNA profiles that were identified in primary and xenograft tumors (CCA-1), harboring amplifications of RAF1 (chromosome 3p), FGFR1 (chromosome 8p), and MYC (chromosome 8q). The CNA profiles of the other two CRCs are available in Supplementary Fig. 3.
Discussion
In principle, xenografts of human tumor tissue onto mice would be an ideal tool for testing the response in vivo to anticancer drugs for individual patients, because PDX models preserve the main characteristics of the original tumor, such as mutation profile and morphology [15]. However, it is unclear whether the characteristics of the mutations in the primary tumor are well preserved in the mouse xenograft or not. In this study, we aimed to check whether the genetic alterations that are identified in primary tumors are consistent with the corresponding PDX xenograft tumors using CRC PDX models. For this, we compared the genetic alteration profiles for three pairs of primary CRCs and their corresponding PDX tumors. To rule out the passage effect of mutation profiles in the PDX model, we used passage-three samples for all three CRCs. Through this analysis, we observed that most of the key somatic mutations (14/17) were preserved in the xenograft. In terms of the consistency of the somatic mutations, two of the three CRC cases showed perfectly consistent mutation profiles between the primary tumor and xenograft, and the other case showed a partly consistent profile. Overall, 14 of the 17 (82.4%) somatic mutations that were identified in the three CRCs were consistent between the primary tumor and xenograft. This result is largely consistent with previous observations in diverse cancers [16, 17]. In addition to the somatic mutations, the CNA profiles were also largely consistent between the primary tumor and xenograft. All of these data suggest that the PDX tumor model preserves the majority of key mutations that are detected in the primary tumor site. This study provides evidence that the PDX model is useful for testing target therapies in the clinical field and research on precision medicine.
There are several limitations in this study. First, the number of cases might not have been enough to conclude the consistency of key genetic mutations between the primary tumor and xenograft objectively. Second, due to the limited sample size, some of the common driver mutations for CRCs, such as RAS mutation, were unable to be compared. Third, the cancer panel was not suitable to analyze the CNAs properly. Therefore, although the CNA profiles were largely consistent between the primary tumor and xenograft, these data are not objective and solid evidence to support the consistency of the CNA profiles.
In conclusion, we performed targeted sequencing using a custom panel in both a primary tumor and PDX tumor for colorectal cancer. We identified that the PDX models had consistent genetic characteristics, including key driver genes that were identified in the primary tumors. Our data are useful evidence to support the application of PDX models for precision medicine research and future clinical applications.
Notes
Authors’ contributions
Conceptualization: YJC
Data curation: SMY, SHJ
Formal analysis: SMY, SHJ
Funding acquisition: YJC
Methodology: SMY, SHJ
Writing – original draft: SMY, SHJ
Writing – review & editing: YJC
Acknowledgements
This work was supported by a grant from the National Research Foundation of Korea (NRF-2017M3C9A6047615 and 2017R1E1A1A01074913).
Supplementary Materials
Patient clinical information for primary colorectal cancers
Primer pairs used in Sanger sequencing
Statistics of sequencing data
Custom cancer panel (OncoChase-AS) gene list. The 95 cancer related genes in the OncoChase-AS panel. CNA, copy number alteration.
Sanger sequencing results in CCA-3 primary tumor and corresponding xenograft tumor. Primary tumor and xenograft tumor conducted Sanger sequencing for ERBB2 (c.C1480A), CDH1 (c.879delT) and ESR1 (c.G128A) mutations. Primary tumors harbored somatic mutations (A, C, E), whereas xenograft tumors were showed wildtype (B, D, F).
Copy number alterations between primary tumor and PDX tumor in CCA-2 and CCA-3. CCA-2 primary tumor (A) and CCA-2 PDX tumor (B) exhibited EGFR copy number gain at chromosome 7p. CCA-3 primary tumor (C) and CCA-3 PDX tumor (D) harbored ERBB3, CDK4 copy number gain at chromosome 12q.


