Gene Set Analyses of Genome-Wide Association Studies on 49 Quantitative Traits Measured in a Single Genetic Epidemiology Dataset
Article information
Abstract
Gene set analysis is a powerful tool for interpreting a genome-wide association study result and is gaining popularity these days. Comparison of the gene sets obtained for a variety of traits measured from a single genetic epidemiology dataset may give insights into the biological mechanisms underlying these traits. Based on the previously published single nucleotide polymorphism (SNP) genotype data on 8,842 individuals enrolled in the Korea Association Resource project, we performed a series of systematic genome-wide association analyses for 49 quantitative traits of basic epidemiological, anthropometric, or blood chemistry parameters. Each analysis result was subjected to subsequent gene set analyses based on Gene Ontology (GO) terms using gene set analysis software, GSA-SNP, identifying a set of GO terms significantly associated to each trait (pcorr < 0.05). Pairwise comparison of the traits in terms of the semantic similarity in their GO sets revealed surprising cases where phenotypically uncorrelated traits showed high similarity in terms of biological pathways. For example, the pH level was related to 7 other traits that showed low phenotypic correlations with it. A literature survey implies that these traits may be regulated partly by common pathways that involve neuronal or nerve systems.
Introduction
Genome-wide association (GWA) studies are now well established for discovering hypothesis-free genetic loci whose variations are associated with a phenotype [1-4]. Downstream analysis of the study result in terms of gene sets is gaining popularity these days, as it facilitates biological interpretation of a GWA result [5].
The Korea Association Resource (KARE) project has collected epidemiological and genotype data from the regional cohorts in Ansung and Ansan, Korea [6]. A number of GWA studies based on this KARE data have been published so far [6-8]. We pursued re-analyses of these studies in terms of gene sets in a systematic way to warrant cross-comparisons of the traits. We mimicked the analysis conditions of the original published GWA works as much as possible, based on the de facto standard program PLINK [9]. For the gene set analysis, we used GSA-SNP software [10], an efficient Java-based application that accepts a list of single nucleotide polymorphisms (SNPs) and their association p-values and outputs the gene set p-values after multiple testing correction.
We applied this procedure to 49 baseline quantitative traits that were of epidemiological, anthropometric, or blood chemistry parameters. As expected, those traits that are known to share common biological mechanisms and to overlap in their population incidences indeed showed similar profiles of the significantly associated gene sets. To our surprise, some of the traits that were phenotypically uncorrelated in our study population and were seemingly unrelated to each other showed similar profiles of the significantly associated gene sets. Our results may demonstrate a useful strategy of discovering pleiotropy, which refers to a phenomenon of common pathways involved in distinct phenotypes.
Methods
Phenotype and genotype data
Details of the KARE study design have been reported [6]. Briefly, the genotype data were measured for a total of 10,038 residents in both Ansung and Ansan provinces, Korea, using Affymetrix Genome-wide Human SNP Array 5.0 chips (Affymetrix Inc., Santa Clara, CA, USA). After quality control, 352k SNP genotypes for 8,842 samples were used in the subsequent GWA analyses. The epidemiological trait data for these individuals were also received from the KARE project. Among a total of 49 quantitative traits, we took a logarithm of 5 trait values to balance the distribution.
GWA analyses
We used the imputed genotype data that comprised 1.8 million SNP markers [6]. GWA analyses of these 49 quantitative traits were performed by linear regression under the additive genetic model, as implemented in PLINK.
Gene set analyses
We performed GSA using the Gene Ontology (GO) databases, where only gene sets having 10-200 members (2,476 biological process GO terms) were used. We applied the Z-statistic method, as implemented in GSA-SNP [10], with the default options. Briefly, those SNPs residing inside or within 20 kb of the boundary of each gene were compiled, and the second best p-value was assigned to the gene. See Kwon et al. [11] for the rationale of using the second best p-value instead of the best p-value. The gene score was defined as the -log of the p-value assigned to the gene. The Z-statistic was then calculated for each gene set [10]. The p-values for each gene set were computed under the assumption of a normal distribution of the Z-statistic, followed by multiple testing correction using the false discovery rate method. When the member genes of a gene set overlapped in their genomic loci or were located in tandem within a short block of strong linkage disequilibrium, the p-values assigned to them might have been highly correlated. In such cases, only one of them was included to calculate the gene set score.
Semantic similarity between GO terms
The R package GOSemSim was developed to compute semantic similarity among GO terms, sets of GO terms, gene products, and gene clusters. This package contains functions to estimate the semantic similarity of GO terms based on Resnik's, Lin's, Jiang and Conrath's, Rel's, and Wang's methods. Here, we used Wang's method for our analysis. This method determines the semantic similarity of two GO terms based on both the locations of these terms in the GO graph and their relationships with their ancestor terms [12]. The similarity index between the two GO terms was between 0 (the least similar) and 1 (identical). The similarity between two sets of GO terms was calculated as follows. First, the highest value against all members of the other set was calculated for a given GO term in one of the sets. Then, all of these values were collected and averaged to provide the similarity between the two sets. The significance of the similarity index was inferred, based on the distribution of the indices from 106 random samplings.
Results and Discussion
Parallel and systematic GWA studies of a number of traits using a single genetic epidemiology dataset give a unique opportunity to explore common biological pathways regulating multiple traits that do not display phenotypic correlations. In this report, we focused on the 49 baseline quantitative trait data that were demographic, anthropometric, or blood chemistry parameters.
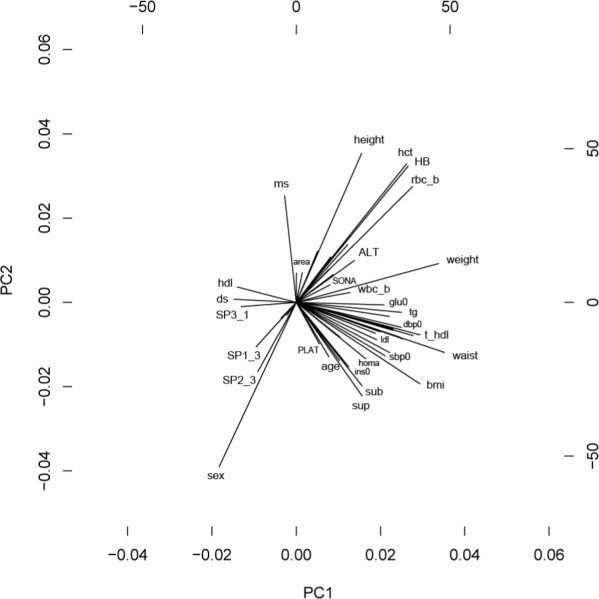
We surveyed the literature for the published GWA studies, based on the KARE data, and extracted the information on the analysis conditions, such as exclusion of samples and covariates of association regression. For the GWA analyses of all 49 traits, we included area, age, and sex as covariates, and for some of the traits, additional covariates were added, based on the literature information (Table 1). The phenotypic relations were also learned from principal component analysis (PCA). For example, the directions pointed by waist and body mass index (BMI) were similar in the PCA plot (Fig. 1); using BMI as one of the covariates for the analysis of waist. On the contrary, we used a literature guide for the analysis of BMI [13]. GWA analyses for all 49 traits were performed using linear regression, as implemented in PLINK, and the resulting SNP p-values were fed into GSA-SNP for gene set analysis.
For each of the 49 traits, we identified biological process GO terms that showed p < 0.05 after multiple testing correction (the lists are available upon request). As GO terms are hierarchically arranged, verbatim matches are not desirable for the comparison of a pair of gene sets. Instead, one should take into consideration the number of nodes in the GO tree that separate a pair of terms. For this, we used so-called semantic similarity, as implemented in the R package GOSemSim. For each pair of traits, we calculated the semantic similarity of the gene sets and plotted it against the correlation coefficient between the trait values (Fig. 2). The pairs showing semantic similarity greater than 0.8 corresponded to traits that had high correlations in the trait values. We also noted many pairs having high semantic similarity, despite low phenotypic correlation.

Scatter plot of correlation coefficients versus biological process Gene Ontology semantic similarities (GOSemSim) between trait pairs. The red horizontal line marks the GOSemSim value at 0.75.
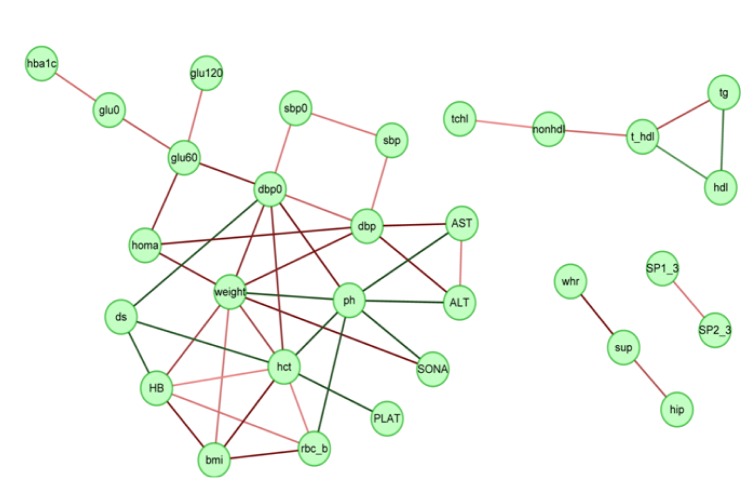
We selected 46 trait pairs that showed a semantic similarity in gene sets greater than an arbitrary cutoff of 0.75 and depicted the interaction network using Cytoscape (Fig. 3). The traits related to blood lipid levels, such as total cholesterol, high density lipoprotein cholesterol, low density lipoprotein cholesterol, and triglycerides (TGs), formed a small network by themselves. As cholesterol and TGs are components of lipoproteins, it is not surprising to observe such a network. Both hip and waist-hip ratio are connected to suprailiac skinfold; they are all related to body fat. The most striking feature is a large network involving 20 traits. In this network, the traits related to blood glucose levels, such as GLU0, GLU60, GLU120, HbA1c, and HOMA, form a subnetwork. In addition, the traits related to either blood pressure or liver damage also formed respective subnetworks, as expected from their high phenotypic correlations.

Interaction network between traits based on biological process Gene Ontology semantic similarity. Pairs of traits having the semantic similarity greater than 0.75 are connected. On the other hand, the edge color represents the direction of phenotypic correlations (red and green for positive and negative correlations, respectively), and the brightness of the line represents the level of correlation (the brighter the higher correlation, and the darker the lower correlation).
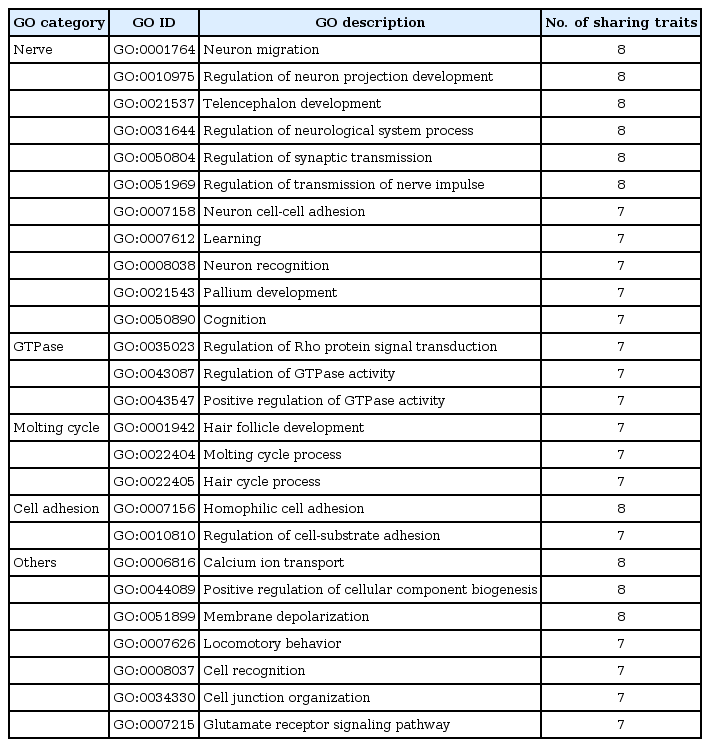
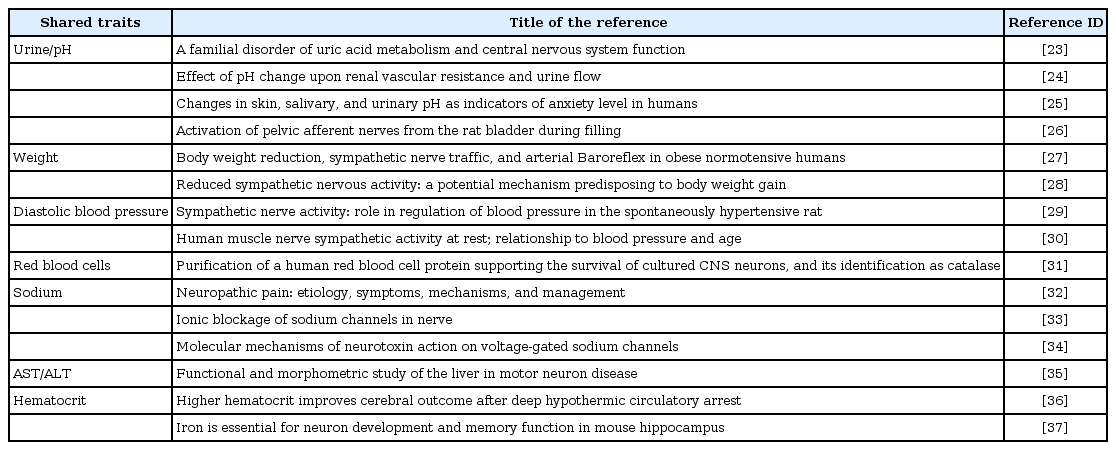
We also noted some hub nodes having many first neighbors. Interestingly, the pH level was connected to 7 other traits, none of which showed high phenotypic correlations with it. We examined the gene sets that were commonly shared between these traits (Table 2). Among them, 11 were related to neuron development and function. We surveyed the literature for putative involvement of neuronal or nerve systems in the regulation of those 8 traits (Table 3). Although it is presumptive, this may imply that these traits are regulated partly by common pathways that involve the neuronal system.
In conclusion, our work may be a useful approach for discovering pleiotropy.
Acknowledgments
The genotype and phenotype data were kindly provided by the Korea National Institute of Health, Centers for Disease Control and Prevention, the Republic of Korea.
The financial support of this work was made available by the Basic Science Research Program through the National Research Foundation of Korea (NRF), funded by the Ministry of Education, Science, and Technology (NRF-2010-0021811).


