Understanding Disease Susceptibility through Population Genomics
Article information
Abstract
Genetic epidemiology studies have established that the natural variation of gene expression profiles is heritable and has genetic bases. A number of proximal and remote DNA variations, known as expression quantitative trait loci (eQTLs), that are associated with the expression phenotypes have been identified, first in Epstein-Barr virus-transformed lymphoblastoid cell lines and later expanded to other cell and tissue types. Integration of the eQTL information and the network analysis of transcription modules may lead to a better understanding of gene expression regulation. As these network modules have relevance to biological or disease pathways, these findings may be useful in predicting disease susceptibility.
Introduction
Genetic epidemiology is the study of the role of genetic factors in determining health and disease in families and in populations and the interplay of such genetic factors with environmental factors [1]. Depending on the number of genetic factors that contribute to pathogenicity, genetic diseases are categorized into two classes. A so-called monogenic disorder is usually caused by a single gene mutation and has been the subject of intense gene hunting studies using familial linkages, totaling to more than 4,000 diseases being linked to causal mutations [2]. Completion of the Human Genome Project expedited the studies of not only monogenic diseases but also complex diseases. The latter, also called polygenic or multifactorial diseases, are contributed by a number of genetic factors of relatively smaller effects. Unlike monogenic disorders that often affect only a small portion of a population and are consequently rarely observed, polygenic diseases are usually frequently observed in a population and are also termed common diseases. Chronic diseases, such as cancer, diabetes, hypertension, and so on, belong to this category.
The Human Genome Project paved the way to cataloging common variants in the human genome. The International HapMap Project is a global collaboration to map single-nucleotide polymorphisms (SNPs) in the human genome and to construct haplotype maps that show which allele of a locus co-occur with which allele of another locus. Using three representative continental populations-that is, Africans, Europeans, and Asians-the international consortium cataloged roughly 1 SNP for every 300 bp of the human genome. The information of position, frequency, and correlation structure, called linkage disequilibrium of these SNPs, has enabled us to design high-density SNP chips that can measure the genotypes of fractions of those SNPs all at once and infer the genetic make-up of the major portion of the whole genome. Using these chips, genotypes of families or unrelated populations are measured, and the loci displaying statistically significantly different frequency patterns between disease-affected and unaffected groups are sought. Individuals harboring such alleles may have a higher or lower disease susceptibility than control groups. Scanning genome-wide associations of genotype-phenotype relationships is called a genome-wide association study (GWAS) and has become extremely popular, reporting more than 1,000 papers within the last 5-6 years [3], probably due to the hypothesis-free nature of its study design. While GWASs have been applied to studies of disease gene hunting, they are also well suited to interrogating genes affecting heritable phenotypes, such as height, obesity, plasma glucose concentration, blood pressure, bone density, and so on. Unlike disease studies where samples are segregated into case and control groups, these phenotypes display a continuous spectrum of values in normal populations. For s uch a quantitative trait, its statistical correlation with the genotypes within a population is sought, instead of dichotomizing the samples into case and control groups. The genomic loci that show correlations with such a trait are called quantitative trait loci (QTLs).
The Concept of Expression QTLs
According to the current estimate, the human genome harbors around 22,000 genes and 200,000 mRNA transcripts [4]. One way that variations in the genomic sequence can exert phenotypic differences is through the alteration of structure and function of the gene products. Genetic variation may also result in changes in the expression levels of products and, thereby, their activities. Since most SNPs identified through GWASs do change the amino acid sequence of a protein, large portions of the genetic variation may be regulatory in nature. Differences in gene expression profiles between individuals then become molecular and intermediate phenotypes that in turn induce changes in higher-order disease traits [5]. In fact, Cheung et al. [6] observed some genes showing markedly different expression levels between individuals and familial aggregation of expression phenotypes. In their follow-up study using 14 large families, they also identified approximately 1,000 expression phenotypes that showed significant evidence of linkage to specific chromosomal regions [7]. Dixon et al. [8] also observed heritable expression patterns in about 30% of the genes and transcripts of their probes and identified the genomic regions where the genotypes were associated with those expression phenotypes. These are termed expression QTL (eQTL) and can be proximal (cis) or distal (trans) to the gene of expression variation (Fig. 1). Other species also show eQTL. For example, eQTLs have been observed in recombinant inbred mouse strains [9-11], yeast [12, 13], and plants [14].

The concept of expression quantitative trait loci (eQTLs). If transcript abundance depends on the genotype of a genomic locus, such a region is called an eQTL. If an eQTL is found inside or near the boundary of the target gene, it is classified as cis-regulatory (A); otherwise, it is trans-regulatory (B). In the latter case, the expression level of a target gene is not regulated by its cis-eQTL but through a regulator, such as a transcription factor (TF), whose expression is regulated by its cis-element.
The B-lymphoblastoid cell lines established by the International HapMap Project provide invaluable resources for the study of eQTL: for these samples, matched genotypes and expression profiles are publicly available. It is well known that genome-wide genotype profiles have the power to discriminate continental populations. Principal component analysis of the genotypes of the HapMap populations clearly clusters the individuals according to their population origins [15]. On the other hand, it appears that the population difference in expression levels is negligible [16] or very small [17]. For example, the expression levels averaged over each population are highly correlated between populations (Fig. 2). Apparently, the within-group expression variance is much larger than the between-group variance. This is perhaps due to the fact that unlike genotypes that can drift somewhat freely without functional alteration, gene expression levels are tightly regulated by complex genetic programs. Instead of focusing on population differences in expression levels, intense effort has been made to cataloging eQTLs and classifying them into cis and trans. For example, using the HapMap samples of European and African ancestry, Duan et al. [18] found about 5,000 expression quantitative nucleotides (eQTNs) in each population. They used 4 Mb of distance between the gene and SNP as the criteria for classifying local and distant eQTNs and observed that genes harboring distant eQTNs were enriched with functions, like transmembrane signal transduction, implying roles in gene expression regulation [18]. Stranger et al. [17] used all 270 HapMap samples to identify at least 1,348 and 180 genes showing cis and trans association signals, respectively. Their result is in sharp contrast to the previous estimate that counts most eQTLs as trans rather than cis [7]. Veyrieras et al. [19] reanalyzed the HapMap data using a sophisticated Bayesian hierarchical model to resolve the eQTLs at a fine scale: most eQTLs lay either within genes or close to genes (<20 kb); eQTLs were enriched around transcription start sites and 250 bp upstream of transcription end sites, and exons were more likely to be eQTLs than introns. Their finding of enriched eQTLs upstream of transcription end sites is interesting, in that this site is related to post-transcriptional control and mRNA stability. This underscores the important role of mRNA stability besides transcription initiation in determining steady-state mRNA levels [19].
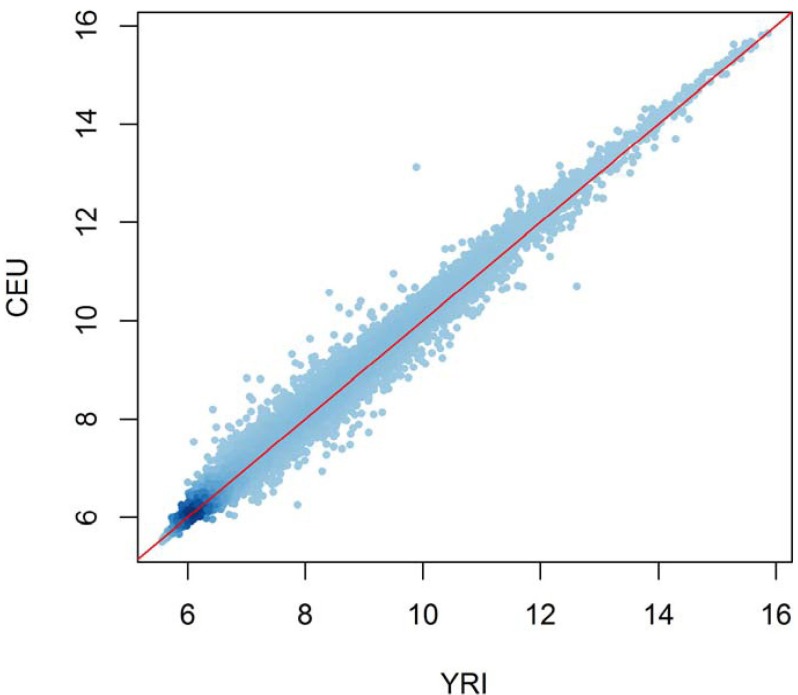
Comparison of average expression levels of all genes between two ethnic groups. The expression profile datasets of the International HapMap populations (European [CEU] and African [YRI]) measured in lymphoblastoid cell lines were downloaded from Gene Expression Omnibus (GEO accession no. GSE6536). For each of the 19,723 genes, the log-transformed expression levels of both 60 YRI and 60 CEU individuals were averaged and plotted on the x- and y-axis, respectively.
Allele-Specific Expression
The presence of cis-acting eQTLs for a gene implies that these alleles have different transcription levels or allelespecific expression. The typical microarray chips designed for expression measurement do not usually distinguish minute sequence differences of the SNP alleles residing within a transcript. One can infer the allele-specific expression using statistical tests that model the expression levels of a gene with the number of minor alleles at each locus. On the other hand, by hybridizing the transcripts onto SNP chips or directly sequencing the transcripts, one can validate the allele-specific expression. Ge et al. [20] used Illumina Human 1M Beadchips to measure allele-specific expression in 53 lymphoblastoid cell lines derived from European descendants. With the advent of next-generation sequencing technologies, RNA-seq has become popular and has been applied to detecting allele-specific expression. Pickrell et al. [21] sequenced RNA from 69 lymphoblastoid cell lines derived from unrelated African individuals who participated in the International HapMap Project, discovering a number of eQTLs involved in allele-specific expression or allele-specific splicing.
Tissue-Dependent eQTLs
So far, most eQTL studies have examined expression-genotype relations in lymphoblastoid cell lines. Since many genes display tissue-specific expression patterns, one may argue that the expression-genotype relations observed in Epstein-Barr virus-transformed lymphoblastoid cell lines may not be preserved in other tissues or cell types. Gerrits et al. [22] observed that eQTLs were quite different, depending on the differentiation status of the cells, suggesting uncommon functional regulatory networks among different cell types. Nica et al. [23] compared cis-regulatory eQTLs from three different tissues of co-twin samples from the MuTHER project (http://www.muther.ac.uk/), observing 30% shared eQTLs, 29% exclusively tissue-specific eQTLs, and substantial differences in expression levels in different tissues. In addition to the similar proportion of exclusively tissue-specific cis-regulatory eQTLs from five different tissues, Fu et al. [24] also observed many examples of alternative regulation, where a gene is cis-associated with different SNPs, depending on the tissue. If one were to use eQTL information in predicting disease susceptibility, it is thus imperative to understand expression-genotype relations in the tissue of interest, not just in lymphoblastoid cell lines [25]. When transcript expression levels were measured in adipose tissues as well as blood in large population cohorts, unlike expression profiles in blood, a marked correlation between expression levels in adipose tissues and obesity-related traits was observed [26]. Schadt et al. [5] observed over 6,000 associations between genotypes and expression in 400 human liver samples to understand the genetic architecture of gene expression in the human liver, a metabolically important tissue involved in various common diseases, such as obesity, cancer, diabetes, and atherosclerosis.
Network-Based Understanding of eQTLs
We have reviewed above that natural variation in gene expression is substantial and heritable. Genetic analyses of expression phenotypes have identified cis- and trans-associated loci, culminating in our understanding of gene expression regulation. One should understand that not all genes showing natural variation are regulated by either cis- or trans-eQTLs. For example, genes downstream of eQTL-regulated genes in a regulatory network may also show natural variation. If they are regulated primarily by a regulator, their expression profile may resemble that of the regulator. On the other hand, if multiple regulators are involved, the downstream target genes may show complex expression profiles that may look independent of those of the regulators. Integrating the bioinformatic learning of regulatory programs and genetic analysis of cis- and trans-acting DNA variants may lead to a better understanding of gene expression regulation [27]. Nayak et al. [28] constructed co-expression networks based on the HapMap expression profiles of African, European, and Asian ancestries, discovering that the subnetwork structures are not random but relevant to biological pathways or disease susceptibility. This implies that genes are regulated by a common set of regulatory modules and that the variable activity of the modules due to genetic variation can result in clustered expression profiles of the target genes. Li et al. [9], using 32 recombinant inbred mouse strains, reported 29 transcription modules and their associations with 18 classical physiological and behavioral traits, possibly through eQTLs.
Discussion
Individual variation in gene expression levels may be influenced by environmental and genetic factors. A substantial proportion of the variation is heritable and thus has a genetic basis. Based on studies on population-level genotype-expression data, it is now well established that DNA variations affect the expression levels of nearby or remote genes. Since the genotype data used in these studies were mostly measured on commercial SNP chip platforms of common variants, the causal eQTLs must be probed SNPs or located within the linkage disequilibrium blocks tagged by the probed SNPs. Whatever the case is, one may wonder whether those eQTLs evolved neutrally without any selection pressure or whether they were the result of selection over human population history. The co-expression network study by Nayak et al. [28] indicated that the subnetworks are modular and coherent in biological functions. It is very unlikely that such network structures were derived as the result of random drift in genomic variations. It is also interesting that evolutionary selection operated on a network or pathway level. Although they must have occurred gene by gene, the whole sum of the variations has biological themes. If the activity of the pathways is variable between normal individuals, it has an implication in predicting disease susceptibility. As the subjects probed by gene expression profiling are normal individuals, the variations of the pathway activity may not be large enough to trigger diseases. Nevertheless, they may predispose the genetic background of an individual to be susceptible or resistant to certain diseases. For example, individuals having slightly diminished immune pathway activities may have a high tendency of contracting infectious diseases or other immune-related diseases. The next challenge would then be the experimental validation of this hypothesis.
Acknowledgments
We would like to thank Ji-sun Kwon for editing the manuscript. This work is based partly on the joint thesis of SH and JN for the B.S. degree at Soongsil University. This work was supported financially by the Next-Generation BioGreen 21 Program (no. PJ007991), Rural Development Administration, Korea.