Risk Prediction Using Genome-Wide Association Studies on Type 2 Diabetes
Article information
Abstract
The success of genome-wide association studies (GWASs) has enabled us to improve risk assessment and provide novel genetic variants for diagnosis, prevention, and treatment. However, most variants discovered by GWASs have been reported to have very small effect sizes on complex human diseases, which has been a big hurdle in building risk prediction models. Recently, many statistical approaches based on penalized regression have been developed to solve the “large p and small n” problem. In this report, we evaluated the performance of several statistical methods for predicting a binary trait: stepwise logistic regression (SLR), least absolute shrinkage and selection operator (LASSO), and Elastic-Net (EN). We first built a prediction model by combining variable selection and prediction methods for type 2 diabetes using Affymetrix Genome-Wide Human SNP Array 5.0 from the Korean Association Resource project. We assessed the risk prediction performance using area under the receiver operating characteristic curve (AUC) for the internal and external validation datasets. In the internal validation, SLR-LASSO and SLR-EN tended to yield more accurate predictions than other combinations. During the external validation, the SLR-SLR and SLR-EN combinations achieved the highest AUC of 0.726. We propose these combinations as a potentially powerful risk prediction model for type 2 diabetes.
Introduction
Genome-wide association studies (GWASs) have successfully identified susceptibility variants associated with human diseases. However, most susceptibility variants have small effect sizes and explain only a small proportion of heritability [1]. The presence of a large number of variants genotyped for a small number of subjects (commonly known as “large p small n”) has been one major challenge in building disease risk prediction models. Furthermore, the issue of multicollinearity arises when there is high linkage disequilibrium (LD) among single-nucleotide polymorphisms (SNPs). Multiple regression is very unstable and sensitive due to multicollinearity, in which the coefficient estimates have very large variances [2]. Recently, various statistical approaches have been proposed to cope with these issues.
Traditional approaches for disease risk prediction have been based on gene scores (GSs) [3456]. The marginal effects of previously known disease-associated loci are estimated, and then, their sum can be used to construct a risk prediction model. While GS-based approaches can be useful when a genetic variant is responsible for diseases [7], they show low prediction performance when multiple genetic variants exist for a complex disease [89]. For example, the prediction performance for coronary heart and disease type 2 diabetes (T2D) is only 0.59 and 0.58, respectively, for area under the receiver operating characteristic curve (AUC) values [89].
For complex diseases, a more accurate and reliable prediction model is required. Multiple logistic regression (MLR) is a classification method that utilizes combined information across multiple genetic variants. Several studies have shown that the MLR-based approach is useful in building a disease risk prediction model [10111213]. However, if there is large LD between SNPs, the parameter estimates of MLR become unstable, and as a result, the risk prediction model has weak predictive power.
As an alternative to MLR, data mining approaches have been used widely to improve risk prediction performance. In particular, support vector machine (SVM) [1415] and random forest [1617] have been shown to outperform other classification algorithms [18]. Although these data mining approaches may provide very useful tools in classification, the effects of genetic variants on a disease in prediction models are not easy to interpret. Furthermore, these approaches do not give class conditional probabilities of individual predictions [19]. Thus, we focus mainly on penalized regression approaches in this paper, which provides an individual prediction result in terms of probability.
As mentioned before, the problem of “large p small n” interrupts the estimation of the joint effect of multiple genetic variants. In order to overcome this, various penalized regression approaches have been proposed, such as ridge [202122], least absolute shrinkage and selection operator (LASSO) [23], and Elastic-Net (EN) [24]. These penalized approaches have an advantage in terms of both variable selection and prediction power over non-penalized approaches for high-dimensional data. For instance, the prediction performance for Crohn disease and inflammatory bowel disease using a number of genetic variants with penalized approaches has been shown to improve [2526].
In this study, we investigated the effect of variable selection on the performance of prediction methods. Especially, we considered the following methods for variable selection and prediction: stepwise logistic regression (SLR), LASSO, and EN. We compared the effect of variable selection on the performance of prediction by applying them to T2D GWAS chip data. We constructed the prediction models by combining variable selection and prediction methods using the Korean Association Resource (KARE) GWAS dataset (3,180 individuals) and then evaluated the performance of the risk prediction model through both internal validation (805 individuals in the KARE testing dataset) and external validation (4,723 individuals in an external replication dataset). The external replication dataset combined two cohorts: the Health2 study (1,816 individuals) and Health Examinee (HEXA) study (3,696 individuals). In both the internal and external validation datasets, we measured the discriminative accuracy of the prediction models using AUC.
Methods
KARE dataset
The KARE project was initiated in 2007 to undertake a large-scale GWAS with 10,038 participants from two community-based cohorts (i.e., the rural Anseong and urban Ansan cohorts). Among the participants, 10,004 samples were genotyped using Affymetrix Genome-Wide Human SNP Array 5.0 Affymetrix, Santa Clara, CA, USA). From sample and SNP quality controls, a total of 8,842 individuals were selected from the Anseong (2,374 men and 2,263 women) and Ansan (1,809 men and 2,396 women) cohorts [27]. Missing genotypes were imputed using the Beale software program [28].
In this study, a total of 3,985 samples were selected from among the 8,842 individuals using T2D diagnostic criteria [2930]. A total of 1,042 subjects were included in the T2D group according to the following criteria: (1) fasting plasma glucose (FPG) larger than or equal to 126 mg/dL, 2-hour postprandial blood glucose (Glu120) larger than or equal to 200 mg/dL, (2) treatment of T2D, and (3) age of disease onset ≥ 40 years. The inclusion criteria for nondiabetic normal subjects (n = 2,943) were as follows: (1) FPG less than or equal to 100 mg/dL or Glu120 less than or equal to 140 mg/dL and (2) no history of diabetes. The demographic variables of the subjects are summarized in Table 1.

Demographic variables for KARE, Health2, and HEXA cohorts
Health2 and HEXA datasets
We combined two Korean GWASs, the Health2 study (n = 1,816) and the HEXA study (n = 3,696). The Health2 study consists of community-based cohorts from 5 rural areas (i.e., Wonju, Pyeongchang, Gangneung, Geumsan, and Naju), and the HEXA study is a cohort from 14 urban areas. These samples were genotyped using the Affymetrix Genome-Wide Human SNP array 6.0. The Health2 and the HEXA cohorts have been described in previous studies [273132]. Missing genotypes were were imputed using Beagle software.
Our investigation was based on the analysis of an external replication dataset of 4,723 samples (1,112 T2D subjects, 3,611 normal subjects) for T2D [33]. The criteria for grouping T2D subjects (nHealth2 = 794, nHEXA = 318) and nondiabetic normal subjects (nHealth2 = 770, nHEXA = 2,841) were FPG level (FPG ≥ 126 for T2D subjects and FPG ≤ 100 for nondiabetic normal subjects) and history of T2D treatment. The demographic variables of the subjects in the Health2 and HEXA cohorts are summarized in Table 1.
Statistical analysis
For the joint identification of disease susceptibility variants among a large number of SNPs, we extracted SNPs having a strong correlation with T2D via logistic regression for single-variant analysis and collected the list of reported SNPs from a GWAS catalog [34]. Then, we implemented a 3-stage procedure as follows: the first stage was variable selection using SLR, LASSO, and EN. The second stage was the construction of risk prediction models. The third stage was evaluation of the risk prediction models through both internal validation and external validation.
SNP sets
Because the components of SNPs seem to be related to the performance of risk prediction, we used two data sources (i.e., the GWAS catalog and KARE cohort). First, we collected the SNPs, p1, from a GWAS catalog in all populations and an Asian population only. Second, the SNPs were selected by single-variant association test using logistic regression, with adjustments for age, sex, area (namely, rural area of Anseong and urban area of Ansan), and body mass index (BMI). We chose the top-ranked p2 SNPs by the order of p-values from the KARE cohort. In Table 2, we have categorized five SNP sets.
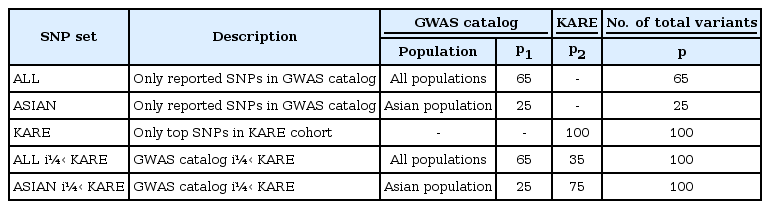
List of the SNP sets
(1) ALL (SNPs only reported in the GWAS catalog)
(2) ASIAN (SNPs only reported in the GWAS catalog with an Asian population)
(3) KARE (only top-ranked p2 SNPs in the KARE cohort)
(4) ALL + KARE (combined SNPs in the GWAS catalog and KARE cohort)
(5) ASIAN + KARE (combined SNPs in the GWAS catalog with an Asian population and the KARE cohort)
Stage 1: Variable selection
In the KARE dataset, we separated 3,985 individuals (1,042 T2D subjects, 2,943 normal subjects) into a training set of 3,180 individuals (830 T2D subjects, 2,350 normal subjects) and a test set of 805 individuals (212 T2D subjects, 593 normal subjects) (see Fig. 1). The variable selection was performed using 5-fold cross-validation (CV) on the training set. We describe the details below.
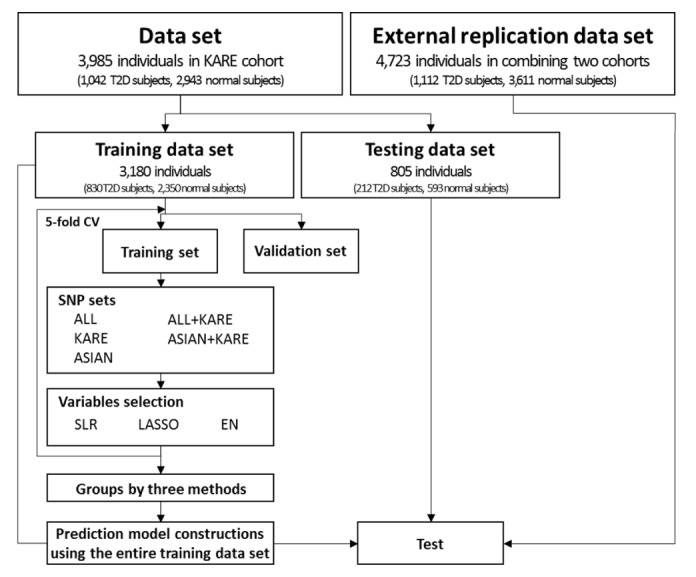
Outline of the risk prediction model construction and validation. T2D, type 2 diabetes; CV, cross-validation; ALL, single-nucleotide polymorphisms (SNPs) only reported in the genome-wide association study (GWAS) catalog; KARE, Korean Association Resource; ASIAN, SNPs only reported in the GWAS catalog with an Asian population; ALL + KARE, combined SNPs in the GWAS catalog and KARE cohort; ASIAN + KARE, combined SNPs in the GWAS catalog with an Asian population and the KARE cohort; SLR, stepwise logistic regression; LASSO, least absolute shrinkage and selection operator; EN, Elastic-Net.
The phenotype yi of subject i = 1, …, n was set as a dependent variable (T2D = 1, normal = 0), and the genotype xij of the j-th SNP (j = 1, …, p) for subject i was set as an independent variable with an additive genetic model (AA = 0, Aa = 1, aa=2, where A and a indicate the major and minor alleles, respectively).
For variable selection, the following SLR was conducted.
 ,
,The penalized method solves the following:
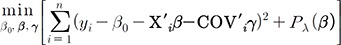 ,
,Then, we defined five sets as follows:
(1) One set: set of SNPs that have a non-zero coefficient at least one time among the 5-fold CV
(2) Two set: set of SNPs that have a non-zero coefficient at least two times among the 5-fold CV
(3) Three set: set of SNPs that have a non-zero coefficient at least three times among the 5-fold CV
(4) Four set: set of SNPs that have a non-zero coefficient at least four times among the 5-fold CV
(5) Five set: set of SNPs having non-zero coefficients in the 5-fold CV,
where one set ⊃ two set ⊃ three set ⊃ four set ⊃ five set.
Stage 2: Construction of risk prediction models
For construction of the risk prediction model, we considered 9 combinations of variable selection and prediction methods (i.e., SLR-SLR, SLR-LASSO, SLR-EN, LASSO-SLR, LASSO-LASSO, LASSO-EN, EN-SLR, EN-LASSO, and EN-EN). For each combination, we constructed prediction models using the entire KARE training dataset (n = 3,180).
Stage 3: Evaluation of risk prediction models
For evaluating the risk prediction performance, we needed to assess both internally and externally to determine the performance of the prediction models. To validate the risk prediction methods, we used internal and external validation datasets from the KARE testing dataset (n = 805) and an external replication dataset (n = 4,723), respectively. In both the internal and external validation datasets, we used the AUC of the receiver operator characteristic (ROC) curve, which is widely used for risk prediction performance [3839]. The ROC curve is a graphical plot of sensitivity (true positive rate) against 1 – specificity (false-positive rate) across all possible threshold values. A summary measure of ROC curves, such as AUC, is indicated as the discriminative accuracy. An AUC score close to 0.5 reflects random chance, while AUC values closer to 1 indicate perfect accuracy.
Results
Preparing SNP sets
The association of T2D was analyzed using logistic regression with adjustments for age, sex, area, and BMI as covariates. As shown in Supplementary Fig. 1A, the quantile-quantile plot shows that the observed p -values at the tail are significantly larger than the null distribution. Six SNPs in CDKAL1 had associations that reached a genome-wide significance level of p-value less than 1.45 × 10⁻⁷ (Supplementary Table 1, Supplementary Fig. 1B). Supplementary Table 1 shows the results with a p-value threshold of less than 5.00 × 10⁻⁵. rs7754840 (p = 4.66 × 10⁻⁸) of CDKAL1 and rs10811661 (p = 7.17 × 10⁻⁶) of CDKN2A/2B have been observed to affect T2D in previous GWASs [404142434445]. In the GWAS catalog, we found 65 SNPs and 25 SNPs associated with T2D in all populations and the Asian population, respectively (Supplementary Table 2). As previously mentioned, we categorized five SNP sets from two data sources in Table 2.
Selection of predictor variables
In each SNP set, the variable selection methods were applied to 5-fold CV on the training set. Fig. 2 shows information about the number of overlapping SNPs by 5-fold CV for each variable selection method. Table 3 provides a summary of the results of the variable selection. The variable selection methods gave very similar results in the ALL and ASIAN datasets, whereas the results showed differences among the methods in the KARE and ALL + KARE datasets. Furthermore, SLR generally tended to select a smaller number of SNPs than LASSO and EN.
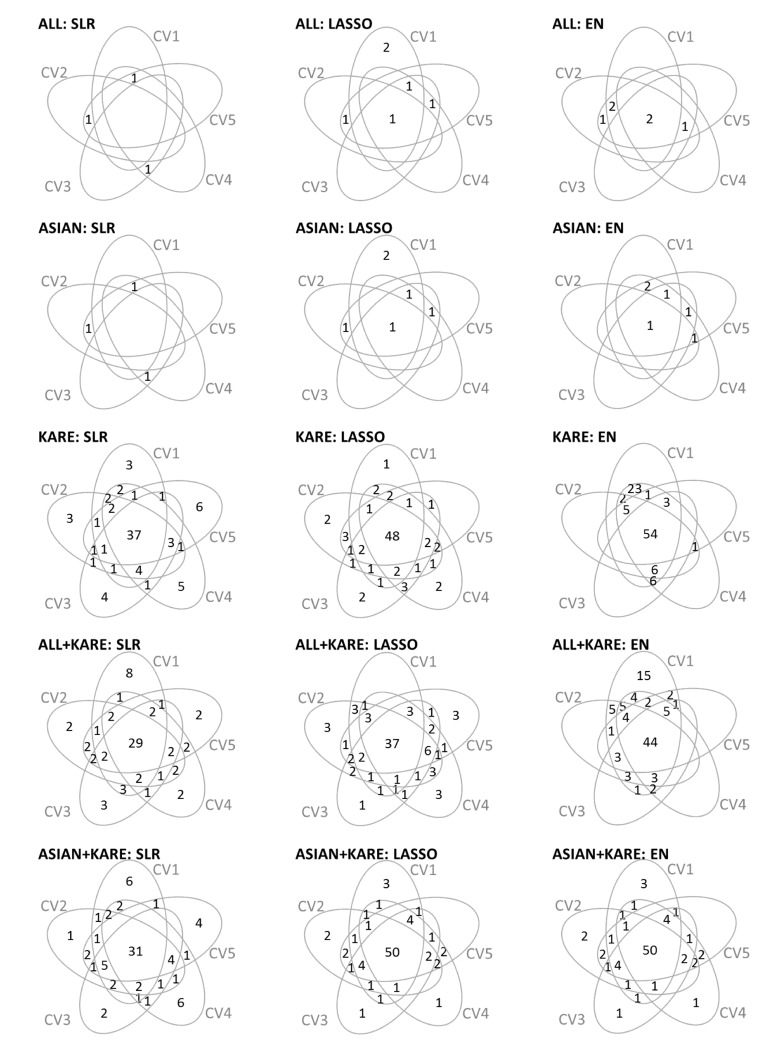
Venn diagrams summarizing the number of variables shared among 5-fold CV by variables selection methods. CV, cross-validation; ALL, single-nucleotide polymorphisms (SNPs) only reported in the genome-wide association study (GWAS) catalog; ASIAN, SNPs only reported in the GWAS catalog with an Asian population; KARE, Korean Association Resource; ALL + KARE, combined SNPs in the GWAS catalog and KARE cohort; ASIAN + KARE, combined SNPs in the GWAS catalog with an Asian population and the KARE cohort; SLR, stepwise logistic regression; LASSO, least absolute shrinkage and selection operator; EN, Elastic-Net.
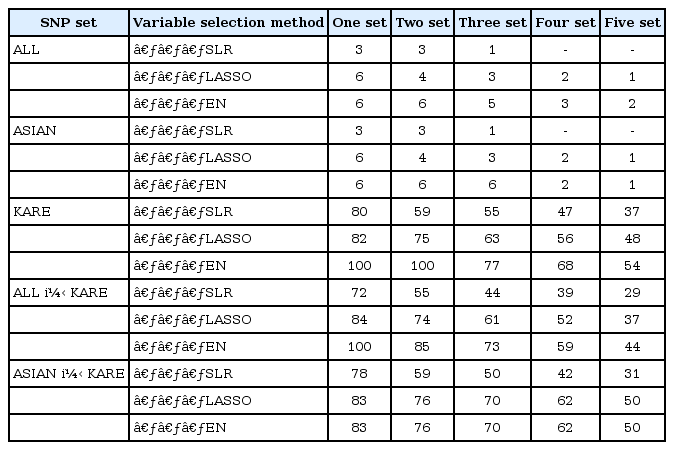
Number of overlapping SNPs selected by 5-fold CV for each variable selection method
Construction of prediction models and validation in testing datasets
We fitted the prediction models using SLR, LASSO, and EN using the entire training individuals in the KARE cohort. Then, we applied the prediction models to the KARE testing dataset and an external replication dataset. The prediction models were built based on Affymetrix 5.0, but the external replication dataset was generated by Affymetrix 6.0. In the case of the KARE dataset, nearly 90% of the SNPs belonged to the external replication dataset. Thus, we did not include untyped SNPs in the evaluation of prediction models using the replication dataset. Among the five SNP sets, Fig. 3 shows that the prediction models from the KARE SNP set had higher AUC values for the KARE testing dataset than other SNP sets. In contrast, as shown in Fig. 4, the prediction models from ALL + KARE had the best performance overall for the external replication dataset. In Table 4, the best combinations of the variable selection and prediction models had the highest AUC values. SLR-LASSO and SLR-EN with three set from KARE had an AUC of 0.816 in the KARE testing dataset. In an external replication dataset, SLR-SLR and SLR-EN with one set from ALL + KARE (AUC, 0.726) were the best, with 51 SNPs for T2D, while SLR-LASSO and SLR-EN with three set from KARE (AUC, 0.590) showed the best performance, with 53 SNPs. SLR-SLR with one set from ALL + KARE was superior to the model with only demographic variables (15.7% increase in AUC). Among the 51 SNPs of SLR-SLR with one set from ALL + KARE, 38 SNPs were mapped to the genes (Table 5). Some genes (AGR3, C2CD4B, C6orf57, CAMK1D, DNER, IGF2BP2, KCNJ11, KCNQ1, NXN, PLS1, and RGS7) were previously reported to be associated with T2D [44454647484950515253].

Internal validation shows the AUC values for each combination of variable selection and prediction methods. Each bar represents one of five SNP data sets. AUC, area under the receiver operating characteristic curve; SNP, single-nucleotide polymorphism; ALL, SNPs only reported in the genome-wide association study (GWAS) catalog; ASIAN, SNPs only reported in the GWAS catalog with an Asian population; KARE, Korean Association Resource; ALL + KARE, combined SNPs in the GWAS catalog and KARE cohort; ASIAN + KARE, combined SNPs in the GWAS catalog with an Asian population and the KARE cohort; SLR, stepwise logistic regression; LASSO, least absolute shrinkage and selection operator; EN, Elastic-Net.
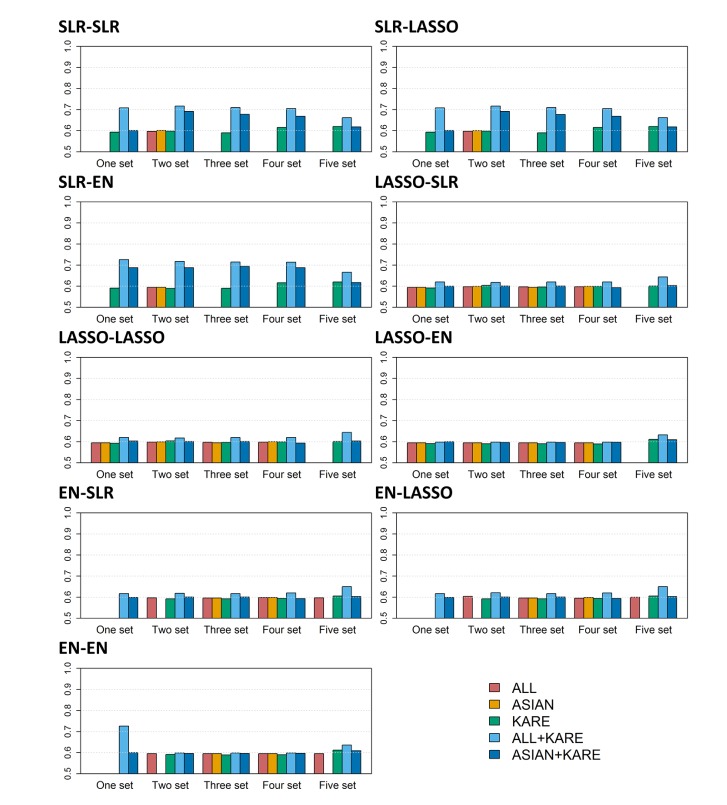
External validation shows the AUC values for each combination of variable selection and prediction methods. Each bar represents one of five SNP data sets. AUC, area under the receiver operating characteristic curve; SNP, single-nucleotide polymorphism; ALL, SNPs only reported in the genome-wide association study (GWAS) catalog; ASIAN, SNPs only reported in the GWAS catalog with an Asian population; KARE, Korean Association Resource; ALL + KARE, combined SNPs in the GWAS catalog and KARE cohort; ASIAN + KARE, combined SNPs in the GWAS catalog with an Asian population and the KARE cohort; SLR, stepwise logistic regression; LASSO, least absolute shrinkage and selection operator; EN, Elastic-Net.

Summary of prediction performance in KARE testing dataset and an external replication dataset
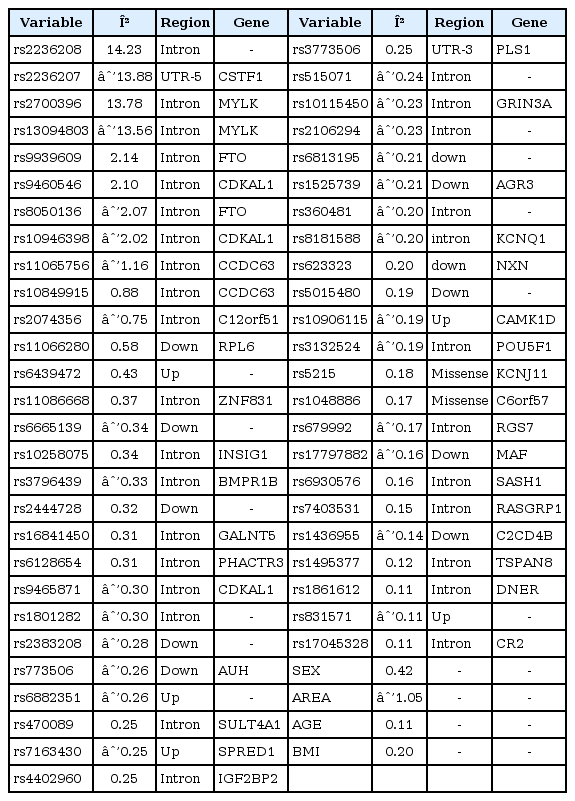
Development of SLR-SLR prediction model with one set from ALL + KARE for predicting T2D
Discussion
In this study, we compared the performance of risk prediction models combining variable selection and prediction methods. Also, the effect of five SNP sets (i.e., ALL, ASIAN, KARE, ALL + KARE, and ASIAN + KARE) on risk prediction performance was investigated. Overall, we confirmed that prediction models incorporating both demographic variables and genetic variables were more accurate than prediction models using only demographic variables. According to our results, the best combinations were SLR-LASSO and SLR-EN with three set from the KARE SNP set in the KARE testing dataset, whereas the SLR-SLR and SLR-EN combination with one set from the ALL + KARE SNP set outperformed all other combinations in an external replication dataset.
The analysis of risk prediction studies can be extended in several ways. First, the performance of a risk prediction model can be improved by incorporating rare variants. Advances in sequencing technology make it possible to investigate the role of common and rare variants in risk prediction of complex diseases. Wei and Lu [54] proposed a collapsing ROC approach that incorporates genetic information from both common and rare variants. A prediction algorithm based on SVM with common and rare variants was proposed in order to improve predictive performance [55]. Second, integrating biological knowledge into a risk prediction model will provide more accurate predictions and biologically meaningful interpretation. Eleftherohorinou et al. [56] have shown success of a pathway-based prediction test of GWAS data. Recently, a pathway-based approach was proposed to incorporate principal components of pathway effects and pathway-covariate interactions into logistic regression [57]. Furthermore, a risk prediction model can be used to investigate multiple types of omics data, such as The Cancer Genome Atlas datasets. The recent developments of single-molecule sequencing technologies (i.e., third-generation sequencing) has facilitated integrated analysis of multi-omics data. There is no doubt that multi-omics data will lead to improvement of risk prediction models.
Acknowledgments
This research was supported by a grant of the Korea Health Technology R&D Project through the Korea Health Industry Development Institute (KHIDI), funded by the Ministry of Health & Welfare, Republic of Korea (HI15C2165), and the Bio-Synergy Research Project (2013M3A9C4078158) of the Ministry of Science, ICT and Future Planning through the National Research Foundation. The GWAS chip data were supported by bioresources from the National Biobank of Korea, the Centers for Disease Control and Prevention, Republic of Korea (4845-301, 4851-302 and -307).
References
Supplementary materials
Supplementary data including two tables and one figure can be found with this article online http://www.genominfo.org/src/sm/gni-14-138-s001.pdf.
Supplementary Table 1
Genetic loci associated with T2D after adjusting for age, sex, area, and BMI (p < 5.00×10−05)
Supplementary Table 2
List of SNPs reported by a GWAS catalog
Supplementary Fig. 1
Results of single-variant analysis for 344,893 SNPs in KARE cohort. (A) QQ plot of p-values derived from logistic regression with adjustments for Age, Sex, Area, and BMI. The shaded region represents the 95% confidence interval around the null hypothesis. (B) Manhattan plot of association p-values for T2D. The x-axis indicates the physical position of each genetic variant, and y-axis plots –log10(p-value). The genome-wide significance level is set to 1.45 × 10−07 and is plotted as a red dotted line. SNP, single-nucleotide polymorphism; KARE, Korean Association Resource; QQ, quantile-quantile; BMI, body mass index; T2D, type 2 diabetes.