Genetic Architecture of Transcription and Chromatin Regulation
Article information
Abstract
DNA microarray and next-generation sequencing provide data that can be used for the genetic analysis of multiple quantitative traits such as gene expression levels, transcription factor binding profiles, and epigenetic signatures. In particular, chromatin opening is tightly coupled with gene transcription. To understand how these two processes are genetically regulated and associated with each other, we examined the changes of chromatin accessibility and gene expression in response to genetic variation by means of quantitative trait loci mapping. Regulatory patterns commonly observed in yeast and human across different technical platforms and experimental designs suggest a higher genetic complexity of transcription regulation in contrast to a more robust genetic architecture of chromatin regulation.
Introduction
Quantitative trait loci (QTL) mapping has been widely used to discover underlying genetic factors that can explain particular phenotypes of interest. Thanks to DNA microarray technology, the expression phenotype of thousands of genes was associated with the genotypes across the whole genome in expression QTL mapping [1234567]. Recent advent of next-generation sequencing technology has enabled a genetic profiling of chromatin traits as well as more in-depth analyses of gene expression variation. Especially, the mechanisms controlling chromatin accessibility have been of particular interest because of their importance in a wide spectrum of DNA regulation processes. For example, Degner et al. [8] utilized DNaseI hypersensitivity assay coupled with high-throughput sequencing (DNase-seq) to map genome-wide chromatin accessibility to the genotypes across 70 human individuals, for which a previous RNA-sequencing (RNA-seq)-based expression QTL study revealed new insights into the genetic regulation of transcription [5]. In yeast, expression QTL mapping has been performed for the genetic dissection of transcription regulation in a cross between two parental strains of Saccharomyces cerevisiae (BY4716 and RM11-1a) based on DNA microarrays [1291011]. In order to generate a matched dataset of chromatin accessibility for this set of yeast individuals, we carried out Formaldehyde-Assisted Isolation of Regulatory Elements followed by sequencing (FAIRE-seq) for a total of 96 segregants from the cross of BY4716 and RM11-1a [12].
In this study, we sought to dissect the genetic architecture of the regulation of gene expression and chromatin accessibility by analysing previous data generated in yeast and human based on different technical platforms and experimental designs. Our main goal was to find differences in the overall regulatory structure between open chromatin and gene expression. We were also interested to determine whether the two distant species, namely yeast and human, would be different in genetic regulatory architecture and to estimate the effect of the technical or experimental differences in genotyping and measuring the quantitative traits.
Methods
Processing of human genotype data
Genotype data from the HapMap project [13] and 1000 Genomes Project [14] for 70 Yoruba (YRI) lymphoblastoid cell lines were used for DNase-seq analysis [8]. The genotype of each single nucleotide polymorphism (SNP) locus was estimated based on the Bayesian framework by means of the BIMBAM tool [15] and the genotype estimates were made available at http://eqtl.uchicago.edu/dsQTL_data/GENOTYPES/. We first selected 2,157,286 genetic markers (SNPs) with the minor allele frequency greater than 30%. To reduce complexity and ease interpretation, we focused on the genetic variants that can change the function of the protein (non-synonymous SNPs) or the abundance of the protein (SNPs associated with the expression level of a nearby gene). The SIFT tool [16] was used to identify non-synonymous SNPs. We performed expression QTL mapping as described below and identified SNPs that were associated (p < 10-5) in cis (within 200 kb from the nearest gene). Taken together, 7,211 SNPs were identified for QTL mapping.
Processing of human gene expression data
RNA-seq data for 69 YRI lymphoblastoid cell lines [5] were downloaded from http://eqtl.uchicago.edu/RNA_Seq_data/results. A total of 18,147 genes were used after normalization to zero mean and unit variance.
Processing of human chromatin accessibility data
DNase-seq data for 70 YRI lymphoblastoid cell lines [8] were downloaded from http://eqtl.uchicago.edu/dsQTL_data/MAPPED_READS/. Sequence reads from multiple replicates for each sample were combined and F-Seq [17] was run to identify the peaks of the reads from each sample. Statistical significance of the peak was determined by fitting the data to a gamma distribution to obtain the p-value (script obtained from the F-Seq authors). p < 10-3 was used to identify significant peaks from each sample. The overlapping peaks across the YRI individuals were merged into a single peak by using the mergeBED command of BEDTools [18], resulting in a total of 265,130 accessible chromatin regions. For each sample, the number of the DNase-seq reads mapped to each region was counted and the read count was normalized as previously suggested [1920] to obtain normalized chromatin accessibility, which was then further normalized to zero mean and unit variance across the YRI samples. Accessible regions falling on promoters or enhancers were identified based on chromatin annotation by Ernst et al. [21]. A total of 45,781 chromatin regions were found to reside in active promoters, weak promoters, poised promoters, strong enhancers, and weak enhancers annotated in the GM12878 lymphoblastoid cell line.
Processing of yeast data
Genotype and gene expression microarray data [10] used in previous expression QTL studies [129] for >100 segregants from a cross between two parental strains of yeast (BY4716 and RM11-1a) were obtained. As previously suggested [22], adjacent genetic markers with less than three genotypic mismatches across the yeast strains were merged into the average genotype profile, resulting in 1,533 unique markers. We employed the microarray dataset of normalized expression levels of 5,352 genes as previously used [10]. FAIRE experiments were performed based on the published protocol [23]. The FAIRE-seq data for the 96 yeast strains from our previous work [12] is available at the Gene Expression Omnibus (GEO) database with accession number GSE33466. Briefly, we identified open chromatin regions in 96 yeast segregants by means of F-Seq [17]. The overlapping peaks across the 96 strains were merged into a single peak by using BEDTools [18], resulting in a total of 7,527 accessible chromatin regions. For each sample, the number of the FAIRE-seq reads mapped to each region was counted and the read count was normalized as previously suggested [1920] to obtain normalized chromatin accessibility, which was then further normalized to zero mean and unit variance across the 96 segregants.
Trans-QTL analysis
Sixty-three human samples were commonly present in the RNA-seq [5] and DNase-seq [8] data, and 96 yeast segregants in the microarray and FAIRE-seq data. Therefore, we used the common samples for our QTL mapping. Linear regression was carried out leading to 2,100,341 chromatin associations and 975,333 expression associations in human, and 110,802 chromatin linkages and 164,217 expression linkages in yeast at p < 0.01. Genetic markers farther than 200 kb from the nearest gene in human and 100 kb in yeast were identified to examine regulatory relationships acting in trans. For each trait (gene or accessible chromatin region) and regulatory locus (genetic marker), the number of associations or linkages was obtained and divided by the total number of associations at a given p-value.
Results and Discussion
For a systematic comparative analysis of chromatin regulation and transcription regulation, we carried out QTL mapping in a unified analytical framework by applying the identical statistical methods and criteria for open chromatin and gene expression data in yeast and human (Methods and Fig. 1). From the human chromatin accessibility data [8], we selected chromatin sites at the promoter or enhancer (as defined by Ernst et al. [21]). Yeast and human QTL mapping was different in the genetics setting (linkage vs. association) and technical platforms (DNA microarray vs. RNA-seq and FAIRE-seq vs. DNase-seq) (Fig. 1).
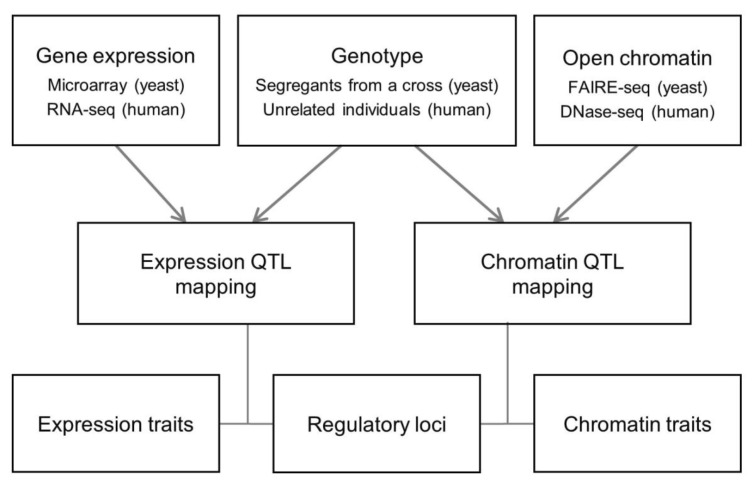
Data analysis scheme. Relationships between the genetic regulatory loci and the quantitative traits (chromatin accessibility or gene expression) were explored in yeast and human. Data from different experimental settings and technical platforms were integrated into a unified analytical framework. RNA-seq, RNA-sequencing; FAIRE-seq, Formaldehyde-Assisted Isolation of Regulatory Elements followed by sequencing; DNase-seq, DNaseI hypersensitivity assay coupled with high-throughput sequencing; QTL, quantitative trait loci.
We selected significant trans-associations based on the p-value of linear regression and then examined the distribution of linkages between regulatory loci (genetic markers) and quantitative traits (gene expression levels or chromatin accessibility). First, there were particular regulatory loci that were associated with a large number of target chromatin traits but not with gene expression traits both in human and yeast (Fig. 2). Second, expression traits than chromatin traits were associated with a greater number of regulatory loci (Fig. 3). This trend was consistently found when varying p-values were used (Fig. 4). Intriguingly, the number of targets for chromatin regulatory loci is more dispersed resulting in outliers with extremely many targets while the average number is lower as compared to the pattern of expression regulatory loci (grey vs. white in the upper panel of Fig. 4). On the other hand, the number of associated regulatory loci was much greater for gene expression traits in terms of the outliers and average as well (grey vs. white in the lower panel of Fig. 4).
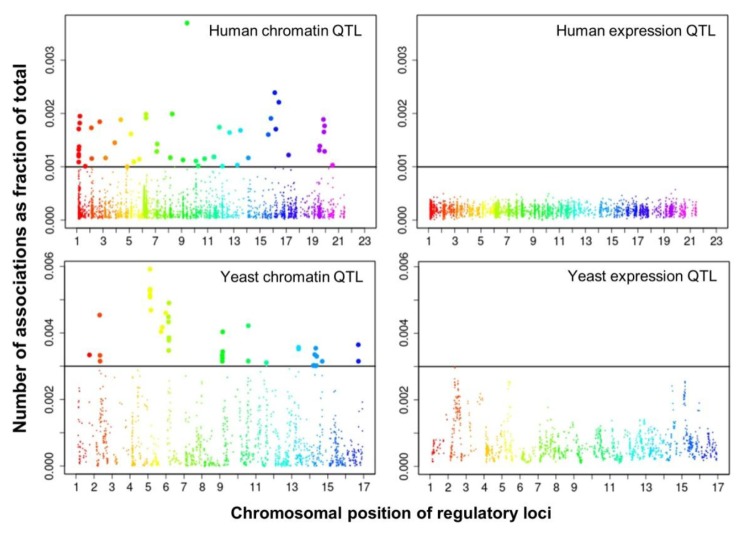
Manhattan plots displaying the chromosomal distribution of regulatory loci and (x axis) and the number of associations for each locus divided by the total number of associations (i.e., percentage on the y axis) at a given p-value in human (p < 0.01) and yeast (p < 0.05). QTL, quantitative trait loci.
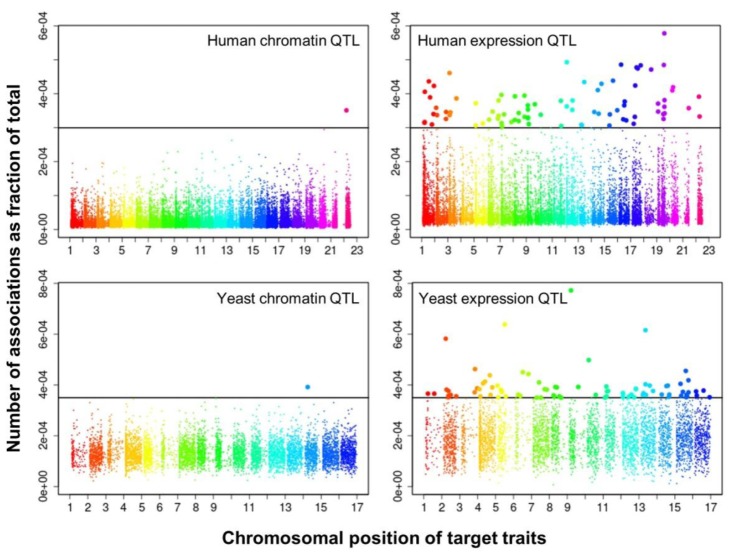
Manhattan plots displaying the chromosomal distribution of target traits (x axis) and the number of associations for each trait divided by the total number of associations (i.e., percentage on the y axis) at a given p-value in human (p < 0.01) and yeast (p < 0.05). QTL, quantitative trait loci.
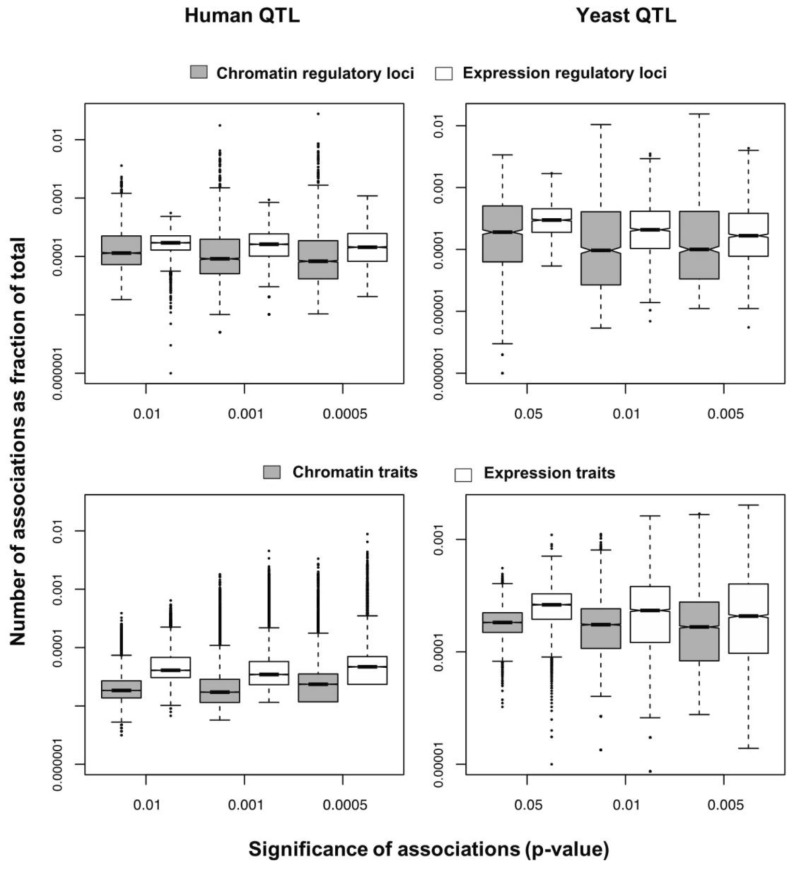
Box plots showing the percentage of associations for each regulatory locus (upper) or quantitative trait (lower) from chromatin quantitative trait loci (QTL) and expression QTL mapping on a log scale in human (left) and yeast (right).
These findings can be interpreted as follows. There are a few regulatory hotspots that are responsible for a large number of chromatin sites. Most regulatory loci, however, tend to influence fewer chromatin traits than gene expression traits. Different biological functions are expected between the promiscuous and specific chromatin regulators. On the other hand, gene expression seems to be more reactive to genetic variation when judged by the number of associated regulatory loci. This may imply that transcription processes receive more regulatory inputs than chromatin regulation, in which case chromatin accessibility may not be a good predictor of precise gene expression levels. There was a remarkable consistency of the data for two evolutionarily distant species across different technical platforms and experimental settings, thereby supporting the biological implications of the findings while ruling out the possibility of technical artifacts.
Based on these findings, we propose that chromatin regulation mechanisms have evolved a stable genetic architecture while the transcription regulatory network maintains high genetic complexity and connectivity and is more susceptible to mutations. First, the lower number of associations per chromatin trait suggests that chromatin structure is more robust to genetic perturbation. On the contrary, gene expression traits have more associations, increasing the probability of targets being associated with mutations. Second, chromatin associations are biased to a handful of loci responsible for an extremely large number of chromatin sites. As long as these hotspot loci are protected from mutations, the perturbation of chromatin regulation architecture could be minimized. In contrast, the average number of associations is high for transcription regulatory loci, increasing the overall effect of single mutations. Given the higher probability of expression traits being associated with mutations and the greater influence of individual mutations on transcription, it is conceivable that phenotypic diversity is more likely to be created in response to genetic variation at the level of transcription processes downstream of chromatin regulation steps.
Acknowledgments
This work was supported by the KAIST Future Systems Healthcare Project and by a grant [2013M3A9C4078139] from the National Research Foundation of Korea. This work was also supported by Brain Pool Program through the Korean Federation of Science and Technology Societies (141S-4-3-0035).