Understanding Rifampicin Resistance in Tuberculosis through a Computational Approach
Article information
Abstract
The disease tuberculosis, caused by Mycobacterium tuberculosis (MTB), remains a major cause of morbidity and mortality in developing countries. The evolution of drug-resistant tuberculosis causes a foremost threat to global health. Most drug-resistant MTB clinical strains are showing resistance to isoniazid and rifampicin (RIF), the frontline anti-tuberculosis drugs. Mutation in rpoB, the beta subunit of DNA-directed RNA polymerase of MTB, is reported to be a major cause of RIF resistance. Amongst mutations in the well-defined 81-base-pair central region of the rpoB gene, mutation at codon 450 (S450L) and 445 (H445Y) is mainly associated with RIF resistance. In this study, we modeled two resistant mutants of rpoB (S450L and H445Y) using Modeller9v10 and performed a docking analysis with RIF using AutoDock4.2 and compared the docking results of these mutants with the wild-type rpoB. The docking results revealed that RIF more effectively inhibited the wild-type rpoB with low binding energy than rpoB mutants. The rpoB mutants interacted with RIF with positive binding energy, revealing the incapableness of RIF inhibition and thus showing resistance. Subsequently, this was verified by molecular dynamics simulations. This in silico evidence may help us understand RIF resistance in rpoB mutant strains.
Introduction
Decades after the discovery of the Mycobacterium tuberculosis (MTB) organism, tuberculosis (TB) remains a major cause of morbidity and mortality in several developing countries. Nearly one-third of the world's population is considered to be infected with MTB infection, with 8.6 million new patients and 1.3 million deaths in the year 2012, including 3,20,000 deaths among human immunodeficiency virus-positive individuals, with around 2.0-2.4 million infected cases of TB in India alone-i.e., 26% of the total burden [1]. Multidrug-resistant strains of this pathogen, emerging in association with human immunodeficiency virus, have added a frightening dimension to the problem [2]. Outbreaks of extensively drug-resistant tuberculosis have also been an increasing threat in certain regions around the world [3]. Most drug-resistant MTB clinical strains are resistant to the frontline anti-TB drugs isoniazid (isonicotinic acid hydrazine) and rifampicin (RIF) [4]. RIF belongs to the rifamycin group and is a bactericidal antibiotic drug introduced in 1963 [5]. It inhibits bacterial DNA-dependent RNA synthesis by inhibiting bacterial DNA-dependent RNA polymerase [6, 7]. It has a complex structure, having a molecular weight 822.95 g/mol and containing an aromatic nucleus (Fig. 1) linked on both sides by an aliphatic bridge [8].

Chemical structure of rifampicin (formula, C43H58N4O12; molecular weight, 822.95 g/mol).
Due to the lipophilic profile of the MTB cell membrane, RIF diffuses easily across it [9]. It inhibits bacterial RNA synthesis by binding to the β subunit of DNA-dependent RNA polymerase, thus blocking RNA transcription [6] by inhibiting RNA chain initiation and elongation [10]. Even though the molecular target of RIF has been well distinguished, the specific mechanism by which it interacts with rpoB to lead to mycobacterial killing remains unclear [8].
RIF resistance is mainly due to mutations in a well-defined, 81-base-pair central region of the rpoB gene [11]. More than 96% of RIF-resistant strains contain a mutation in this 81-bp region of rpoB [12, 13]. The mutation that is most frequently found in clinical isolates of MTB is rpoB S531L. In MTB from countries around the world, rpoB S450L (S531L in the case of Escherichia coli) was identified in 40%-93% of all RIF resistance isolates [14,15,16].The single amino acid mutation at codon 445 (i.e., His to Tyr [CAC/TAC]) of the rpoB gene is also reported to be the most widespread mutation, associated with RIF resistance [17]. The rapid advances in molecular biology and the accessibility of new information generated after whole-genome sequencing of MTB will be useful in understanding the mechanism of RIF resistance. In this study, we explored the interaction of rpoB (both wild and mutant proteins) with RIF through molecular docking analysis.
Methods
Hardware and software
The study was carried out on a Dell Workstation with a 2.26 GHz processor, 6 GB RAM, and 500 GB HDD running in the Windows operating system. Bioinformatics software, such as AutoDock4.2, and online resources were used.
MTB rpoB protein
DNA-directed RNA polymerase beta chain (rpoB), encoded by Rv0667 of MTB, is reported to be directly involved in RIF resistance. The rpoB protein sequence was retrieved from NCBI (http://www.ncbi.nlm.nih.gov/).
Protein structure prediction and validation of rpoB
Protein Homology/Analogy Recognition Engine (Phyre2) server [18] was used for modeling the three-dimensional structure of rpoB. Phyre2 is an automatic fold recognition server that predicts the three-dimensional structure of a protein sequence using the principles and techniques of homology modeling. The Phyre is widely used by the biological community, with more than 150 submissions per day [18]. The Phyre2 server was publicly released in February 2011 as a replacement for the original Phyre server and provides extra functionality over Phyre, a more advanced interface, and a fully updated fold library and uses the HHpred/HHsearch package for homology detection. Two mutants of rpoB (S450L and H445Y) were generated using Modeller9v10 [19]. Structural refinement and energy minimization of the predicted models were carried out using the Yet Another Scientific Artificial Reality Application (YASARA) Energy Minimization Server [20]. The refined model reliability was assessed through Procheck [21], ProSA-web [22], and ProQ [23].
Ligand preparation
The ligand RIF used in this study against rpoB was retrieved from the PubChem database [24] in mol2 format, and the PyMol molecular graphics system (http://www.pymol.org) was used to convert it into PDB format.
Protein-ligand docking
Protein-ligand docking studies were performed using the AutoDock 4.2 program [25]. It is one of the most widely used methods for protein-ligand docking. All pre-processing steps for the ligand and protein files were performed using the AutoDock Tools 1.5.4 program (ADT), which has been released as an extension suite to Python Molecular Viewer [25]. The ADT program was used to prepare the receptor molecule (rpoB) by adding all hydrogen atoms to the receptor, and Kollman charges were also assigned. For docked ligands, non-polar hydrogens were also added. Gasteiger charges were assigned, and torsional degrees of freedom were allocated by the ADT program.
The Lamarckian genetic algorithm (LGA) was applied to model the interaction pattern between the receptor and ligand. The grid maps representing the receptor proteins in the docking process were calculated using AutoGrid (part of the AutoDock package). A grid of 50, 50, and 50 points in the x, y, and z directions was centered on the known active site residues of rpoB protein. For all docking procedures, 10 independent genetic algorithm runs with a population size of 150 were considered for each molecule under study. A maximum number of 25 × 105 energy evaluations; 27,000 maximum generations; a gene mutation rate of 0.02, and a crossover rate of 0.8 were used for the LGA. The AutoDock program was run in order to prepare the corresponding docking log (DLG) file for further analysis.
Molecular dynamic simulations of the rpoB-RIF complex
The docking complexes of RIF with wild and mutant (S450L) rpoB were subjected to molecular dynamic (MD) simulation using the GROMACS 4.6.3 [26] simulation packages, employing the gromos54A7 all-atom force field, as this particular mutant has more impact on drug resistance than H445Y. The protein was protonated at default pH, and the ligand topology was generated by the PRODRG server [27]. Then, the complexes were solvated by explicit SPC/E (extended simple point charge) water model [28] in cubic boxes with a minimum edge distance of 7 Å from the box. Both systems were neutralized electrically by adding 0.10 mM NaCl. Both systems had been relaxed through steepest descent energy minimization, followed by temperature (NVT-constant number of particles, volume and temperature) and pressure (NPT-constant number of particles, pressure and temperature) equilibrium for 100 ps each. The NVT was performed at 300 K with position restraints applied to all of the backbone atoms, and during NPT, all of these restraints were removed. All bond lengths were constrained using the linear constraint solver (LINCS) algorithm [29]. For the temperature and pressure coupling, the velocity rescale thermostat [30] and isotropic Parrinello-Rahman barostat [31] were applied, respectively. For the calculation of long-range electrostatic interactions, Particle Mesh Ewald (PME) was used with a fourth-order spline interpolation and 0.15-nm Fourier grid spacing [32]. The short-range non-bonded van der Waals and Coulombic interactions were considered between particles within 12 Å of cutoff distance. During the production run, all of these protocols were followed along with the temperature coupling at 323 K using the velocity rescale thermostat with a coupling time constant of (τT) of 0.8 ps and pressure coupling by the Parrinello-Rahman barostat at 1 bar, via a coupling constant of τP = 2 ps with compressibility at 0.000045/bar. Snapshots of the trajectory were taken every 2 ps, and the Microsoft Excel program was used for preparation of the graph.
Visualization
The visualization of the structure files was done using the graphical interface of the ADT tool and the PyMol molecular graphics system (http://www.pymol.org).
Results and Discussion
RpoB of MTB, encoded by Rv0667, has 1172 amino acids in its protein sequence, while E. coli rpoB has 1342. The S531L and H526Y mutations are based on the protein sequence of E. coli rpoB protein. Upon sequence comparison using ClustalW [33] of rpoB protein in both species, it was found that in MTB, the mutation occurred at codon positions 450 (S450L) and 445 (H445Y) as compared to E. coli (Fig. 2).
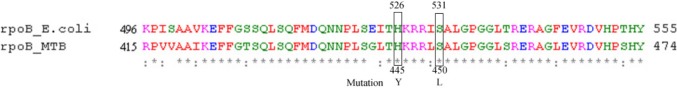
Sequence alignment of rpoB protein of Escherichia coli and Mycobacterium tuberculosis (MTB) with the respective codon position and reported amino acid substitution.
Validation of model
Since the three-dimensional structure of rpoB of MTB was still not available, its structure model was predicted using the Phyre2 server by taking chain C of DNA-directed RNA polymerase subunit beta from E. coli (PDB ID, 3LU0) [34] as the structural template. The query coverage of the target-template alignment was 91% with 100.0% confidence by the single highest-scoring template. The predicted structure was then subjected to the YASARA Energy Minimization Server for structural refinement. The total energy for the refined structure obtained from the YASARA Energy Minimization Server was -130,601.7 kcal/mol (score, -2.60),whereas prior to energy minimization, it was 359,868,668,000.6 kcal/mol (score, -4.20).
The stereochemistry of the refined model (Procheck analysis) revealed that 87.1% of residues were situated in the most favorable region, and 12.3% was in additional and generously allowed regions, whereas only 0.5% of residues fell in the disallowed region of the Ramachandran plot (Fig. 3A). The ProSA-web evaluation revealed a compatible Z score (Fig. 3D) value of -12.3, which is well within the range of native conformations of crystal structures [22]. The overall residue energies of the rpoB 3D model were largely negative, except for a few peaks. The 3D model of rpoB showed a Levitt-Gerstein (LG) score of 4.065 by the Protein Quality Predictor (ProQ) tool, implying a high accuracy level of the predicted structure. A ProQ LG score > 4.0 is necessary for suggesting that a model has extremely good quality [23].
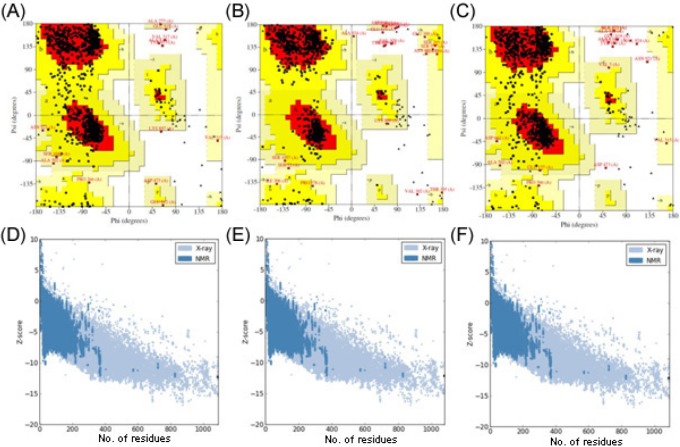
(A) Ramachandran plot of predicted rpoB model. (B) Ramachandran plot of predicted rpoB (S450L). (C) Ramachandran plot of predicted rpoB (H445Y) mutant models. (D) Zplot of rpoB. (E) Zplot of rpoB (S450L) model. (F) Zplot of rpoB (H445Y). ProSA-web Z-scores of all protein chains in PDB, determined by X-ray crystallography and nuclear magnetic resonance (NMR) spectroscopy, with respect to their length. The Z-score of rpoB and its mutants were present in that range, represented as black dots.
The single amino acid mutation at codon 450 (i.e., Ser to Leu [TCG to TTG]) and at codon 445 (i.e., His to Tyr [CAC/TAC]) of the rpoB gene is reported to be the most widespread mutation, associated with RIF resistance [17]. Thus, mutant models of rpoB (S450L and H445Y) were generated and subjected to validation.
The stereochemistry of the rpoB (S450L) model (Procheck analysis) revealed that 89.3% of residues were situated in the most favorable region, and 9.9% was in additional allowed and generously allowed regions, whereas only 0.8% of residues fell in the disallowed region of the Ramachandran plot (Fig. 3B). In the case of the rpoB (H445Y) model, 87.5% of residues were found in the most favorable region, and 11.6% was in additional and generously allowed regions; only 0.9% of residues fell in the disallowed region (Fig. 3C). The ProSA-web evaluation revealed a compatible Z score value of around -12.1 for both rpoB mutant models (i.e., S450L and H445Y) (Fig. 3E and 3F), which is well within the range of native conformations of crystal structures [22]. The overall residue energies of the rpoB 3D model were largely negative, expect for a few peaks. The 3D model of both mutants showed an LG score of more than 4.1 by the ProQ tool, implying a high accuracy level of the predicted structure. A ProQ LG score > 4 is necessary for suggesting that a model has extremely good quality [23].
Docking analysis of rpoB and RIF
On the basis of the modeled structure of rpoB (Fig. 4A), three-dimensional structures of the two mutants were obtained. The protein (rpoBs)-ligand (RIF) analysis was performed using AutoDock4.2 software [25]. Out of the 10 poses obtained, the best ligand pose was selected based on the lowest binding energy confirmation. As the amino acid (serine at 450 and histidine at 445) position of rpoB was reported to undergo mutation in most of the RIF resistance strains, the docking of RIF was performed around these amino acid positions. Upon docking, RIF interacts with the wild-type rpoB protein (Fig. 4B) with a binding energy of -4.96 kcal/mol and inhibition constant of 231.21 µM, whereas in the case of the rpoB (S450L) and rpoB (H445Y) mutants, the binding energies were found to be 8.38 kcal/mol and 3.91 kcal/mol, respectively, with no inhibition constants predicted, which revealed RIF resistance in the mutant proteins.
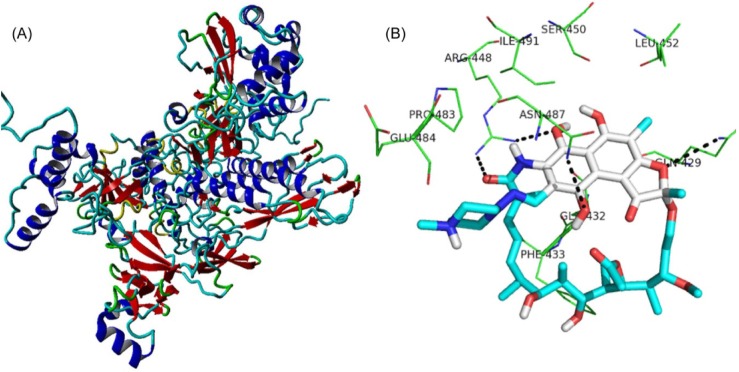
(A) 3D structure of predicted rpoB model. (B) Docking interaction of rifampicin with rpoB enzyme (with binding energy of -4.96 kcal/mol), showing hydrogen bonds as dotted lines.
MD simulation studies of the rpoB and RIF complex
A ligand binding interaction always influences the stability of the receptor protein. It was shown in Fig. 5A that the Root Mean Square Deviation (RMSD) graph of wild-type rpoB lies a bit down than the S450L mutant during most of the time scale. The same was also observed in the Root Mean Square Fluctuation (RMSF) plot (Fig. 5D), where most interacting amino acids of wild-type rpoB that participate in the interaction with RIF fluctuate less comparatively. This justifies that the sustainability of the rpoB-RIF interaction and wild-type rpoB is more acceptable over the mutant. We also calculated the average number of hydrogen bonds and their occurrence between the receptor and ligand in both cases and found that in the case of wild-type rpoB, the protein formed more consistent numbers of H-bonds with the ligand (Fig. 5B) as a consequence of a good interaction. Most importantly, these bindings were also described via interaction energies (IEs). The sum of short-range Coulombic and van der Waals interaction energies, taken as the total interaction energy between the protein and ligand, was plotted in Fig. 5C. This plot clearly indicates a big difference in IEs between the two complexes, and the wild-type rpoB possesses comparatively less interaction energy and hence shows more affinity towards RIF.
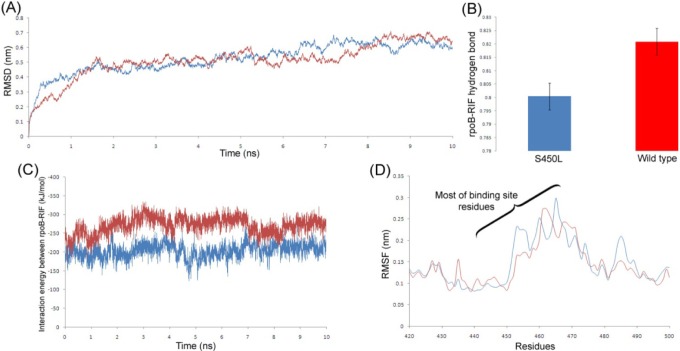
(A) Root Mean Square Deviation plot of rpoB wild-type and S450L mutant. (B) Occurrence of hydrogen bonds between rpoB and rifampicin (RIF) throughout the simulation with standard deviation. (C) Interaction energy profile between rpoB and RIF. (D) Root Mean Square Fluctuation plot comparison of wild-type and S450L mutant near the binding site region. Red and blue are used for the wild-type and S450L mutant, respectively.
Brandis and Hughes [15] created the rpoB S531L mutation in Salmonella which is also present in other location of MTB and demonstrated that the minimum inhibitory concentration value of RIF for rpoB S531L mutant was 3,000 mg/L, whereas for the wild-type, it was only 12 mg/L [15]. This correlates with our in silico docking and MD simulation study-that mutant proteins with positive binding energy bind ineffectively with RIF compared to wild-type protein and thus may require high concentrations of RIF for inhibition.
We have employed a computational approach to study the interaction between RIF and rpoB and its mutant models. Our in silico docking study revealed that mutation in rpoB at amino acid positions 450 (S450L) and 445 (H445Y) might be involved in drug resistance. In wild-type rpoB, the RIF binds more effectively with rpoB with low binding energy and thus inhibits rpoB protein. Other mutations in rpoB need to be explored further for understanding the resistance mechanism.
Acknowledgments
The authors express their gratitude to the Department of Biotechnology, MoS&T, Government of India, for their financial support to the Bioinformatics Centre, where this study was carried out. We are grateful to Shri D.S. Mehta, President, Kasturba Health Society; Dr. B.S. Garg, Secretary, Kasturba Health Society; Dr. K. R. Patond, Dean, MGIMS; Dr. S.P. Kalantri, Medical Superintendent, Kasturba Hospital, MGIMS, Sevagram, and Dr. B.C. Harinath, Director, JBTDRC & Coordinator, Bioinformatics Centre, for their encouragement and support.