Epidemiological and Genome-Wide Association Study of Gastritis or Gastric Ulcer in Korean Populations

Article information

Genomics Inform. 2014;12(3):127-133
Publication date (electronic) : 2014 September 30
doi : https://doi.org/10.5808/GI.2014.12.3.127
Department of Nanobiomedical Science, Dankook University, Cheonan 330-714, Korea.
Corresponding author: Tel: +82-41-550-3484, Fax: +82-41-550-1149, sejongoh@dankook.ac.kr
Received 2014 June 30; Revised 2014 August 06; Accepted 2014 August 12.

Abstract

Gastritis is a major disease that has the potential to grow as gastric cancer. Gastric cancer is a very common cancer, and it is related to a very high mortality rate in Korea. This disease is known to have various reasons, including infection with Helicobacter pylori, dietary habits, tobacco, and alcohol. The incidence rate of gastritis has reported to differ between age, population, and gender. However, unlike other factors, there has been no analysis based on gender. So, we examined the high risk factors of gastritis in each gender in the Korean population by focusing on sex. We performed an analysis of 120 clinical characteristics and genome-wide association studies (GWAS) using 349,184 single-nucleotide polymorphisms from the results of Anseong and Ansan cohort study in the Korea Association Resource (KARE) project. As the result, we could not prove a strong relation with these factors and gastritis or gastric ulcer in the GWAS. However, we confirmed several already-known risk factors and also found some differences of clinical characteristics in each gender using logistic regression. As a result of the logistic regression, a relation with hyperlipidemia, coronary artery disease, myocardial infarction, hyperlipidemia therapy, hypotensive or antihypotensive drug, diastolic blood pressure, and gastritis was seen in males; the results of this study suggest that vascular disease has a potential association with gastritis in males.

Introduction

Gastric cancer is a common cancer type. In the world, this cancer type has the second highest incidence among males and third highest among females [1]. In Korea, the incidence rate of gastric cancer was second highest, and the mortality rate of gastric cancer was third highest among all cancer types in a 2010 Korean cancer statistics study [2].

The incidence rate of gastric cancer differs between patient age, location, and even sex [3], because gastric cancer has various subtypes [3, 4] and a lot of risk factors [5]. Helicobacter pylori is known for having a relation with gastric cancer [6]. Almost all gastric cancer patients are infected with H. pylori [3]. As known before, dietary habits also have the potential to affect gastric cancer [1]. The incidence risk factors have differences in gastric cancer or peptic ulcers by blood type [7] and sex [8]. Gastric cancer type also depends on patient populations or race [5]. So, an analysis is needed to find known and unknown risk factors in diverse phenotypes [3]. Gastritis is related with gastric cancer. Chronic gastric inflammation has the potential to grow into gastric cancer [9].

Many risk factors are related with gastritis, as already reported. However, even though gender is known to be associated with gastritis infraction, there is not much information about the effects on gastritis depending on gender. So, we examined Korean risk factors of gastritis and gastric ulcer using genotypes and clinical characteristics of patients who were diagnosed with gastritis or gastric ulcer in each gender. For revealing the correlation with gastritis and known and unknown risk factors, we analyzed single-nucleotide polymorphisms (SNPs) and epidemiological data of the Korea Association Resource (KARE) project, which comprised the results of the Anseong and Ansan cohorts study.

Methods

Clinical characteristics and study genotypes

This study analyzed cohort data that comprised the Anseong and Ansan population study in the KARE projects. Anseong is a rural area, and Ansan is a city. Both areas are in Gyeonggi-do. Citizen of these two cities have different lifestyles, and they are exposed to different environment. Detailed information of the KARE data was reported [10]. The KARE data included 8,842 individuals, 352,228 SNPs, and 277 phenotypes.

Among 8,842 total individuals, we divided patients and normal subjects for a control and case study using a positive diagnosis experience of gastritis. There were 1,885 patients and 6,957 normal subjects. First, for selecting the case, we eliminated 104 patients who were diagnosed under age 20 or had unknown age. Then, 1,781 patients remained. Of these, 804 patients were men, and 977 patients were women. Of 6,957 normal subjects, no one was aged under 20; 3,335 were men, and 3,622 were women.

Among 352,228 SNPs, we excluded 3,044 SNPs based on the Hardy-Weinberg equilibrium test for quality control. After frequency and genotyping pruning, 349,184 SNPs remained.

Among 277 total phenotypes, we filtered missing phenotypes and low genotyping rates. Then, 120 clinical characteristics remained. We also eliminated gastritis phenotype variables and unknown drug information variables; 101 clinical characteristics remained.

Statistical analysis

For data filtering and finding significant SNPs, we used PLINK version 1.07, that is a tool made for analyzing whole-genome association using computational methods [11]. We used the default options of PLINK [11], and we analyzed phenotypes by logistic regression test for classifying patients and normal subjects and estimating factors. We also assessed the result factors of the logistic regression by Student's t-test for revealing meaningful differences between patients and normal subjects using R version 3.0.2 for finding gastritis-associated factors. Then, we used the receiver operating characteristic (ROC) curve and area under the curve (AUC) scores to confirm the prediction ability of the factors.

Results

Clinical characteristics

Tables 1 and 2 explain the results of the logistic regression test among total clinical characteristics in each gender. There were differences in gender-specific clinical characteristics. Among 1,781 total patients, 977 patients and 804 patients were male and female, respectively. Patients had several disease-association factors in both genders: area, positive diagnosis of hyperlipidemia, positive diagnosis of mental disease, continual use of one or more drugs, waist, and height.

Clinical characteristics of gastritis variables in male

Clinical characteristics of gastritis variables in female

Through previous studies, how these factors are related with gastritis was verified.

The incidence of gastritis is affected by population, geographic variation, or lifestyle [1, 5]. In this study, we used cohort data that comprised country and city populations. As shown Tables 1 and 2, in both genders, the population of local A had a higher gastritis incidence rate. This means that differences in patient lifestyle and environment affect the disease incidence rate.

It is well known that stress has an influence on carcinogenesis. A study reported that gastritis is closely connected with mental illness [12] and differs in degree according to drug use-taking medicine affects the stomach. Nonsteroidal anti-inflammatory drugs can cause gastrointestinal damage [13].

Losing appetite is the one of phenotypes of gastritis that are connected with waist size or hip size as gastritisassociated factors. However, definite evidence is lacking [14]. As shown in Tables 1 and 2, we can explain the associative relation that waist size or hip size is smaller despite patients being taller than normal. Also, height is considered to be a gastritis risk factor. As shown in a previous study, higher height tends to increase the gastric cancer incidence rate [15].

In males and females, hyperlipidemia and gastritis are related with gastritis. Only male cases are associated with vascular disease. Coronary artery has the potential to grow into myocardial infarction [16], and myocardial infarction is related with blood pressure [17]. As previously reported, approximately 30% of patients with coronary heart disease suffer from hyperlipidemia at the same time [18]. So, hyperlipidemia, coronary artery, and myocardial infarction are all related to each other. As shown in Table 1, in males, by logistic regression, there is a relation with hyperlipidemia, coronary artery, myocardial infarction, hyperlipidemia therapy, hypotensive or antihypotensive drug use, and diastolic blood pressure. This relation is more remarkable in males than in females. Repeatedly, it can be considered that vascular disease is connected with gastritis. In fact, in this study, including males and females, 16 patients had gastritis and myocardial infarction (20%), 77 patients had gastritis and hyperlipidemia (36%), and 13 patients had gastritis and coronary artery (25.5%).

Female patients with gastritis have 4 more gastritis-associated factors by logistic regression test compared with males. In the case of taking osteoporosis medicine, the incidence rate is 1.7 times higher compared with normal. Taking anticonvulsants is a meaningful factor by logistic regression test, but few patients were taking this medicine [4]; so, it is hard to prove that taking anticonvulsants has a positive relation with gastritis. Patients who were diagnosed with tuberculosis and patients who have taken tuberculosis drugs suffer gastritis more than normal subjects. This gives information on the relation between gastritis and tuberculosis in females.

ROC curves can show how gastritis-associated factors of Tables 1 and 2 affect gastritis patients and normal subjects. Whether these factors are conclusive should be confirmed by AUC values. Figs. 1 and 2 are ROC curves using the result of the logistic regression test of Tables 1 and 2, respectively. Each AUC value is 0.697 and 0.687. This result means that these factors are not useful as gastric-specific markers.
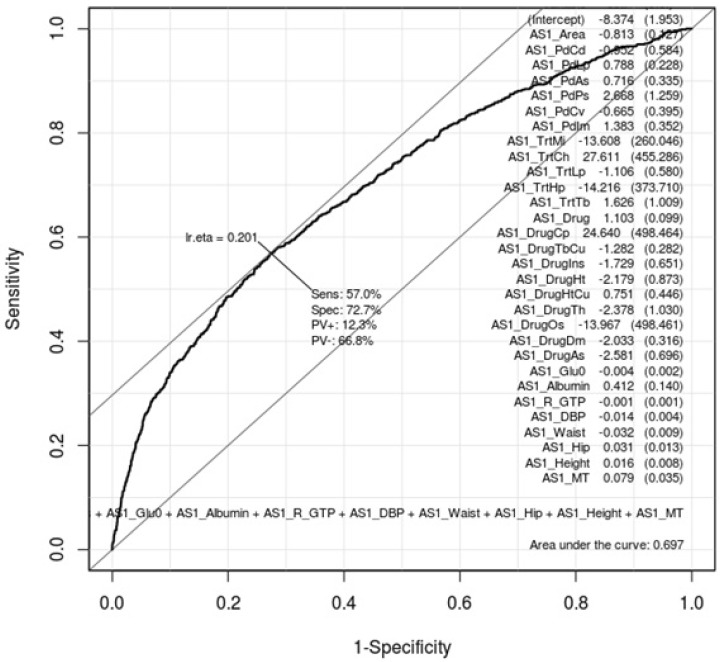
Fig. 1

Receiver operating characteristic (ROC) curve of gastritis-associated factors in males. This shows how well the 22 gastritis-associated clinical characteristic factors (Table 1) classify patients and normal subjects in males. As much as the ROC curve, these factors can classify gastritis patients and normal subjects in males.
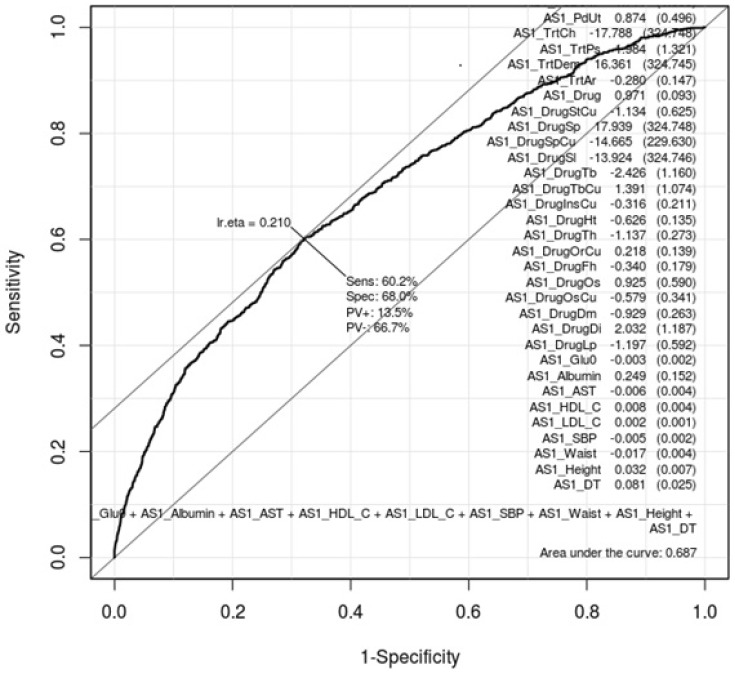
Fig. 2

Receiver operating characteristic (ROC) curve of gastritis-associated factors in females. This shows how well the 26 gastritis-associated clinical characteristic factors (Table 2) classify patients and normal subjects in females. As much as the ROC curve, these factors can classify gastritis patients and normal subjects in females.

Genome-wide association studies

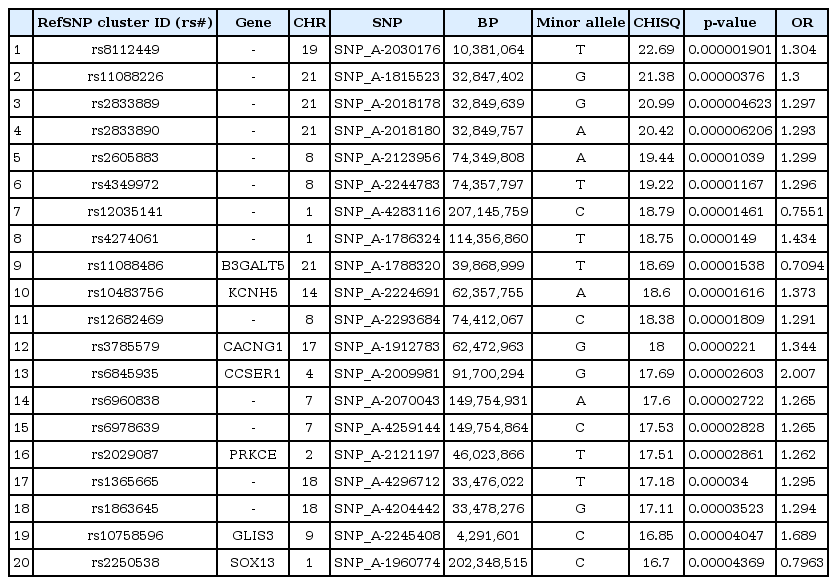
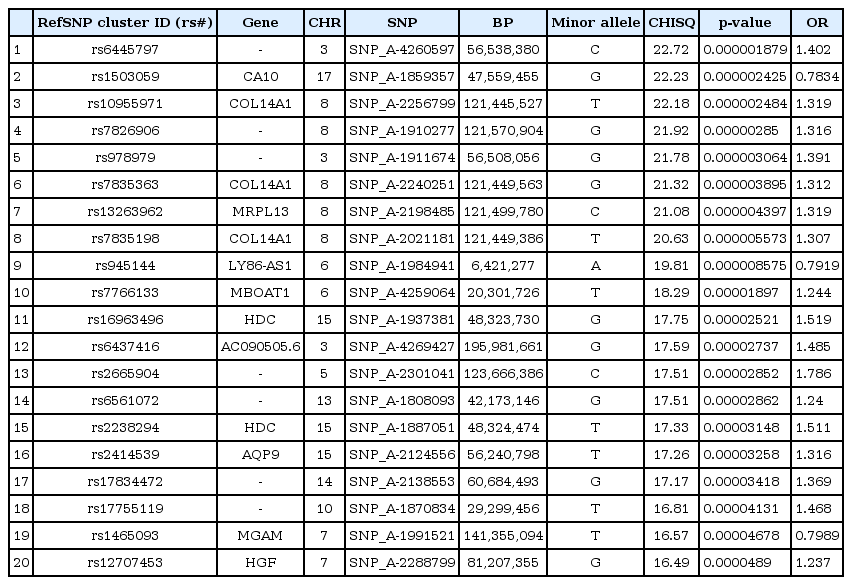
We selected the top 20 ranked SNPs by association test using chi-square test and p-values among 349,184 SNPs in males and in females, respectively. The results of SNPs association analysis described in Tables 3 and 4. Tables 3 and 4 are top 20 ranked SNPs of genomewide association analysis in males and females, respectively. They are sorted by P-value. But there was no considerable SNP associated with gastritis. Astonishingly, there was no common SNP between males and females. This means that associated-SNPs are different, depending on the patient's gender.

Top 20 ranked SNPs of genomewide association analysis in males

Top 20 ranked SNPs of genomewide association analysis in females

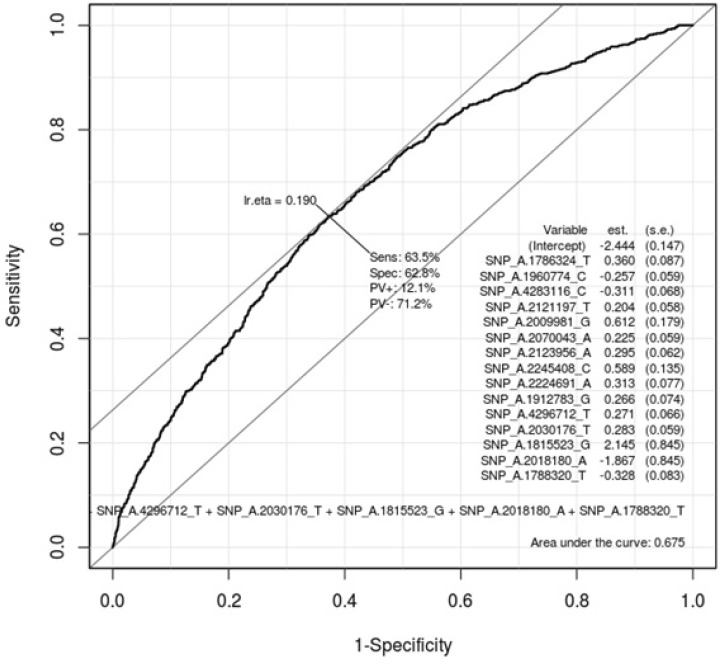
Table 5 describes the important SNPs associated with gastritis by logistic regression analysis among the top 20 ranked SNPs. The p-values of these SNPs were all <0.001. Figs. 3 and 4 show the ROC curve by using these SNPs in males and in females, respectively. The AUC scores are 0.675 and 0.658 in males and in females, respectively. The AUC score was too low to use as a specific factor for diagnosis.
Gastritis-associated single-nucleotide polymorphisms

Fig. 3

Receiver operating characteristic (ROC) curve of gastritis-associated single-nucleotide polymorphisms (SNPs) in males. This shows how well 20 ranked gastritis-associated SNPs (Table 3) classify patients and normal subjects in males. As much as the ROC curve, these factors can classify gastritis patients and normal subjects in males.
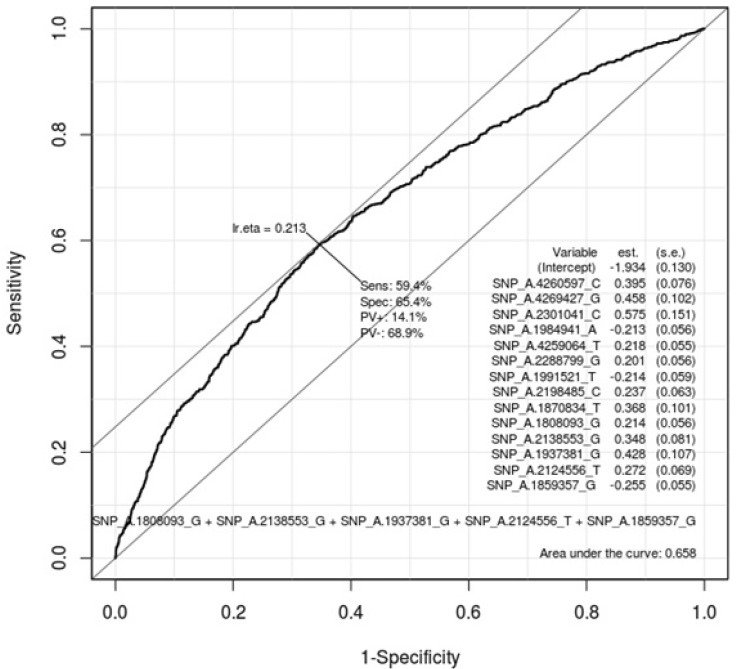
Fig. 4

Receiver operating characteristic (ROC) curve of gastritis-associated single-nucleotide polymorphisms (SNPs) in females. This shows how well 20 ranked gastritis-associated SNPs (Table 4) classify patients and normal subjects in females. As much as the ROC curve, these factors can classify gastritis patients and normal subjects in females.

Discussion

In this study, we confirmed that vascular disease and gastritis have considerable association in Korean males. We also verified that gastritis is affected by other various drugs. However, we could not find gastritis-specific biomarkers for diagnosis.

Gastritis has numerous causes and is distributed as variable subtypes by phenotype. So, correctly diagnosing it is very important for therapy. Gastritis has non-specific phenotypes that can obscure finding the disease causes. So, more information is also needed to analyze the complex factors associated with disease rather than each factor associated with the disease. For example, confirmation of H. pylori infection, tobacco, smoking period, and alcohol intake are considered. This needs further study.

Acknowledgments

This work was supported by grants from the Korea Centers for Disease Control and Prevention, Republic of Korea (4845-301, 4851-302, 4851-307).

References

1. Dikshit RP, Mathur G, Mhatre S, Yeole BB. Epidemiological review of gastric cancer in India. Indian J Med Paediatr Oncol 2011;32:3–11. 21731209.
2. Jung KW, Won YJ, Kong HJ, Oh CM, Seo HG, Lee JS. Cancer statistics in Korea: incidence, mortality, survival and prevalence in 2010. Cancer Res Treat 2013;45:1–14. 23613665.
3. Kim SJ, Baik GH, Youn KH, Song SW, Kim DJ, Kim JB, et al. The crude incidence rate of stomach cancer in Chuncheon-si during 2000-2002. Korean J Med 2007;73:368–374.
4. Strickland RG. Gastritis. Springer Semin Immunopathol 1990;12:203–217. 2205940.
5. Crew KD, Neugut AI. Epidemiology of gastric cancer. World J Gastroenterol 2006;12:354–362. 16489633.
6. Baik SJ, Yi SY, Park HS, Park BH. Seroprevalence of Helicobacter pylori in female Vietnamese immigrants to Korea. World J Gastroenterol 2012;18:517–521. 22363117.
7. Edgren G, Hjalgrim H, Rostgaard K, Norda R, Wikman A, Melbye M, et al. Risk of gastric cancer and peptic ulcers in relation to ABO blood type: a cohort study. Am J Epidemiol 2010;172:1280–1285. 20937632.
8. Song HR, Shin MH, Kim HN, Piao JM, Choi JS, Hwang JE, et al. Sex-specific differences in the association between ABO genotype and gastric cancer risk in a Korean population. Gastric Cancer 2013;16:254–260. 22865192.
9. Kim YJ, Chung JW, Lee SJ, Choi KS, Kim JH, Hahm KB. Progression from chronic atrophic gastritis to gastric cancer; tangle, toggle, tackle with Korea red ginseng. J Clin Biochem Nutr 2010;46:195–204. 20490314.
10. Cho YS, Go MJ, Kim YJ, Heo JY, Oh JH, Ban HJ, et al. A large-scale genome-wide association study of Asian populations uncovers genetic factors influencing eight quantitative traits. Nat Genet 2009;41:527–534. 19396169.
11. Purcell S, Neale B, Todd-Brown K, Thomas L, Ferreira MA, Bender D, et al. PLINK: a tool set for whole-genome association and population-based linkage analyses. Am J Hum Genet 2007;81:559–575. 17701901.
12. Verhaak PF. Somatic disease and psychological disorder. J Psychosom Res 1997;42:261–273. 9130183.
13. Allison MC, Howatson AG, Torrance CJ, Lee FD, Russell RI. Gastrointestinal damage associated with the use of nonsteroidal antiinflammatory drugs. N Engl J Med 1992;327:749–754. 1501650.
14. Forman D, Burley VJ. Gastric cancer: global pattern of the disease and an overview of environmental risk factors. Best Pract Res Clin Gastroenterol 2006;20:633–649. 16997150.
15. Emerging Risk Factors Collaboration. Adult height and the risk of cause-specific death and vascular morbidity in 1 million people: individual participant meta-analysis. Int J Epidemiol 2012;41:1419–1433. 22825588.
16. Ambrose JA, Tannenbaum MA, Alexopoulos D, Hjemdahl-Monsen CE, Leavy J, Weiss M, et al. Angiographic progression of coronary artery disease and the development of myocardial infarction. J Am Coll Cardiol 1988;12:56–62. 3379219.
17. Madhavan S, Ooi WL, Cohen H, Alderman MH. Relation of pulse pressure and blood pressure reduction to the incidence of myocardial infarction. Hypertension 1994;23:395–401. 8125567.
18. Goldstein JL, Hazzard WR, Schrott HG, Bierman EL, Motulsky AG. Hyperlipidemia in coronary heart disease. I. Lipid levels in 500 survivors of myocardial infarction. J Clin Invest 1973;52:1533–1543. 4718952.

Article information Continued

Fig. 1

Receiver operating characteristic (ROC) curve of gastritis-associated factors in males. This shows how well the 22 gastritis-associated clinical characteristic factors (Table 1) classify patients and normal subjects in males. As much as the ROC curve, these factors can classify gastritis patients and normal subjects in males.

Fig. 2

Receiver operating characteristic (ROC) curve of gastritis-associated factors in females. This shows how well the 26 gastritis-associated clinical characteristic factors (Table 2) classify patients and normal subjects in females. As much as the ROC curve, these factors can classify gastritis patients and normal subjects in females.

Fig. 3

Receiver operating characteristic (ROC) curve of gastritis-associated single-nucleotide polymorphisms (SNPs) in males. This shows how well 20 ranked gastritis-associated SNPs (Table 3) classify patients and normal subjects in males. As much as the ROC curve, these factors can classify gastritis patients and normal subjects in males.

Fig. 4

Receiver operating characteristic (ROC) curve of gastritis-associated single-nucleotide polymorphisms (SNPs) in females. This shows how well 20 ranked gastritis-associated SNPs (Table 4) classify patients and normal subjects in females. As much as the ROC curve, these factors can classify gastritis patients and normal subjects in females.

Table 1.

Clinical characteristics of gastritis variables in male

Total Description Control (n = 3,379) Case (n = 804) t-test
AS1_Age Age 51.83 ± 8.85 51.58 ± 8.52 4.70E-001
AS1_Area Area 1,403 (41.5) 406 (50.5) 5.00E-006
AS1_PdCd Positive diagnosis experience of coronary artery disease 25 (0.7) 4 (0.5) 0.5303
AS1_PdLp Positive diagnosis experience of hyperlipidemia 84 (2.5) 38 (4.7) 0.003968
AS1_PdPs Positive diagnosis experience of mental disease 1 (0.03) 4 (0.5) 0.0379
AS1_PdIm Positive diagnosis experience of erectile dysfunction 21 (0.6) 21 (2.6) 0.0004339
AS1_TrtLp Hyperlipidemia therapy 17 (0.5) 4 (0.5) 0.09085
AS1_TrtHp Hepatitis therapy 5 (0.1) 0 (0) 0.09239
AS1_TrtTb Tuberculosis therapy 6 (0.2) 2 (0.3) 0.07514
AS1_Drug Continual use of one or more drugs 983 (29.1) 363 (45.1) 2.20E-016
AS1_DrugCp Oral contraceptive drug-taking experience 3,171 (93.8) 778 (96.8) 9.94E-005
AS1_DrugTbCu Continual use of tuberculosis drug 6 (0.2) 2 (0.2) 0.3127
AS1_DrugIns Insulin drug-taking experience 36 (1.1) 3 (0.4) 0.005567
AS1_DrugHt Hypotensive or antihypotensive drug-taking experience 332 (9.8) 76 (9.5) 0.07174
AS1_DrugHtCu Continual use of hypotensive of antihypotensive drug 295 (8.7) 72 (9.0) 0.9601
AS1_DrugDm Diabetes drug taking experience 165 (4.9) 13 (1.6) 0.7207
AS1_Albumin Degree of albumin 4.34 ± 0.37 4.34 ± 0.36 0.7188
AS1_DBP Diastolic blood pressure (mm Hg) 82.17 ± 11.0 80.38 ± 10.56 2.06E-005
AS1_Waist Waist size (cm) 83.89 ± 7.75 82.78 ± 8.19 0.0005079
AS1_Hip Hip size (cm) 93.62 ± 6.63 93.03 ± 6.54 0.02187
AS1_Height Height (cm) 166.85 ± 5.84 167.18 ± 5.77 0.1432
AS1_MT Midshaft tibia T bone density (standard deviation) 0.12 ± 1.22 0.27 ± 1.89 0.001048

Values are presented as mean ± standard deviation or number (%).

Table 2.

Clinical characteristics of gastritis variables in female

Total Description Control (n = 3,682) Case (n = 977) t-test
AS1_Age Age 51.83 ± 8.85 51.58 ± 8.5 9.79E-007
AS1_Area Area 1,880 (51.1) 516 (52.8) 0.329
AS1_PdAl Positive diagnosis experience of allergy 875 (23.8) 102 (10.4) 5.02E-006
AS1_PdLp Positive diagnosis experience of hyperlipidemia 63 (1.7) 31 (3.2) 0.009013
AS1_PdCl Positive diagnosis experience of chronic obstructive pulmonary disease 15 (0.4) 2 (0.2) 0.4173
AS1_PdKd Positive diagnosis experience of renal disease 108 (2.9) 55 (5.6) 0.0005104
AS1_PdHp Positive diagnosis experience of hepatitis 87 (2.4) 46 (4.7) 0.0009411
AS1_PdTb Positive diagnosis experience of tuberculosis 123 (3.3) 49 (5.0) 0.02303
AS1_PdPs Positive diagnosis experience of mental disease 27 (0.7) 9 (0.9) 0.4748
AS1_PdDem Positive diagnosis experience of dementia 0 (0) 1 (0.1) 0.9094
AS1_PdUt Positive diagnosis experience of urinary tract infection 10 (0.3) 9 (0.9) 0.03397
AS1_TrtPs Mental disease therapy 1 (0.03) 2 (0.2) 0.0003288
AS1_TrtDem Dementia therapy 0 (0) 1 (0.1) 0.0003688
AS1_Drug Continual use of one or more drugs 1,476 (40.1) 546 (55.9) 2.20E–016
AS1_DrugSp Anticonvulsant-taking experience 1 (0.03) 0 (0) 9.16E–013
AS1_DrugSpCu Continual use of anticonvulsants 1 (0.03) 0 (0) 0.3174
AS1_DrugSl Anticoagulant-taking experience 1 (0.03) 0 (0) 9.16E–013
AS1_DrugTb Tuberculosis drug-taking experience 63 (1.7) 18 (1.8) 7.11E–009
AS1_DrugOs Osteoporosis drug-taking experience 104 (2.8) 46 (4.7) 8.56E–011
AS1_DrugOsCu Continual use of osteoporosis drug 81 (2.2) 28 (2.9) 0.06314
AS1_DrugDi Diuretic-taking experience 2 (0.05) 3 (0.3) 3.43E–013
AS1_HDL_C High-density lipoprotein (HDL)-cholesterol (mg/dL) 45.34 ± 10.0 46.52 ± 10.3 0.001425
AS1_SBP Systolic blood pressure (mm Hg) 121.72 ± 20.0 118.86 ± 18.1 1.92E–005
AS1_Waist Waist size (cm) 81.96 ± 10.1 80.47 ± 9.5 2.07E–005
AS1_Height Height (cm) 153.6 ± 5.6 154.5 ± 5.4 2.92E–006
AS1_DT Distal radius T bone density (standard deviation) −0.05 ± 1.6 0.23 ± 1.5 3.74E–007

Values are presented as mean ± standard deviation or number (%).

Table 3.

Top 20 ranked SNPs of genomewide association analysis in males

RefSNP cluster ID (rs#) Gene CHR SNP BP Minor allele CHISQ p-value OR
1 rs8112449 - 19 SNP_A-2030176 10,381,064 T 22.69 0.000001901 1.304
2 rs11088226 - 21 SNP_A-1815523 32,847,402 G 21.38 0.00000376 1.3
3 rs2833889 - 21 SNP_A-2018178 32,849,639 G 20.99 0.000004623 1.297
4 rs2833890 - 21 SNP_A-2018180 32,849,757 A 20.42 0.000006206 1.293
5 rs2605883 - 8 SNP_A-2123956 74,349,808 A 19.44 0.00001039 1.299
6 rs4349972 - 8 SNP_A-2244783 74,357,797 T 19.22 0.00001167 1.296
7 rs12035141 - 1 SNP_A-4283116 207,145,759 C 18.79 0.00001461 0.7551
8 rs4274061 - 1 SNP_A-1786324 114,356,860 T 18.75 0.0000149 1.434
9 rs11088486 B3GALT5 21 SNP_A-1788320 39,868,999 T 18.69 0.00001538 0.7094
10 rs10483756 KCNH5 14 SNP_A-2224691 62,357,755 A 18.6 0.00001616 1.373
11 rs12682469 - 8 SNP_A-2293684 74,412,067 C 18.38 0.00001809 1.291
12 rs3785579 CACNG1 17 SNP_A-1912783 62,472,963 G 18 0.0000221 1.344
13 rs6845935 CCSER1 4 SNP_A-2009981 91,700,294 G 17.69 0.00002603 2.007
14 rs6960838 - 7 SNP_A-2070043 149,754,931 A 17.6 0.00002722 1.265
15 rs6978639 - 7 SNP_A-4259144 149,754,864 C 17.53 0.00002828 1.265
16 rs2029087 PRKCE 2 SNP_A-2121197 46,023,866 T 17.51 0.00002861 1.262
17 rs1365665 - 18 SNP_A-4296712 33,476,022 T 17.18 0.000034 1.295
18 rs1863645 - 18 SNP_A-4204442 33,478,276 G 17.11 0.00003523 1.294
19 rs10758596 GLIS3 9 SNP_A-2245408 4,291,601 C 16.85 0.00004047 1.689
20 rs2250538 SOX13 1 SNP_A-1960774 202,348,515 C 16.7 0.00004369 0.7963

SNP, single-nucleotide polymorphism; CHR, chromosome; BP, base pair; OR, odds ratio.

Table 4.

Top 20 ranked SNPs of genomewide association analysis in females

RefSNP cluster ID (rs#) Gene CHR SNP BP Minor allele CHISQ p-value OR
1 rs6445797 - 3 SNP_A-4260597 56,538,380 C 22.72 0.000001879 1.402
2 rs1503059 CA10 17 SNP_A-1859357 47,559,455 G 22.23 0.000002425 0.7834
3 rs10955971 COL14A1 8 SNP_A-2256799 121,445,527 T 22.18 0.000002484 1.319
4 rs7826906 - 8 SNP_A-1910277 121,570,904 G 21.92 0.00000285 1.316
5 rs978979 - 3 SNP_A-1911674 56,508,056 G 21.78 0.000003064 1.391
6 rs7835363 COL14A1 8 SNP_A-2240251 121,449,563 G 21.32 0.000003895 1.312
7 rs13263962 MRPL13 8 SNP_A-2198485 121,499,780 C 21.08 0.000004397 1.319
8 rs7835198 COL14A1 8 SNP_A-2021181 121,449,386 T 20.63 0.000005573 1.307
9 rs945144 LY86-AS1 6 SNP_A-1984941 6,421,277 A 19.81 0.000008575 0.7919
10 rs7766133 MBOAT1 6 SNP_A-4259064 20,301,726 T 18.29 0.00001897 1.244
11 rs16963496 HDC 15 SNP_A-1937381 48,323,730 G 17.75 0.00002521 1.519
12 rs6437416 AC090505.6 3 SNP_A-4269427 195,981,661 G 17.59 0.00002737 1.485
13 rs2665904 - 5 SNP_A-2301041 123,666,386 C 17.51 0.00002852 1.786
14 rs6561072 - 13 SNP_A-1808093 42,173,146 G 17.51 0.00002862 1.24
15 rs2238294 HDC 15 SNP_A-1887051 48,324,474 T 17.33 0.00003148 1.511
16 rs2414539 AQP9 15 SNP_A-2124556 56,240,798 T 17.26 0.00003258 1.316
17 rs17834472 - 14 SNP_A-2138553 60,684,493 G 17.17 0.00003418 1.369
18 rs17755119 - 10 SNP_A-1870834 29,299,456 T 16.81 0.00004131 1.468
19 rs1465093 MGAM 7 SNP_A-1991521 141,355,094 T 16.57 0.00004678 0.7989
20 rs12707453 HGF 7 SNP_A-2288799 81,207,355 G 16.49 0.0000489 1.237

SNP, single-nucleotide polymorphism; CHR, chromosome; BP, base pair; OR, odds ratio.

Table 5.

Gastritis-associated single-nucleotide polymorphisms

Male Female
1 rs8112449 rs6561072
2 rs12035141 rs1503059
3 rs4274061 rs17755119
4 rs11088486 rs16963496
5 rs10483756 rs945144
6 rs3785579 rs1465093
7 rs6845935 rs2414539
8 rs2029087 rs17834472
9 rs10758596 rs12707453
10 rs2250538 rs2665904
11 - rs7766133
12 - rs6437416