Genomics Inform Search

CLOSE


Genomics Inform > Volume 21(1); 2023 > Article
Kamarehei, Saidijam, and Taherkhani: Prognostic biomarkers and molecular pathways mediating Helicobacter pylori–induced gastric cancer: a network-biology approach

Abstract

Cancer of the stomach is the second most frequent cancer-related death worldwide. The survival rate of patients with gastric cancer (GC) remains fragile. There is a requirement to discover biomarkers for prognosis approaches. Helicobacter pylori in the stomach is closely associated with the progression of GC. We identified the genes associated with poor/favorable prognosis in H. pylori–induced GC. Multivariate statistical analysis was applied on the Gene Expression Omnibus (GEO) dataset GSE54397 to identify differentially expressed miRNAs (DEMs) in gastric tissues with H. pylori–induced cancer compared with the H. pylori–positive with non-cancerous tissue. A protein interaction map (PIM) was built and subjected to DEMs targets. The enriched pathways and biological processes within the PIM were identified based on substantial clusters. Thereafter, the most critical genes in the PIM were illustrated, and their prognostic impact in GC was investigated. Considering p-value less than 0.01 and |Log2 fold change| as >1, five microRNAs demonstrated significant changes among the two groups. Gene functional analysis revealed that the ubiquitination system, neddylation pathway, and ciliary process are primarily involved in H. pylori–induced GC. Survival analysis illustrated that the overexpression of DOCK4, GNAS, CTGF, TGF-b1, ESR1, SELE, TIMP3, SMARCE1, and TXNIP was associated with poor prognosis, while increased MRPS5 expression was related to a favorable prognosis in GC patients. DOCK4, GNAS, CTGF, TGF-b1, ESR1, SELE, TIMP3, SMARCE1, TXNIP, and MRPS5 may be considered prognostic biomarkers for H. pylori–induced GC. However, experimental validation is necessary in the future.

Introduction

Cancer of the stomach is the fifth-frequent carcinoma [1] and the second leading cause of malignancy related deaths worldwide [2-5], with approximately one million new cases each year, which contributes to being a major global health problem. Previous studies have found that gastric cancer (GC) is a heterogeneous disease in which the genetic and epigenetic alterations of vital human genes associated with the cell cycle and DNA repair procedures and environmental factors mediate the occurrence and progression of the disease [6-9].
It has been demonstrated that bacterial pathogens in the human stomach are involved in GC development. The primary human gastric pathogen, Helicobacter pylori, has infected more than 50% of the human population. Approximately 5%–15% of H. pylori–positive patients reveal gastric disorders ranging from gastritis and metaplasia to gastric carcinoma [10]. H. pylori is the leading risk factor for developing GC [11-14] and has been detected in most patients with stomach cancer [11]. The infection of the gastric mucosa caused by H. pylori may result in constant inflammation in gastric tissue by promoting the expression of different cytokines (e.g., interleukin 1 beta, interleukin-1 receptor antagonist, and tumor necrosis factor-α), which can lead to enhanced levels of reactive oxygen species, DNA damage, and hyper-activation of tumorigenesis signaling pathways associated with cancer [12-20].
Despite the recent progress of new diagnostic and therapeutic approaches in GC, the mean survival times for advanced stages is not favorable. Due to early diagnosis, the survival rate is approximately 5%–20% in Western countries and 50% in Japan [3,21-24]. In addition, the exact molecular etiology of the disease has not been fully illustrated. By identifying the tumor suppressor genes that are usually down-expressed due to deletion or mutation, as well as discovering the tumor promoter genes associated with gastric carcinoma, the underlying mechanisms of the disease could further be elucidated, and more knowledge would be provided in the diagnostic, prognostic, and therapeutic procedures of GC [23-33].
Cancer biomarkers are differentially expressed molecules in patients with cancer compared to healthy individuals. Some biomarkers are the main reason for abnormal cellular and molecular changes leading to malignancy, and others are secreted in response to the disease. The prognostic markers are used to predict the situation of patients in the future, independent of the treatment obtained and may be used for predicting personalized medicine. In addition, the overall survival rate of patients and cancer recurrence could be expected by identifying prognostic biomarkers [34-36]. During the last decades, several of these markers have been introduced by cancer researchers [37-41]. Therefore, physicians are encouraged to use validated biomarkers for personalized medicine as adjuvant treatment [34].
The small non-coding RNAs contributing to the gene regulatory process at the post-transcriptional stage are named microRNAs (miRNAs). They bind to their specific complementary nucleotides at different regions of the genes [42-48]. Previous studies have demonstrated that miRNAs could either promote or diminish the expression of genes [49,50]. In this regard, miRNAs could enhance their target genes' expression if they bind to the promoter region. However, these small molecules could result in gene silencing if they attach to other parts of the genes, such as 3′ untranslated region (UTR), 5′ UTR, and the coding sequence [50,51]. MiRNAs contribute to gene regulation and play a decisive role in several biological procedures, such as cellular proliferation and differentiation, apoptosis, development, inflammation, carcinogenesis, and metastasis. The abnormal expression of miRNAs in tissues may result in tumorigenesis or vice versa [52]. Therefore, miRNAs have become encouraging molecules in biomarker discovery in cancer research [53-55]. The most significant miRNAs associated with the initiation, progression, and prognosis of GC could be determined by analyzing their expression in gastric normal and tumor tissues [56].
Microarray is high-throughput technology suitable for simultaneously analyzing thousands of gene expression patterns [57]. A large number of variables with a small sample size are characteristics of high-throughput data. Therefore, robust statistical approaches are necessary for analyzing data obtained from microarray, which may result in identifying reliable biomarker candidates. Orthogonal-partial least squares–discriminant analysis (OPLS-DA) is a multivariate statistical method widely used for analyzing high-throughput data, leading to identifying differential variables significantly expressed among classified groups [58].
Reproducibility, also known as repeatability or precision, is the degree to which repeated measurements of an equal amount will display similar or comparable results. Standard deviation, variance, and Pearson correlation coefficient are commonly used to report the reproducibility of a dataset in the microarray technique. For ideally precise technologies, the variance of a measurement is zero [59]. For oligonucleotide arrays such as Agilent, Affymetrix, and Codelink, the Pearson correlation coefficient is calculated as > 0.9 [60,61]. Due to the high-throughput property of the microarray technique, which makes it possible to screen the complete profile of molecules, it has been widely used for miRNA analysis [21,62]. The miRNA expression profiles have demonstrated more stability, accuracy, and reproducibility than mRNA signatures. Because of the high stability of miRNAs in body fluids, they are assigned valuable biomarkers for clinical diagnosis and prognosis of human diseases [63-65]. However, a robust RNA isolation approach is necessary for achieving reliable results. Trizol/TRI-reagent-based isolation has demonstrated reproducible results, leading to considerable miRNA resistance to degradation when properly prepared and stored [66].
In the present study, we exposed differentially expressed miRNAs (DEMs) between H. pylori–induced gastric cancerous tissue and non-tumor tissue collected from H. pylori–positive patients. Subsequently, the targets of DEMs were determined, and a protein interaction map (PIM) was built and analyzed. The most critical genes in the PIM were identified, and their prognostic impact in GC patients was studied using the GEPIA database. Moreover, the most significant pathways and Gene Ontology (GO) terms deregulated in the H. pylori–induced GC were discussed. We followed the methods of Bayat et al. (2021) [67]. Of note, different p-value thresholds were used in this study for various analyses. Notably, Yue et al. [68] additionally used different p-value thresholds in their previous research to identify DEGs in metastasis nasopharyngeal carcinoma (NPC) samples compared to the nonmetastatic specimens (p < 0.01), as well as enriched pathways in NPC (p < 0.05).

Methods

Microarray expression data acquisition and analysis

The raw microarray expression dataset of GSE54397 [69] was obtained as a TXT format from the Gene Expression Omnibus (GEO) source [70]. GSE54397 contained 32 observations containing eight H. pylori–induced gastric cancerous tissues, eight non-tumor tissues collected from H. pylori–positive patients, eight gastric cancerous tissues obtained from H. pylori–negative patients, and eight non-tumor tissues collected from H. pylori–negative patients. The dataset was based on the GPL15159 platform (Agilent-031181 Unrestricted_Human_miRNA_V16.0_Microarray 030840). To discover novel risk factors in patients affected by H. pylori, a new dataset was selected from the GSE54397, which consisted of eight H. pylori–induced gastric cancerous tissue samples and eight tissue samples with no cancer signs were achieved from H. pylori–positive individuals. This might help to detect GC in infected individuals. Normalization was performed prior to statistical analysis. The OPLS-DA identified the DEMs between two groups using the R version 4.0.2 programming language [71]. The cutoff conditions were set to an absolute Log2 fold change |Log2 FC| > 1 and the p-value less than 0.01 [68,72]. The volcano plot of miRNAs in the two studied groups was achieved using the Shiny apps web-based tool [73]. Moreover, the hierarchical clustering of differential miRNAs was conducted utilizing the R language.

PIM construction, module detection, and functional analysis

The validated targets of considerable DEMs were determined utilizing the MiRWalk 2.0 [74]. The GO annotation analyses for these targets, including cellular components (CCs) and molecular functions (MFs), were carried out utilizing the ClueGO version 2.5.7 tool [75]. The STRING online database [76] version 11.0 was used to illustrate the interactions between target genes. The single proteins were excluded from the primary PIM before further analysis. The PIM was analyzed using the Cytoscape software [77], leading to the identification of hub genes with the highest degree and betweenness centralities [78]. Moreover, clustering analysis was performed using the MCODE tool. Modules with the following benchmarks were assigned as significant condensed regions: score ≥ 3, depth ≤ 100, k-score = 2, node score cutoff = 0.2, degree ≥ 2, and the minimum number of nodes = 10 [79]. Thereafter, significant pathways and biological processes (BPs) enriched by these modules were studied. The Reactome database [79] and the ClueGO tool were used for pathway and GO annotation analyses, respectively. The minimum number of enriched genes as two, besides the false discovery rate (FDR) as < 0.05 [67,68,80-83], were assigned meaningful for the affected pathways and BP terms in H. pylori–induced GC.

Survival analysis

The Kaplan-Meier curve was generated for the hub genes using the (GEPIA) web server [84] to investigate the prognostic impact of hub markers in gastric carcinoma. Furthermore, the Cox proportional hazards regression model was utilized to determine the corrected hazard ratios (HR) and 95% confidence intervals of hub genes and evaluate the prognostic factors' independence. The prognostic impact of markers with the HR and log-rank test p < 0.05 [67,80-83] were statistically considered meaningful.

Identifying common DEMs between H. pylori–induced gastric cancerous tissues and H. pylori–negative specimens

Besides the main dataset which was analyzed in this study (including H. pylori–induced gastric cancerous tissues [n = 8] and non-tumor tissues collected from H. pylori–positive patients [n = 8]), two other datasets were extracted from the GSE54397 as follows: one of them included H. pylori–induced GC samples (n = 8) and H. pylori–negative cancerous tissues (n = 8) and the other dataset contained H. pylori–positive GC specimens (n = 8) and H. pylori–negative normal tissues (n = 8). All three datasets were analyzed using the OPLS-DA algorithm to detect the common DEMs in three different datasets. The DEMs with the criteria of the p-value less than 0.01 and |Log2 FC| more than one were statistically assigned significantly.

Gene expression evaluation of prognostic markers

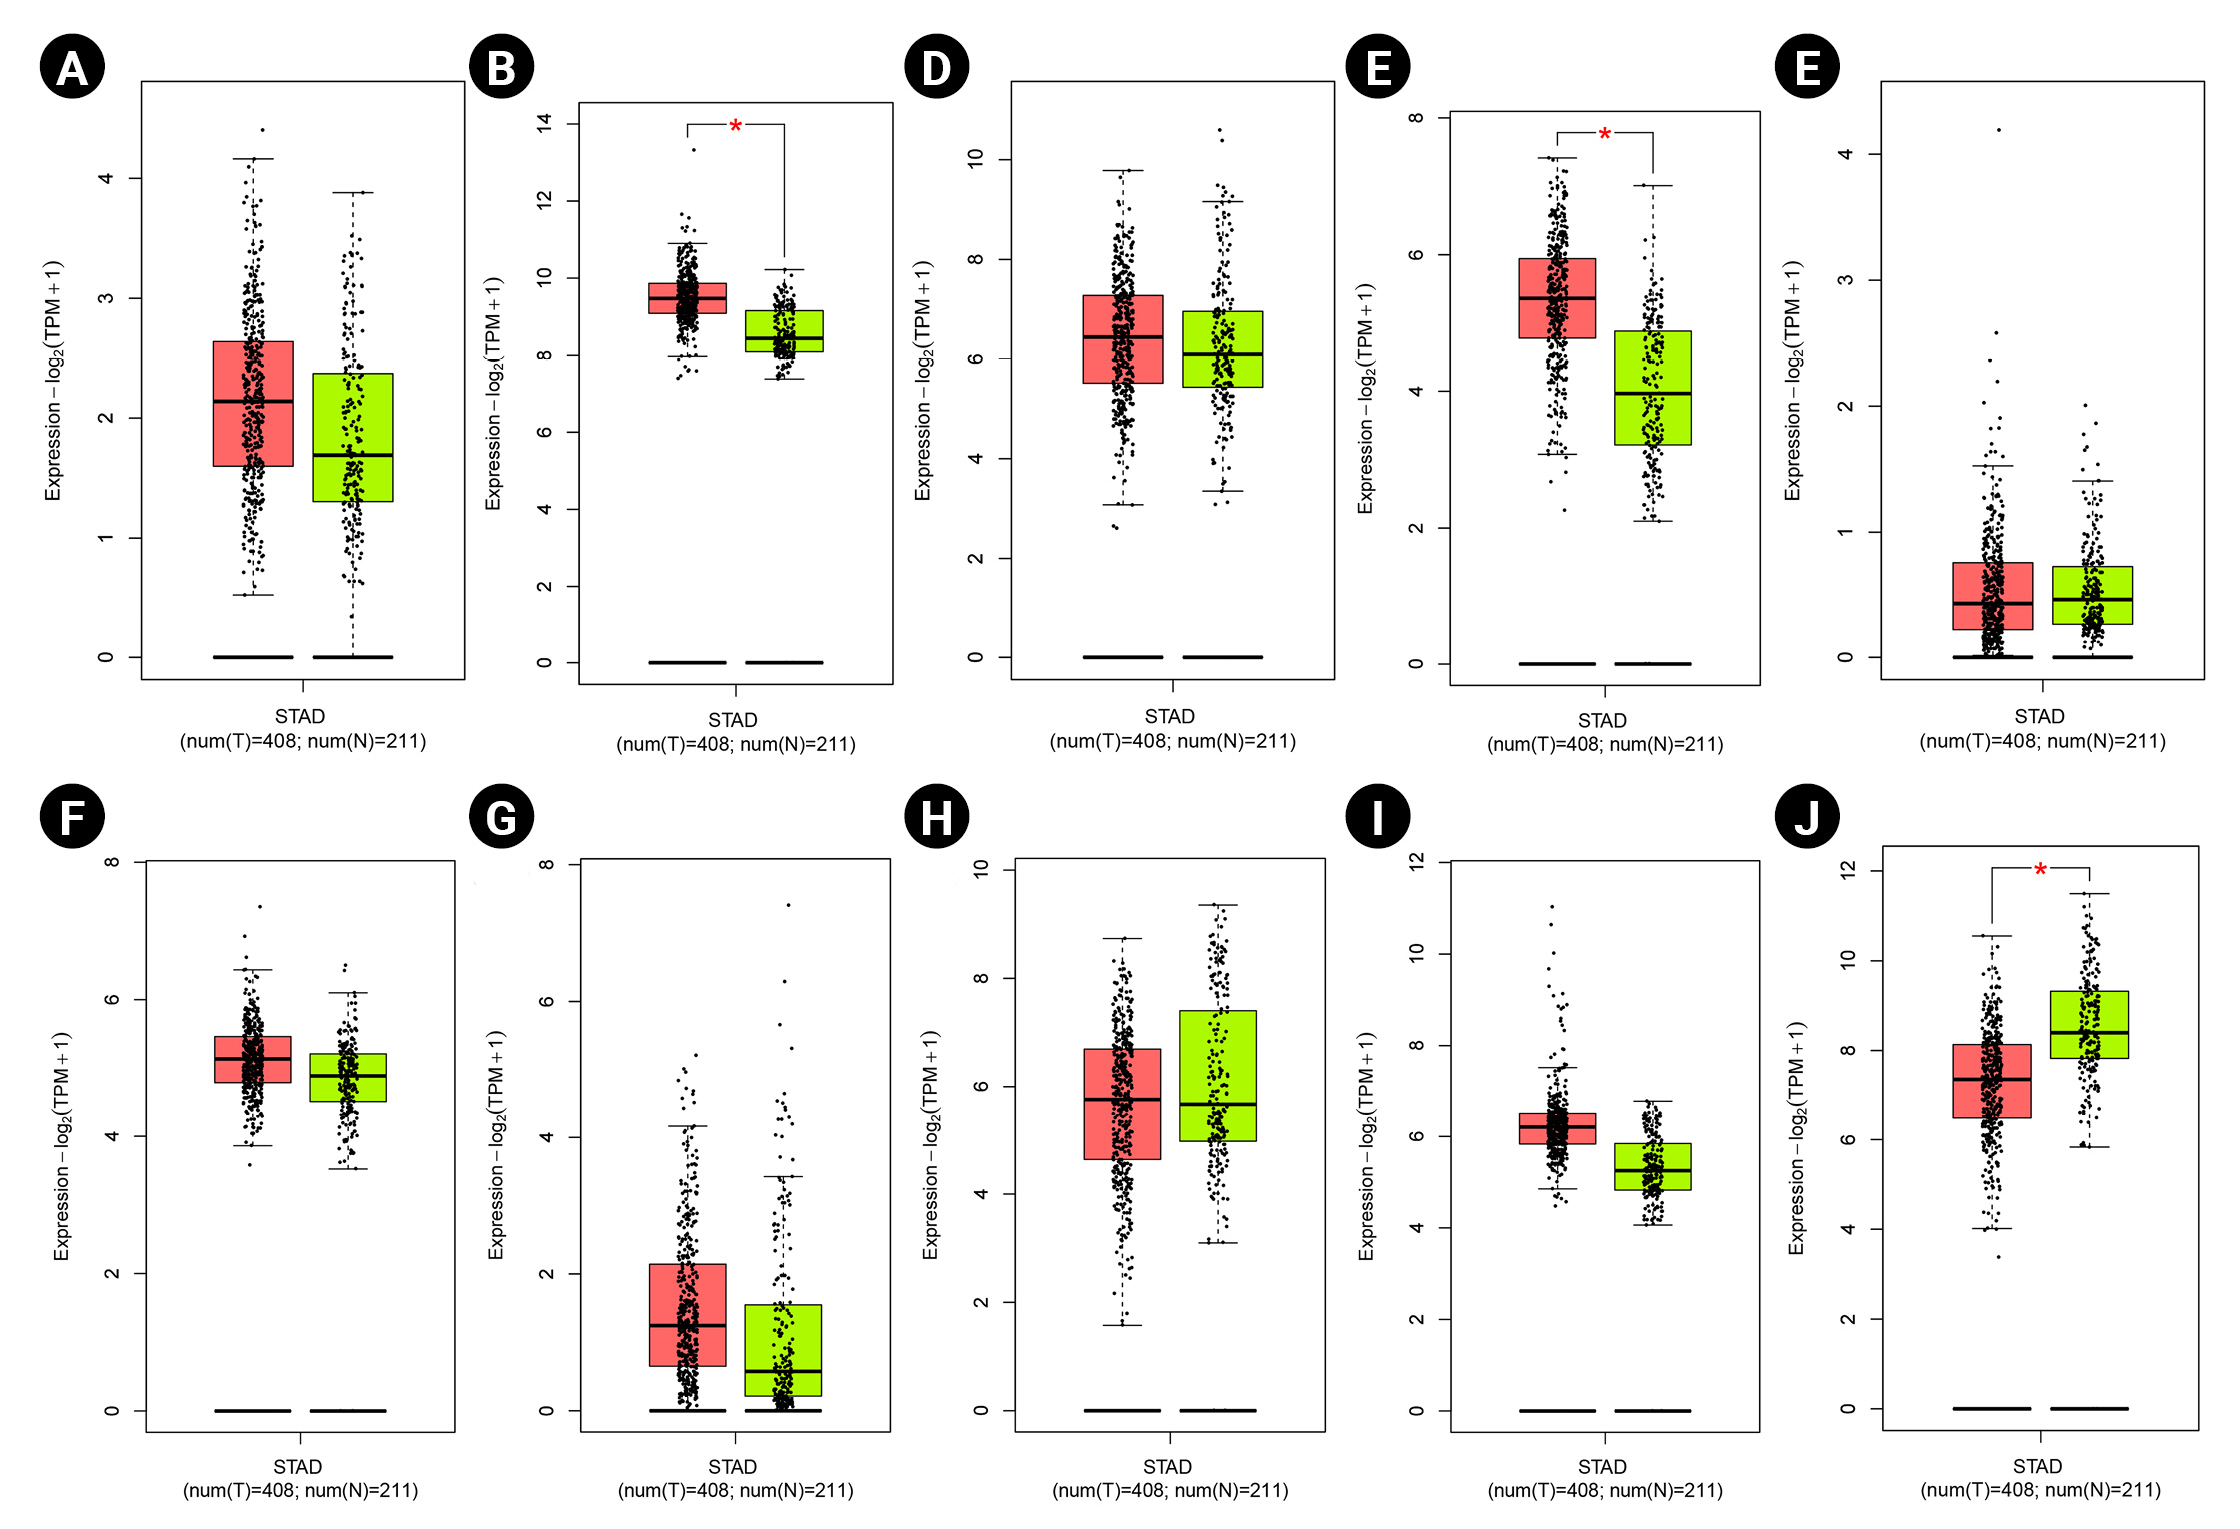
The gene expression patterns of prognostic markers in GC were evaluated at the mRNA and protein levels using the GEPIA2 [84] and the Human Protein Atlas (HPA) databases, respectively. The GEPIA2 server provides boxplot analysis using stomach adenocarcinoma tissues (n = 408) and normal gastric specimens (n = 211). The HPA has been developed since 2003 to map all the human proteins in cells, tissues, and organs using various technologies, including antibody-based imaging and mass spectrometry-based proteomics. The HPA, freely available at https://www.proteinatlas.org/ [85], allows researchers to access the expression patterns of the human proteome.

Ethical approval

The present study was approved by the Ethics Committee of Hamadan University of Medical Sciences, Hamadan, Iran (ethics no. IR.UMSHA.REC.1399.583). No human/animal was used in this study.

Results

DEMs in H. pylori–induced gastric carcinoma

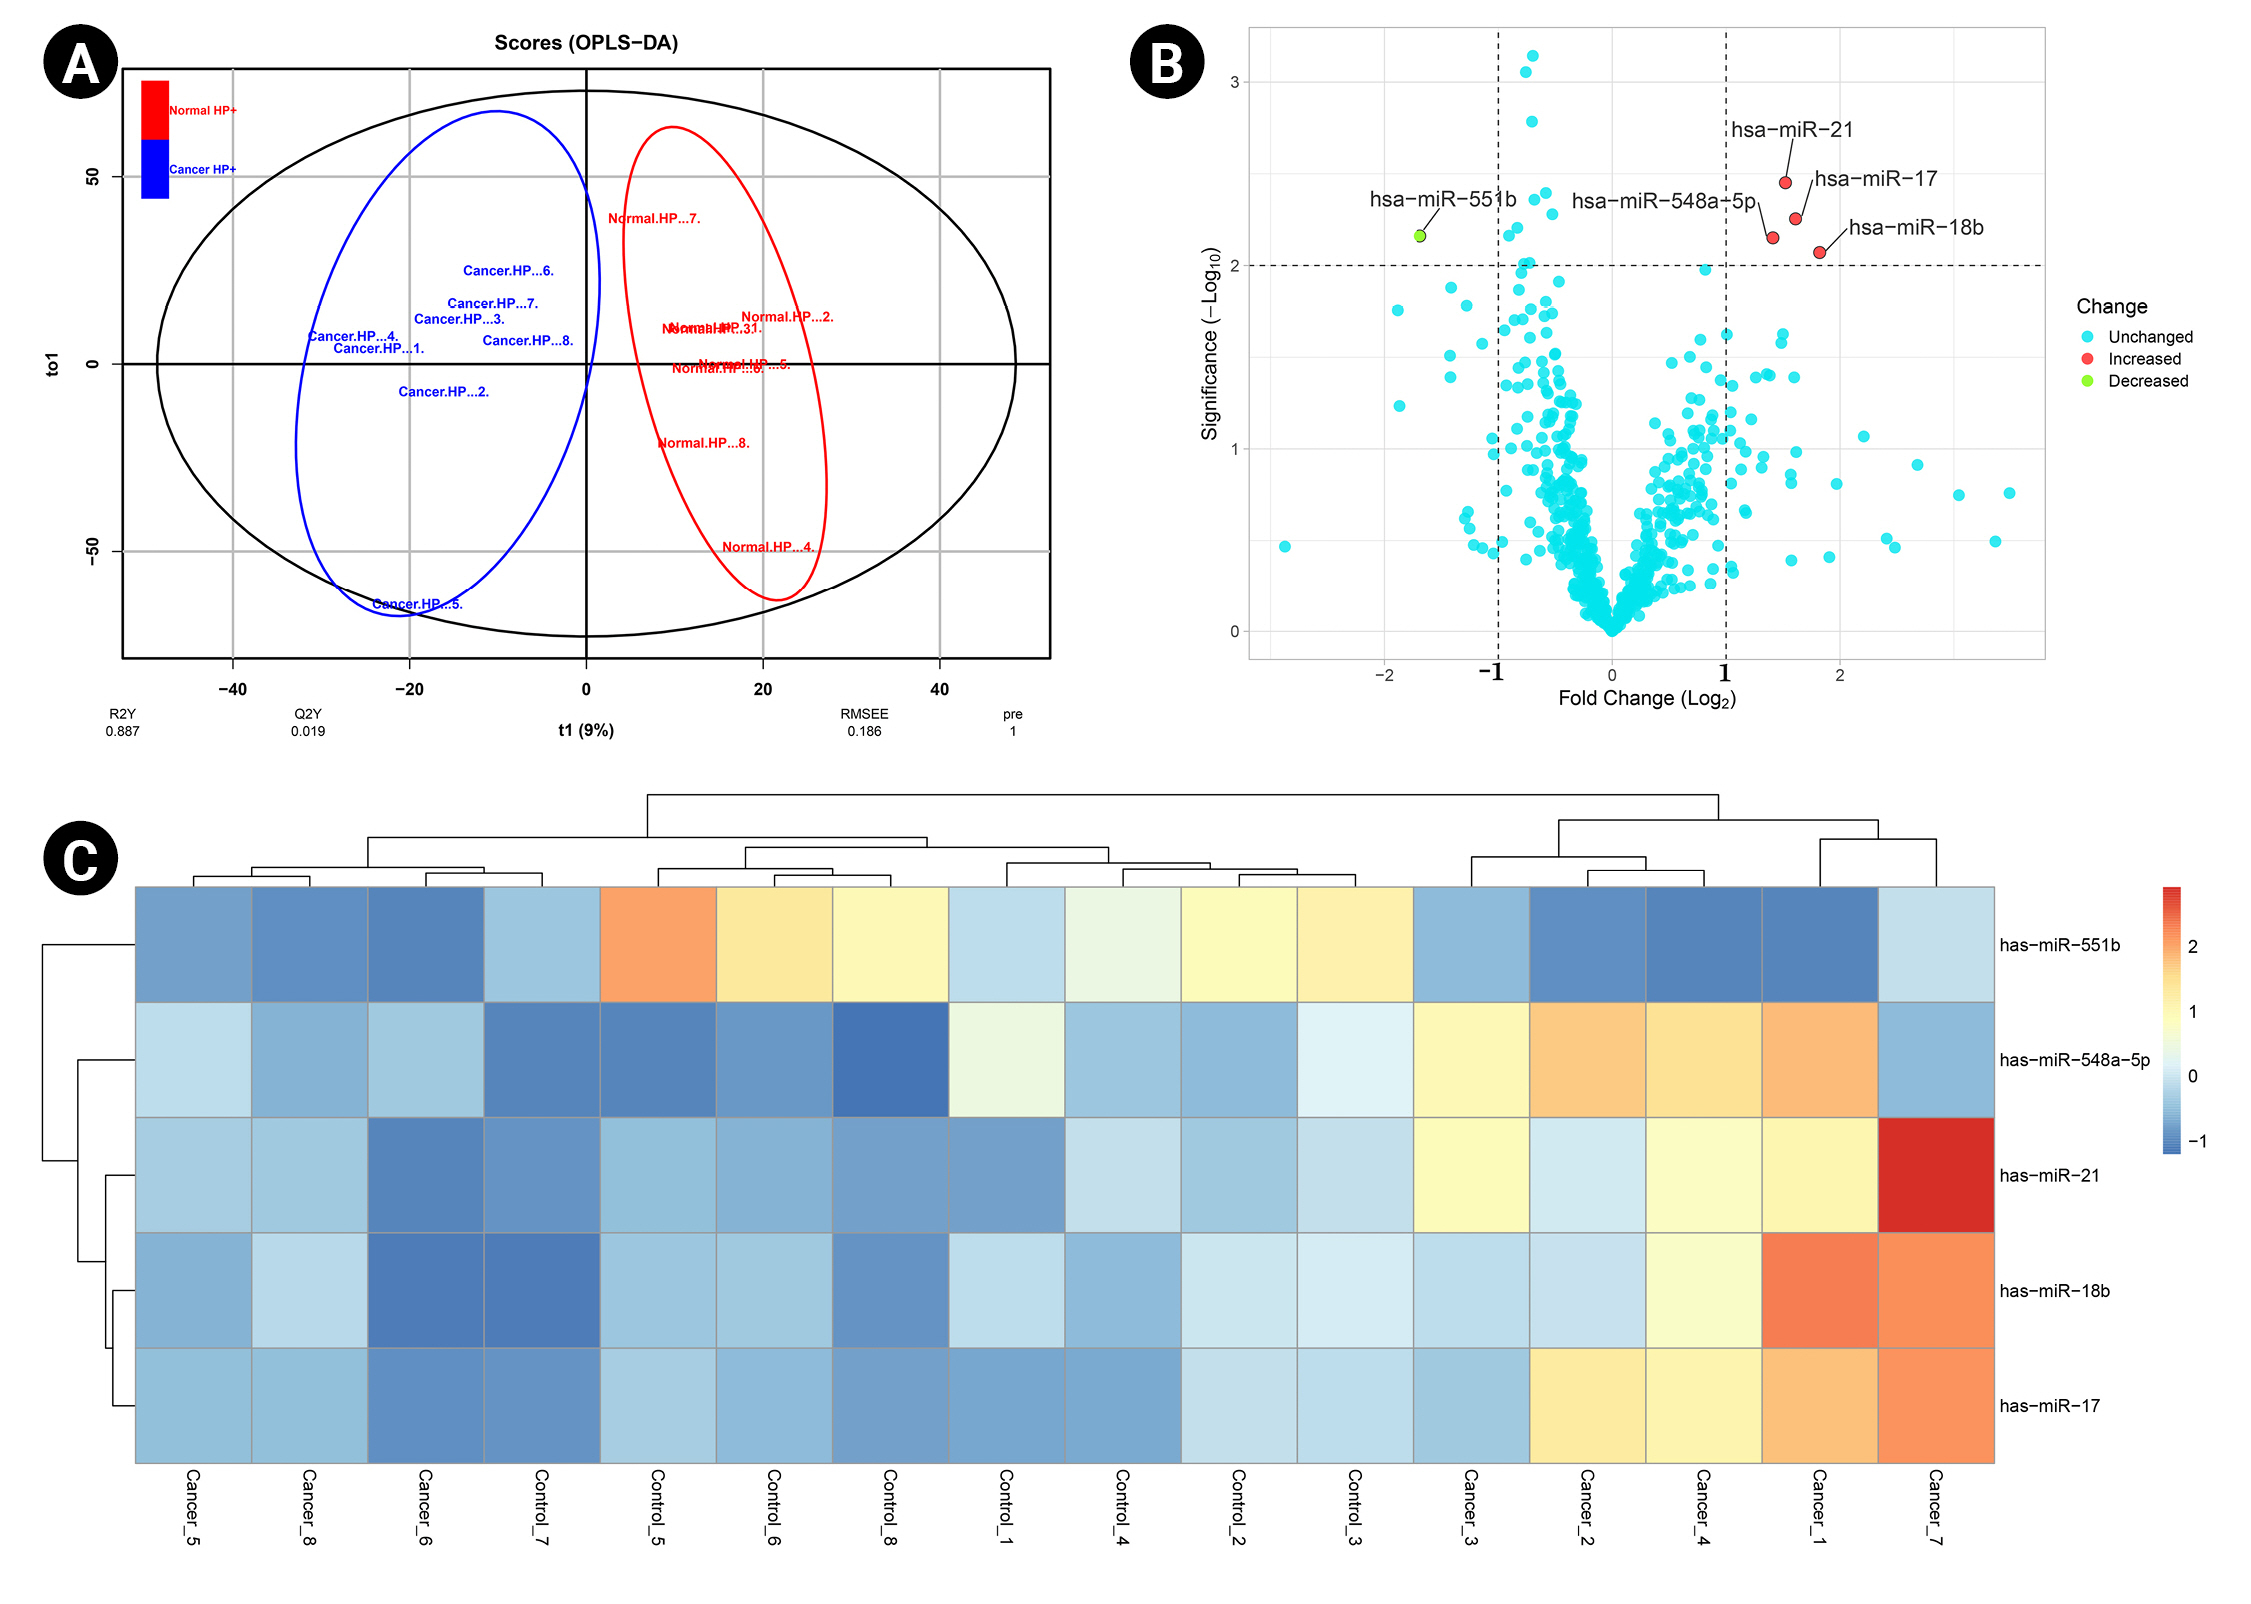
A predictive OPLS-DA model was constructed for the dataset containing H. pylori–induced gastric cancerous tissue samples (n = 8) and non-tumor gastric tissue samples from H. pylori–positive patients (n = 8). The R2X, R2Y, and Q2 of the OPLS-DA were calculated as 0.344, 0.887, and 0.019, respectively (Fig. 1A). Four overexpressed, and one underexpressed miRNA were indicated to be statistically differential in H. pylori–induced GC patients compared to the healthy controls (p < 0.01; |Log2 FC| > 1) (Table 1). Fig. 1B demonstrates the volcano plot of miRNAs in the studied groups. Moreover, Fig. 1C illustrates the heat map of differential miRNAs among case-control samples.

Protein interaction map, clustering, and functional analyses

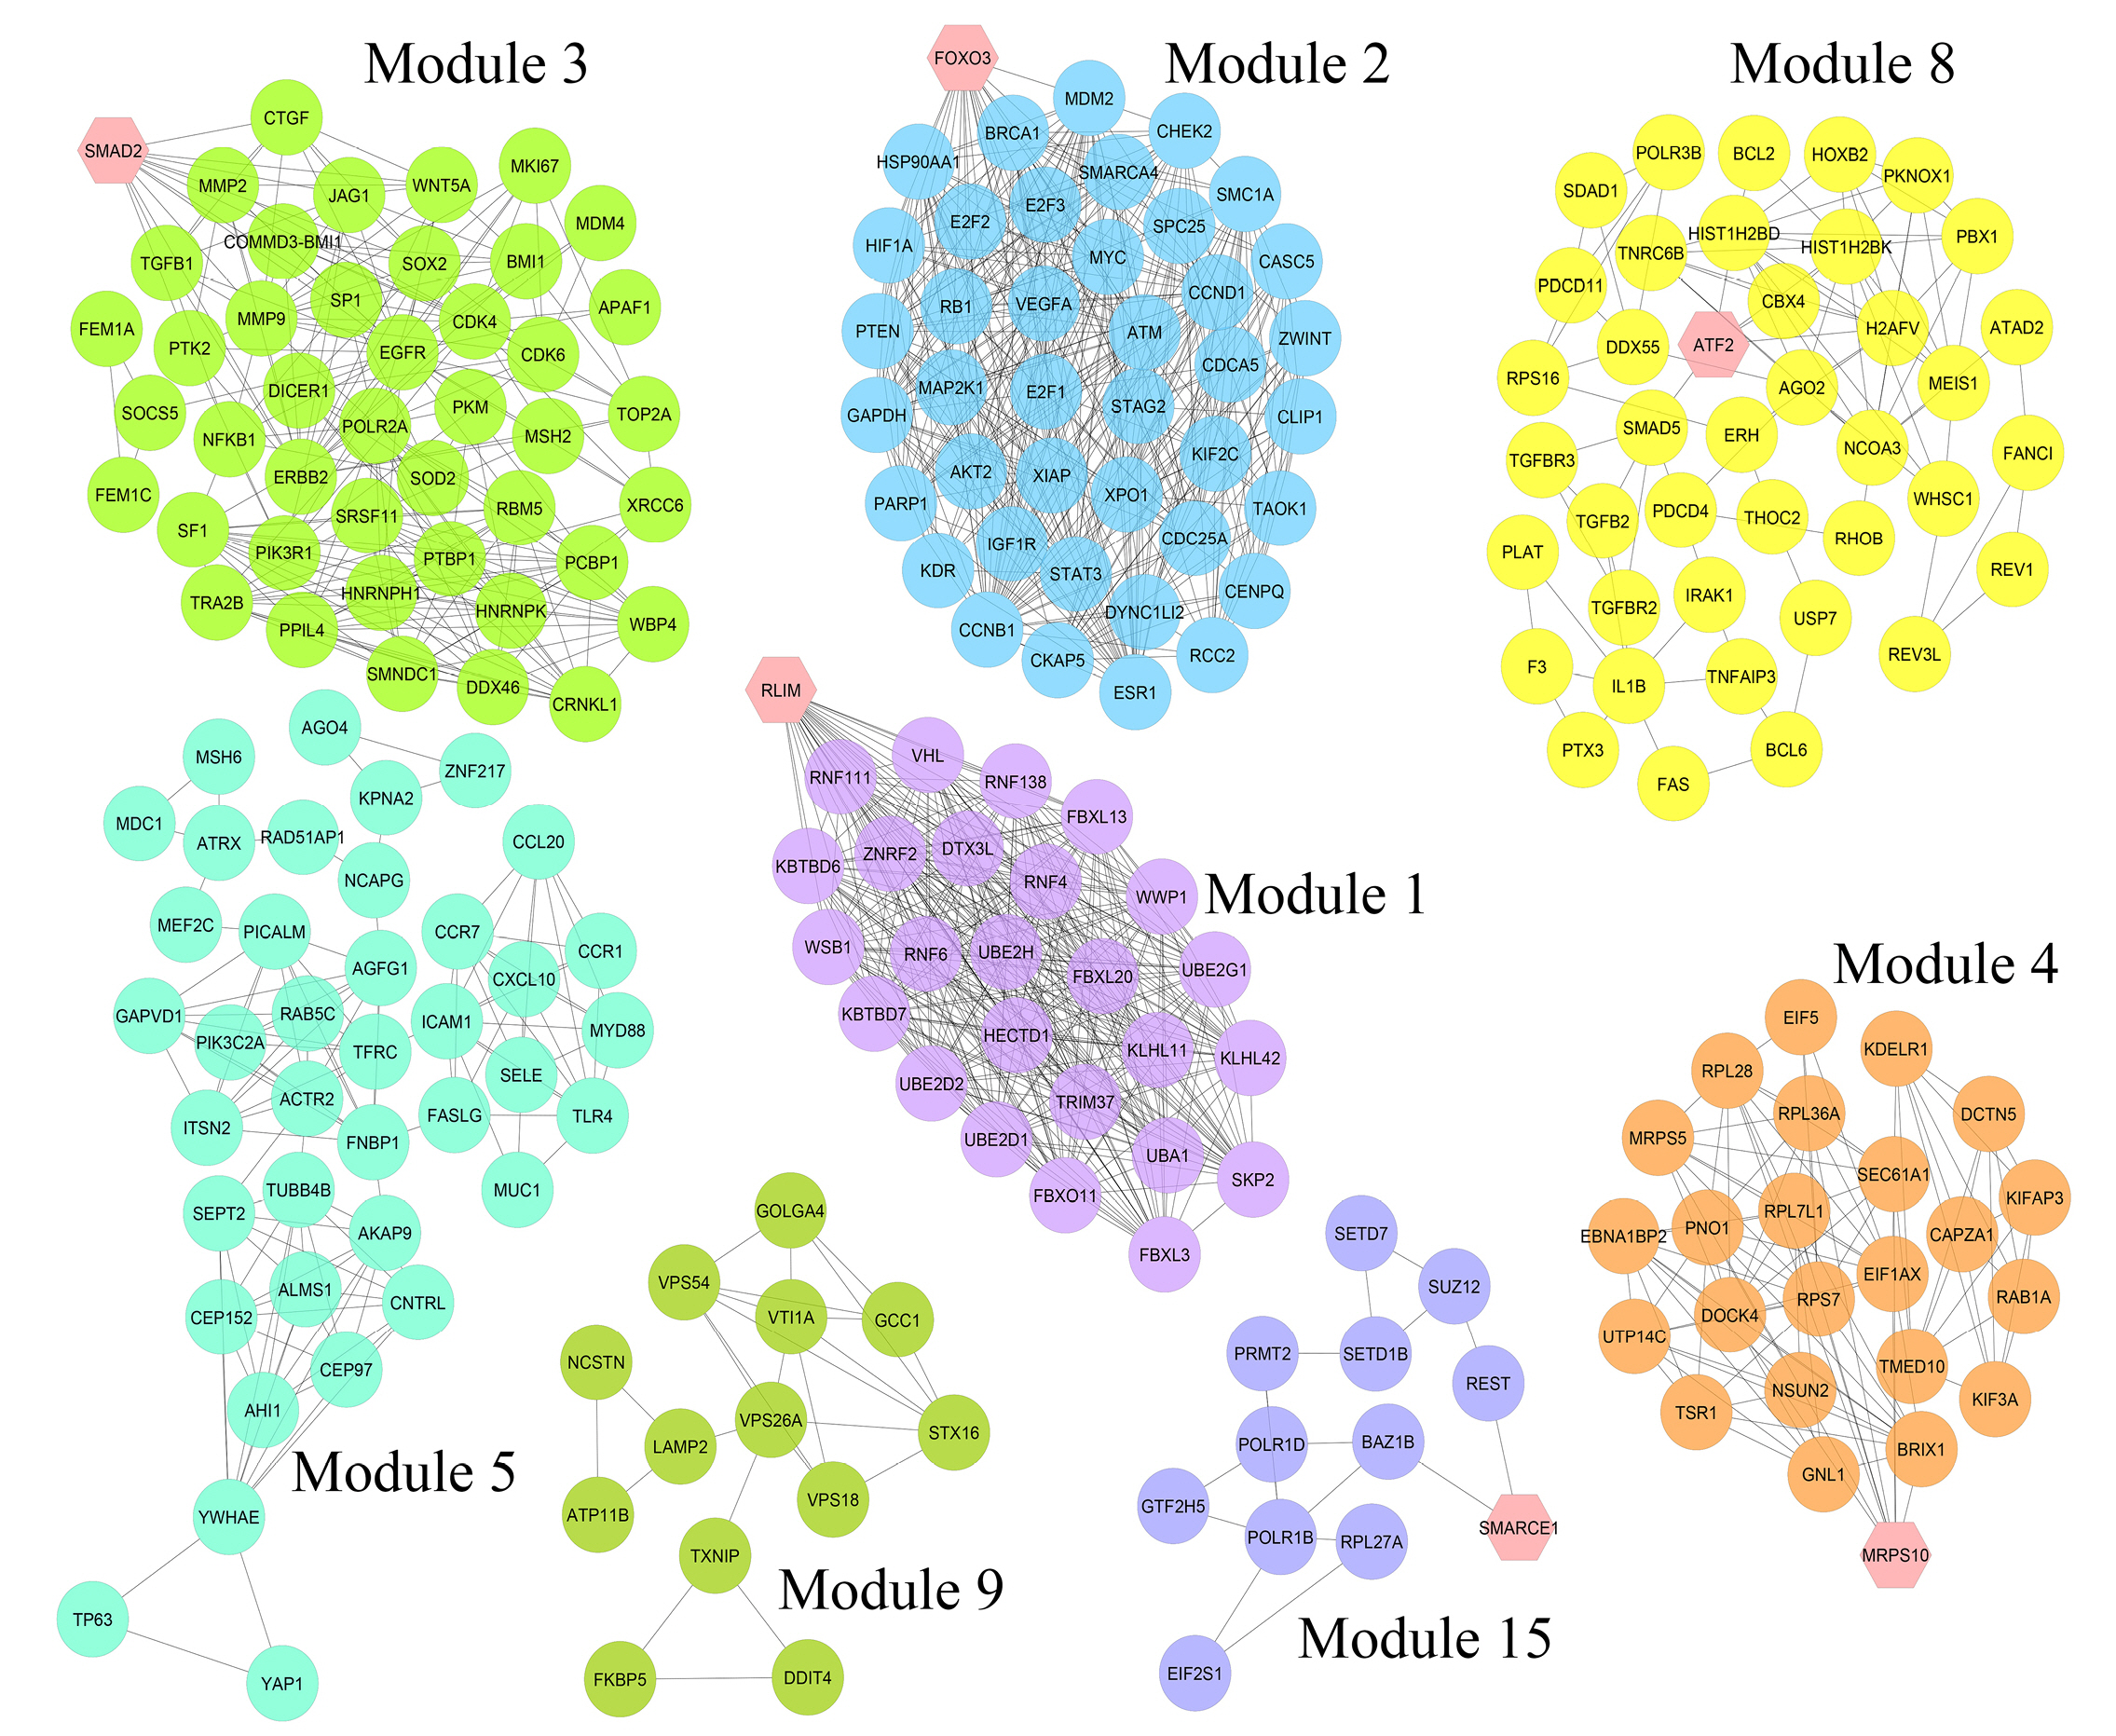
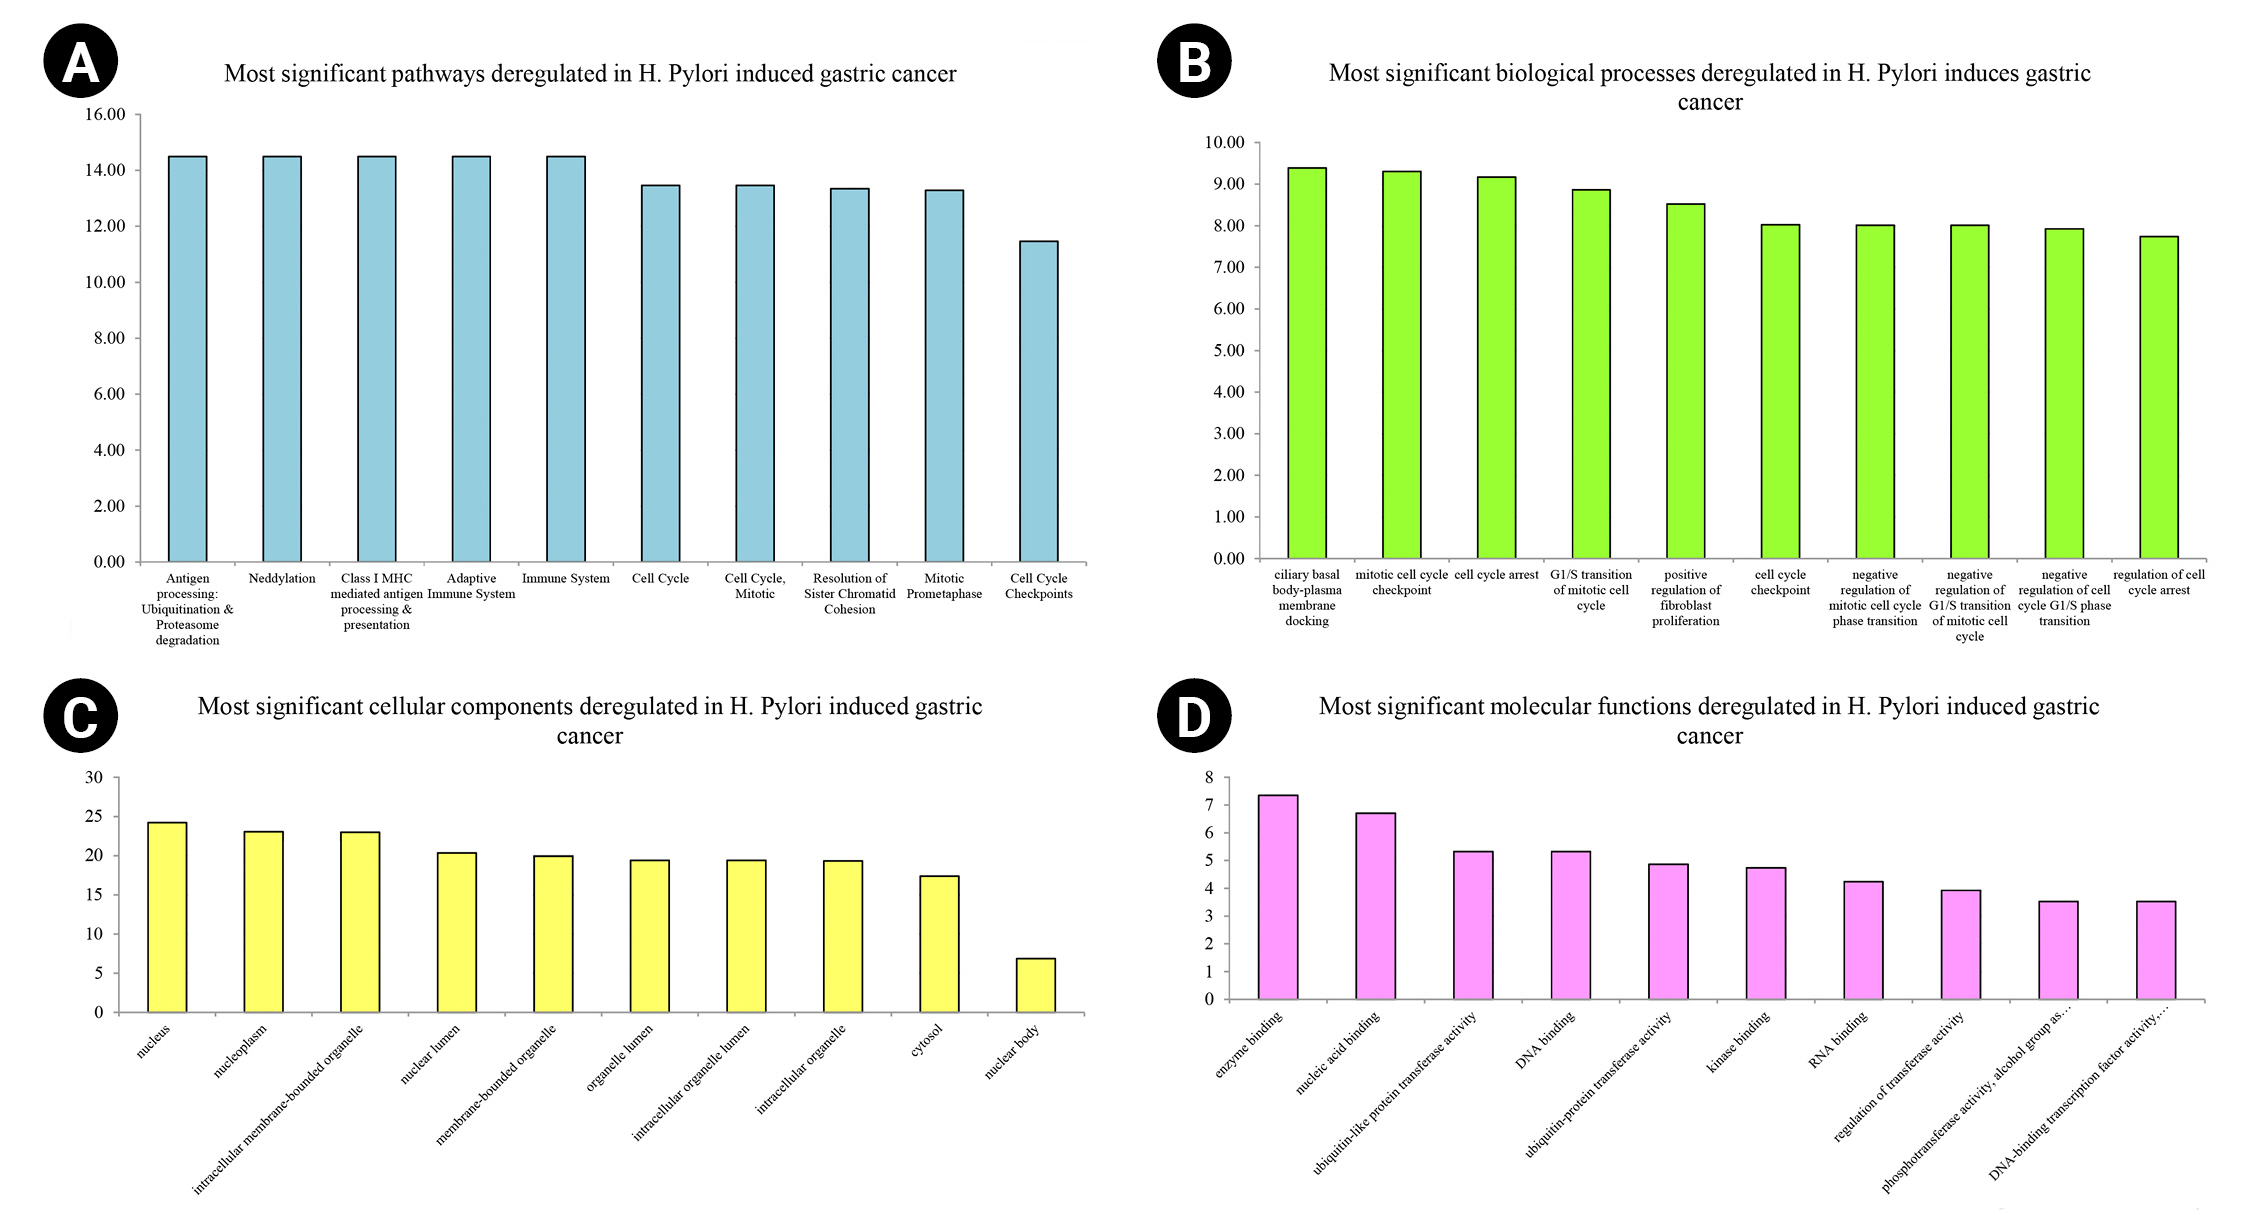
Nine hundred seventy genes were determined as experimentally validated targets of DEMs. Therefore, a PIM was constructed based on these genes utilizing the STRING source with a confidence score of ≥0.4. After excluding single nodes, a PIM with 931 proteins and 6,861 interactions was imported into the Cytoscape for further analyses, including functional and structural studies. Eight substantial modules were detected inside the PIM (Fig. 2). Table 2 presents the topological features of each cluster. At an FDR of 0.05, 399 pathways and 224 BPs were significantly enriched in patients with H. pylori–induced GC than those with H. pylori–positive patients with non-tumor gastric tissue. Moreover, 31 CCs and 51 MFs were affected considerably in H. pylori–induced gastric carcinoma (FDR < 0.05) [67,80-83]. The most significant pathways and GO terms enriched in H. pylori–induced GC are demonstrated in Fig. 3. In addition to the network analysis results, the average degree and betweenness values of the nodes in the network were 59.85 and 0.0149, respectively. Furthermore, 175 proteins had degree and betweenness centrality values more remarkable than the mean of the network vertexes and therefore, assigned as the most critical genes associated with the etiology of H. pylori–induced GC, named hubs (Supplementary Table 1). Fig. 4A and 4B demonstrate the top 10 hub genes regarding their degree and betweenness centralities, respectively.

Prognostic impact of the hub genes

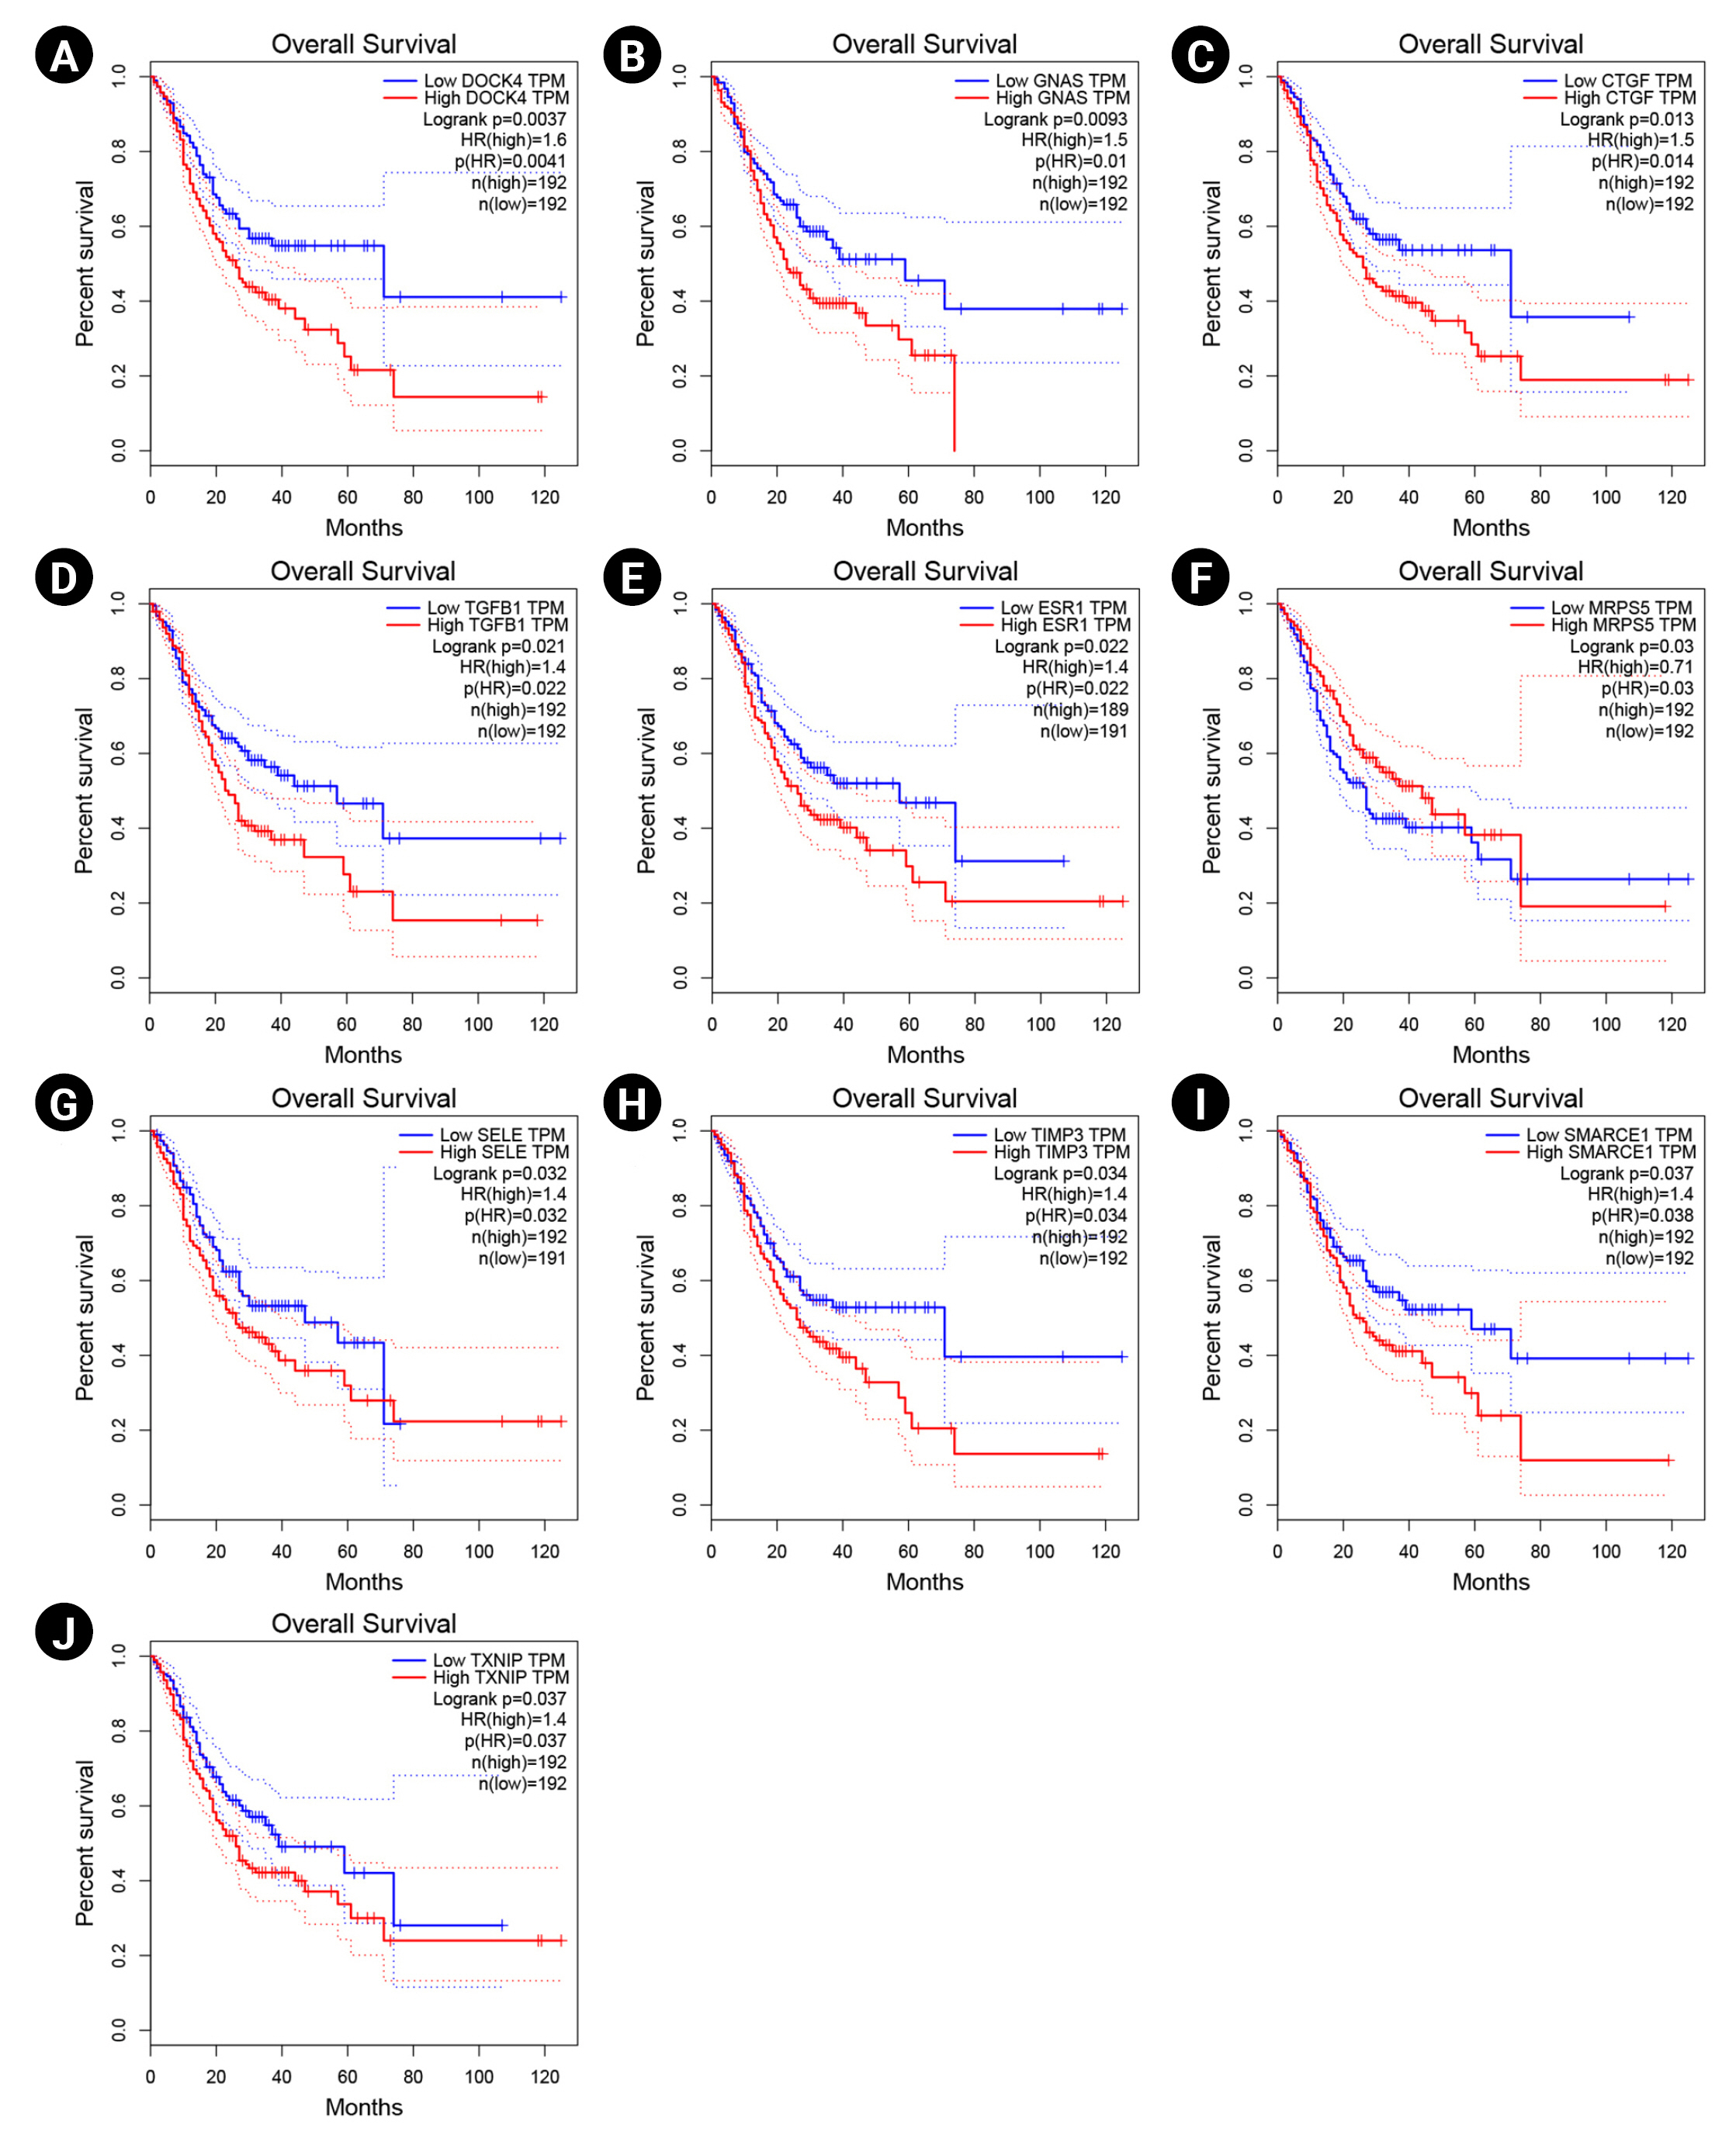
The overexpression of DOCK4, GNAS, CTGF, TGF-b1, ESR1, SELE, TIMP3, SMARCE1, and TXNIP significantly revealed a poor prognosis in GC patients. Therefore, these markers may participate in the metastasis and recurrence of GC and could be considered potential cancer markers associated with a dismal prognosis in H. pylori–induced gastric carcinoma. In addition, enhanced expression of MRPS5 exhibited a favorable prognosis in GC patients. The Kaplan-Meier curves for these potential prognostic biomarkers are presented in Fig. 5.

Common DEMs between H. pylori–positive GC samples and H. pylori–negative specimens

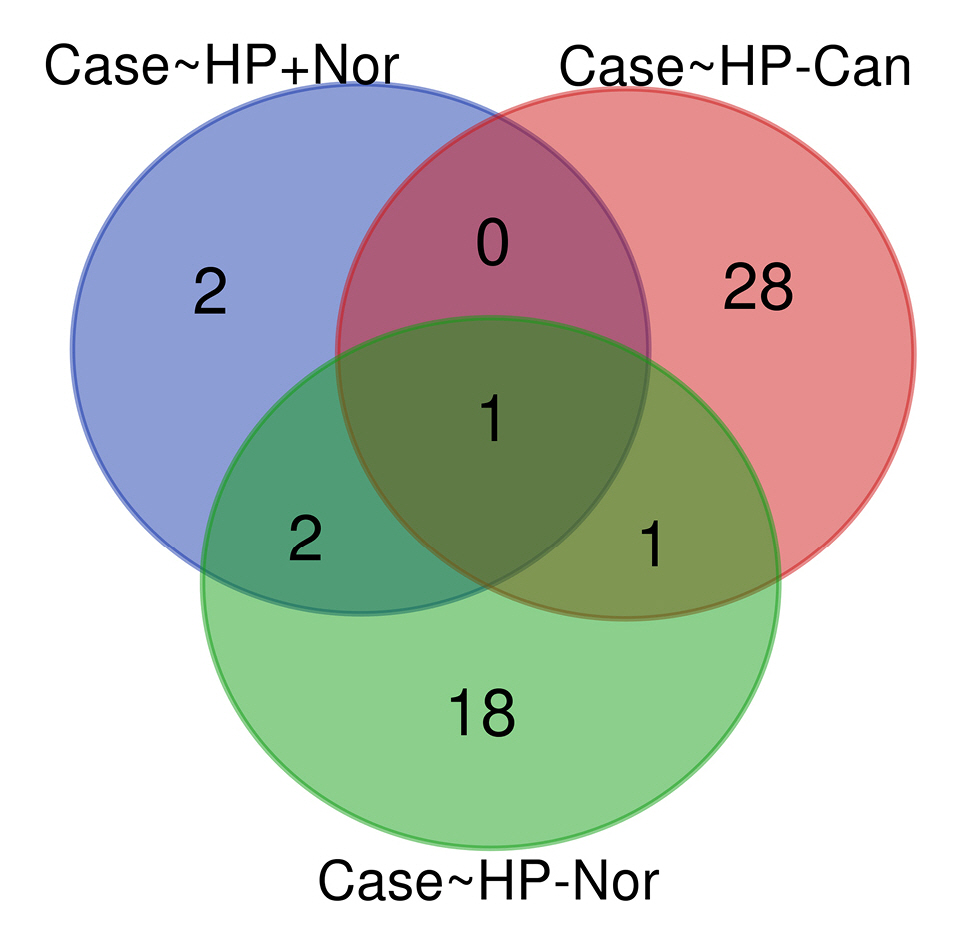
By analyzing three different datasets, 30 DEMs were found in H. pylori–positive GC samples compared to H. pylori–negative specimens. Also, 22 DEMs were identified in H. pylori–induced GC compared with the H. pylori–negative healthy controls. Moreover, has-miR-551b was a common DEM in H. pylori–induced GC compared to the other H. pylori–negative tissues (p < 0.01 and |Log2 FC| > 1) (Table 3). The common DEMs between three different datasets were discovered using the Venn diagrams (Fig. 6).

Markers expression study

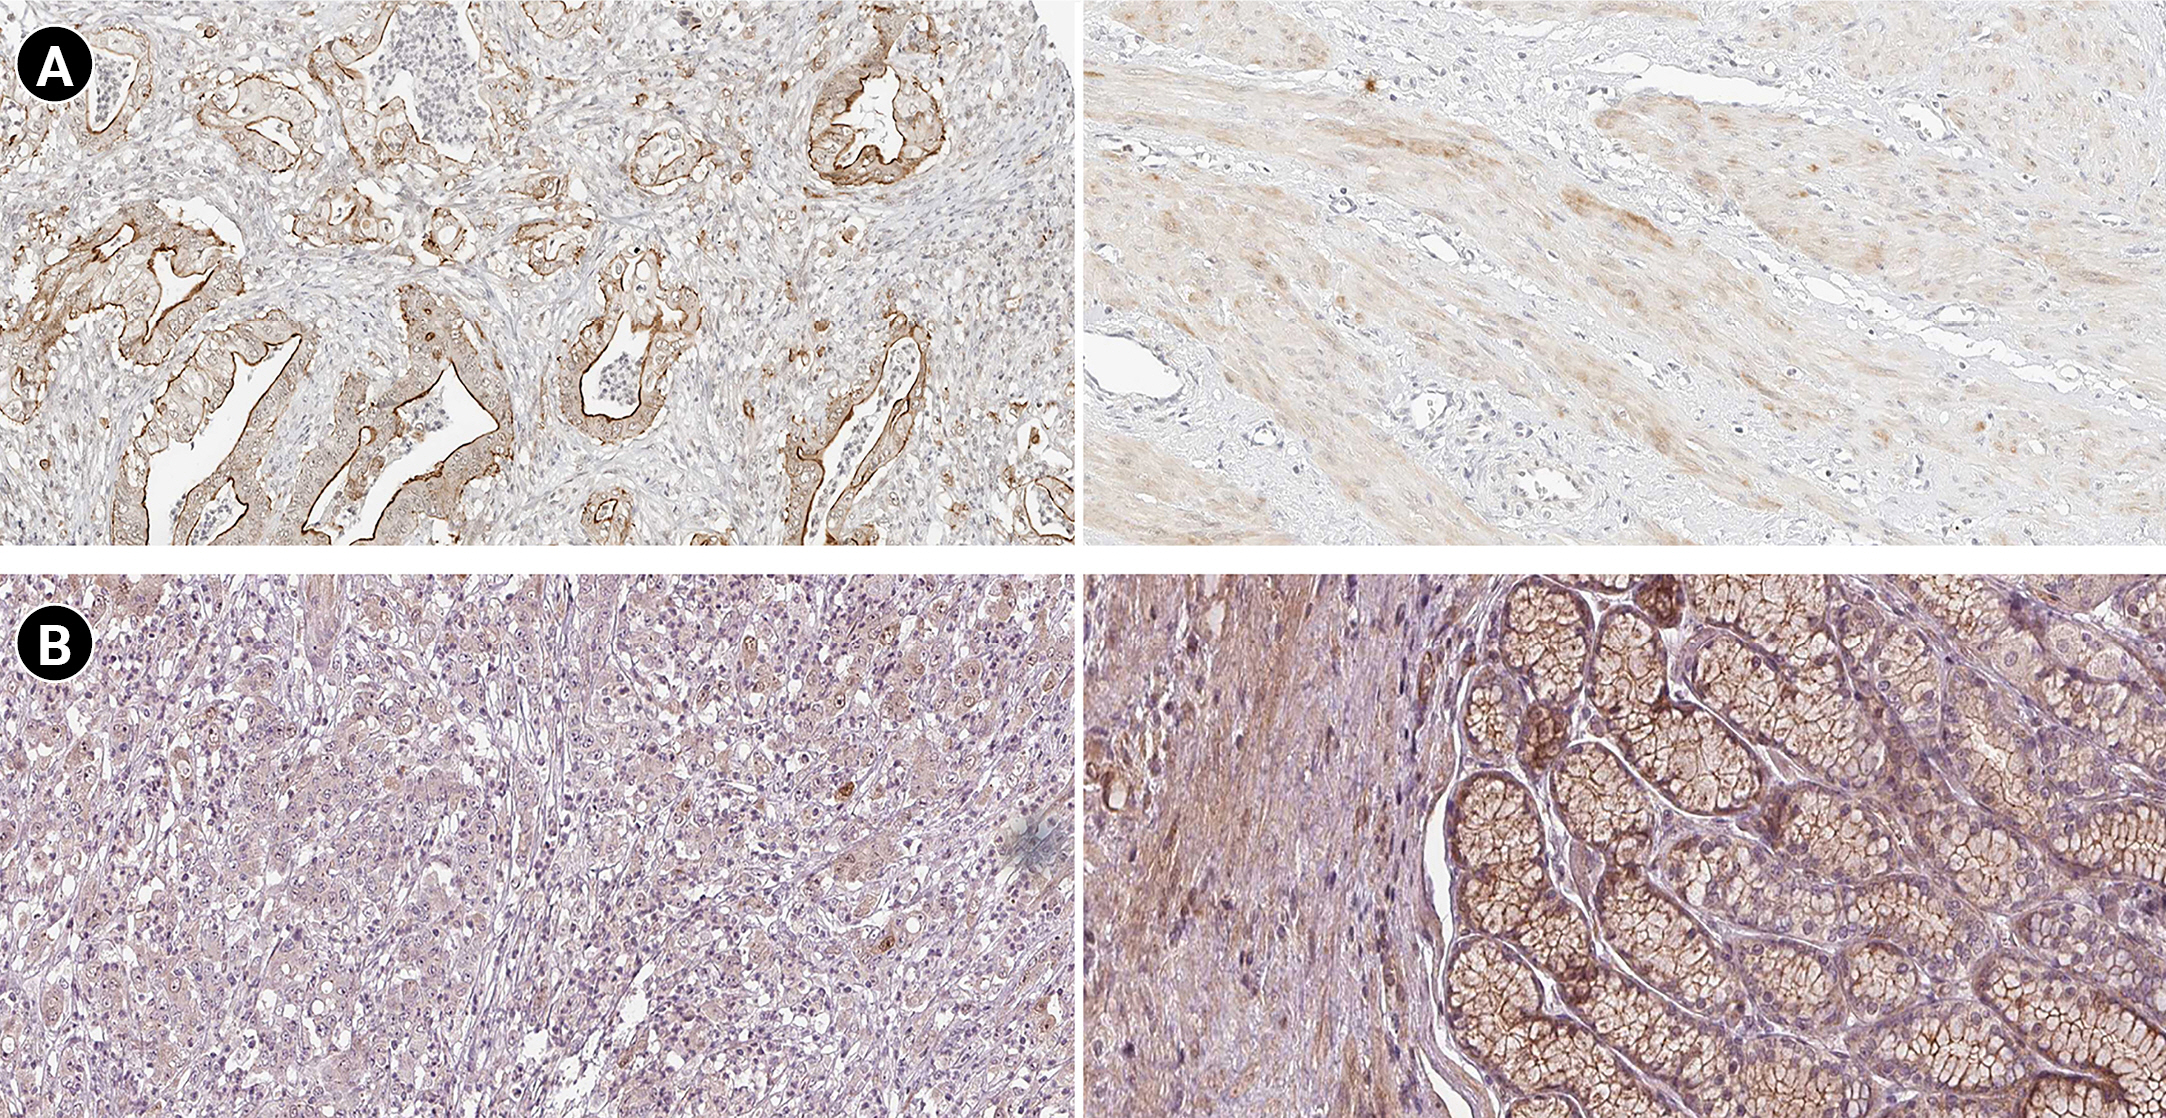
According to the boxplot analysis, the mRNA levels of DOCK4, GNAS, TGFB1, SELE, and SMARCE1 demonstrated a considerably higher expression in gastric adenocarcinoma than in healthy controls. CTGF and MRPS5 showed a mild overexpression in GC compared with normal gastric tissues. Besides, TXNIP illustrated a significant underexpression in GC compared to the healthy control specimens (Fig. 7). Based on the histopathological analysis, GNAS exhibited a higher expression in GC specimens than in healthy control tissues (Fig. 8A). As well, TXNIP expression was lower in stomach cancer compared with the normal gastric samples, consistent with boxplot analysis (Fig. 8B).

Ethical approval

The present study was approved by the Ethics Committee of Isfahan University of Medical Sciences, Isfahan- Iran (ethics no. IR.MUI.RESEARCH.REC.1400.539).

Discussion

GC is one of the prominent carcinoma-related deaths globally, with a dismal mean survival time, although some progress has been made in the diagnostic and therapeutic approaches. H. pylori is the primary human pathogen in the gastric mucosa of almost half of the global population, which participates in developing GC through the regulation of miRNA expression. miRNAs have been noticed as prognostic biomarkers in GC due to their gene regulatory role in cells, such as tumor suppressors and promoter functions [86].
The present study revealed that the most substantial modules of the PIM associated with H. pylori–induced GC were primarily enriched in the ubiquitination system, neddylation pathway, and ciliary process. Moreover, overexpression of DOCK4, GNAS, CTGF, TGF-b1, ESR1, SELE, TIMP3, SMARCE1, and TXNIP was significantly associated with poor prognosis. At the same time, increased expression of MRPS5 revealed a favorable prognosis in patients with GC. Fig. 9 demonstrates the study design and critical points of the present study.
The ubiquitin-proteasome system is an intracellular protein modification pathway that degrades most proteins in mammalian cells [87]. It is executed through ubiquitin-activating enzymes E1, ubiquitin-conjugating enzyme E2, and ubiquitin ligase E3 [88,89]. According to previous studies, dysregulation of E3 ubiquitin enzymes and impropriety targeting of the proteins by E3 leads to many disorders, such as cancer metastasis, including GC [90-93]. Thus, blocking the ubiquitin-proteasome pathways administers a novel approach to treating carcinomas [94].
The Cullin-Ring ligases (CRLs) are involved in the targeted degradation of approximately 20% of cellular proteins [95,96]. It has been reported that the misregulation of CRLs, especially CRL1, is linked to many human disorders, such as cancer [97,98]. Therefore, CRL1 ligase is a potential drug target for cancer treatment [99-102]. Notably, the neddylation of cullins is required to form active CRLs E3 ligases. In the neddylation pathway, the protein NEDD8 is transferred onto the lysine of one of the cullin subunits by the NEDD8-conjugating enzyme and NEDD8-activating enzyme (NAE) [22,27,103,104]. According to previous studies, the neddylation pathway is upregulated in many human malignancies. Therefore, targeting the neddylation pathway by inhibiting NAE has been demonstrated as an effective anticancer strategy in preclinical and clinical settings [98,101,105-108].
A cilium or cilia (plural) are immotile hair-like structures assembled from the cell membrane of almost all eukaryotic cells. Several studies have linked tumorigenesis, tumor-relevant defects, and the deregulation of mammalian target of rapamycin signaling proteins localized at cilia [109,110]. Although the initiation of cancer depends on the presence of cilia in medulloblastoma [111], the loss of cilia has been reported in different types of malignancies such as renal cell carcinoma [112], breast cancer [113,114], and basal cell carcinoma [115].
The dedicator of cytokinesis protein 4 (DOCK4) regulates cell-cell adhesion junction and plays a role in cell metastasis [116-120]. In addition, this gene contributes to many biological processes in mammalians, including tumor cell malignant transformation, proliferation, and metastasis [121]. Overexpression of DOCK4 has been linked to tumor progression and poor survival rate in patients with breast cancer [122] and liver cancer patients [123].
According to a previous study, GNAS mutation could result in tumorigenesis by activating the Wnt signaling pathway [124]. Gastric adenocarcinoma of the fundic gland type (GAFG) is a subclass of gastric adenocarcinoma [125]. Most GAFGs occur in non-atrophic gastric mucosa without H. pylori infections are infrequent branching and anastomosing tubules lined with basophilic columnar cells with mild nuclear atypia resembling chief cells [126]. In addition, pyloric gland adenoma (PGA) is another subtype of GC characterized by atrophic mucosa with constant inflammation as the cause of H. pylori infection [126,127]. Previous studies have linked the GNAS and KRAS (GTPase KRas protein) mutations and the development of PGA [128]. Survival analysis demonstrated that GNAS overexpression is significantly associated with a poor prognosis in GC patients. Besides, the boxplot and immunohistochemical analyses confirmed the GNAS overexpression in GC tissues at the mRNA and protein levels.
It has been shown that higher expression of CTGF in gastric carcinoma contributes to peritoneal and local lymph node metastasis [129,130]. Moreover, CTGF suppression inhibits cellular proliferation and metastasis in GC [131]. Li et al. [132] reported that a higher mRNA expression of CTGF was positively associated with local invasion in GC cells. In addition, lower mRNA levels of CYR61 and CTGF revealed a more prolonged survival time in GC patients. Patients with enhanced CTGF, CYR61 and NOV mRNA levels demonstrated dismal mean survival times.
Previous studies have linked the polymorphism of TGF-b1 C-509T and the risk of promoting GC [133-136]. Chang et al. [69] demonstrated that the TGF-b1-509T allele contributed to TGF-b1 enhanced expression. Its overexpression in normal tissue revealed a potential promoting effect related to H. pylori infection, leading to the progression of intestinal-type GC. Moreover, TGF-b1 was overexpressed in the antrum of H. pylori–positive patients [137], and the TGF-b1 expression was significantly reduced after treating H. pylori infection [138]. Jayapal and Melendez [139] reported that the increased expression of several cytokines, such as TGF-b1, in the gastric antrum is associated with the infection caused by H. pylori. The feedback loop, including TGF-b1, Smad-7, and CTGF, could be involved in the pathogenesis of H. pylori–associated gastritis. CTGF is a downstream effector of TGF-b [140], so overexpression of TGF-b1 and CTGF can cause acute and maintained fibrosis [141].
Trefoil factor 1 (TFF1) is involved in gastric tumor suppression [142-144]; it is lost in more than 50% of GC cells because of epigenetic silencing, TFF1 deletions, or its transcription factors downregulation [145-147]. In breast cancer, estrogen receptor 1 (ESR1) regulates the TFF1 expression. According to the results of other studies and our study, it may be speculated that the enhanced ESR1 expression in GC patients with a dismal outcome is due to the reaction of enhanced tumor size. However, this requires validation.
Zhou et al. [148] reported lower protein and mRNA expression levels of MRPS5 in cancerous gastric tissue compared with the adjacent tissues. This was executed by utilizing the Human Protein Atlas immunohistochemistry source [149] and quantitative real-time polymerase chain reaction (qRT-PCR) analysis. According to previous studies and the results achieved from survival analysis, it may be hypothesized that MRPS5 acts as a tumor suppressor gene in GC and may be assigned as a favorable prognostic gene in GC patients. However, more experiments are required to verify the above.
E-selectin, the protein encoded by the SELE gene, mediates the progression and invasion of GC through different mechanisms, including promoting angiogenesis by activating the Src-PI3K pathway [150,151]. A positive correlation has been observed in GC between the serum expression levels of circulating E-selectin and tumor progression and metastasis, leading to a poor prognosis [152-155]. Liarmakopoulos et al. [150] demonstrated that the E-selectin S128R C allele was related to dismal survival in GC patients.
The aberrant expression of matrix metalloproteinase-3 (MMP-3) and tissue inhibitor of metalloproteinase-3 (TIMP-3) is potentially associated with metastasis in several carcinomas such as NPC [156], cervical cancer [157], breast cancer [158], lung cancer [159], and colon cancer [160]. The Kaplan-Meier analysis from the GEPIA database showed that the overall survival rate of the GC patients with overexpression of TIMP3 was lower than GC patients with down expression of TIMP3. This may be due to the response of increased cancer cell invasion and metastasis, although this requires confirmation.
Liu et al. [161] reported that SMARCE1 was overexpressed in GC cell lines and tissues. In addition, the upregulation of SMARCE1 was significantly linked with the malignant clinicopathological features of GC patients. Moreover, Liu et al. [161] reported that the enhanced SMARCE1 expression was considerably related to a dismal prognosis in GC patients (p < 0.01). As well the enhanced SMARCE1 expression significantly induced the GC cell invasion in vitro, as well as tumorigenesis in vivo.
TXN gene promotes hypoxia-inducible factor-1α, leading to vascular endothelial growth, tumor angiogenesis, and drug resistance [162]. The enhanced TXN expression in tumors has been linked to a worse survival rate of patients in several carcinomas [163,164]. The TXN-interacting protein (TXNIP) suppresses the connection between TXN and other factors. Therefore, TXNIP upregulation attenuates the activity of TXN, leading to decreased proliferation and cell cycle progression in tumor cells [165,166]. Kwon et al. [167] demonstrated that the loss of TXNIP in a mouse model promoted H. pylori–induced GC. Evidence suggests that different ethnicities might affect the gene expression profile in patients with GC [168]. Based on the boxplot and histopathological analyses, it was revealed that TXNIP is downregulated in GC patients at mRNA and protein levels.
Our study had certain limitations. Only eight H. pylori–induced gastric cancerous tissue samples and eight non-tumor tissue samples from patients infected with H. pylori were involved within the GSE54397; therefore, our sample size was not large. Including the more significant number of observations in the dataset may elevate the statistical potential and illustrate more considerable DEMs related to the etiology of H. pylori–induced GC. Besides, the miRNAs profiled in the present study may not support all miRNAs. In future experiments, large targeted groups are needed to verify these markers.
It is suggested that five miRNAs are differentially expressed in patients with H. pylori–induced GC compared to H. pylori–positive patients with non-cancerous tissue (p-value less than 0.01 and |Log2 FC| > 1). In addition, PIM analysis revealed 176 hubs as proteins considerably taking part in the etiology of H. pylori–induced GC. Survival analysis showed that the overexpression of DOCK4, GNAS, CTGF, TGF-b1, ESR1, SELE, TIMP3, SMARCE1, and TXNIP, could lead to a dismal overall survival rate. At the same time, the upregulation of MRPS5 was associated with a good prognosis in GC patients. Therefore, these genes may be cancer markers for prognosis in H. pylori–induced GC. However, more investigations are required in the future to examine the tissue expression of these genes in H. pylori–induced GC and to understand better the exact role that these molecules serve in the carcinogenesis of the disease. In addition to the PIM functional analysis results, we found that the most substantial clusters were primarily enriched in the ubiquitination system, neddylation pathway, and ciliary processes.

Notes

Authors’ Contribution

Conceptualization: AT, FK, MS. Data curation: AT. Formal analysis: AT. Methodology: AT. Writing - original draft: AT. Writing - review & editing: AT, FK, MS.

Conflicts of Interest

No potential conflict of interest relevant to this article was reported.

Acknowledgments

The authors would like to thank the Research Center for Molecular Medicine and the Deputy of Research and Technology, Hamadan University of Medical Sciences, Hamadan - Iran, for their support.

Supplementary Materials

Supplementary data can be found with this article online at http://www.genominfo.org.
Supplementary Table 1.
A total of 176 hub genes were identified in the protein-protein interaction network associated with Helicobacter pylori–induced gastric cancer
gi-22072-Supplementary-Table-1.pdf

Fig. 1.
. (A) The score plot in the predictive (x-axis) and orthogonal (y-axis) components of microarray data achieved from the tissue samples using the orthogonal projections to latent structures discriminant analysis. (B) The volcano plot of the miRNAs in Helicobacter pylori–induced gastric cancer compared to the non-tumor tissue collected from H. pylori–positive patients. (C) The heat map and hierarchical clustering of differentially expressed miRNAs in the two studied tissues. OPLS-DA, orthogonal-partial least squares–discriminant analysis.
gi-22072f1.jpg
Fig. 2.
Module analysis. These genes are validated differentially expressed miRNAs-targets in Helicobacter pylori–induced gastric cancer tissues than H. pylori–positive samples with no cancer symptoms. The interactions between proteins were identified using the STRING knowledge database. The MCODE tool discovered eight substantial clusters in the graph. The hexagons illustrate seed nodes.
gi-22072f2.jpg
Fig. 3.
Top-10 significant pathways (A), biological processes (B), cellular components (C), and molecular functions (D) enriched in Helicobacter pylori–induced gastric cancer patients regarding their false discovery rate. The x-axis demonstrates the pathway and gene ontology term's names, while the y-axis shows –Log10 of false discovery rate.
gi-22072f3.jpg
Fig. 4.
(A) Top-10 hubs based on the degree value. (B) Top-10 hubs according to their betweenness centrality.
gi-22072f4.jpg
Fig. 5.
Survival analysis of DOCK4 (A), GNAS (B), CTGF (C), TGF-b1 (D), ESR1 (E), MRPS5 (F), SELE (G), TIMP3 (H), SMARCE1 (I), and TXNIP (J) genes. Blue and red lines demonstrate under and overexpressed markers, respectively. The y-axis and x-axis illustrate the probability of survival and survival months of patients with gastric cancer, respectively. The dotted lines show a 95% confidence interval. TPM, transcripts per million; HR, hazard ration.
gi-22072f5.jpg
Fig. 6.
Common differentially expressed miRNAs among Helicobacter pylori–induced gastric cancer tissues (case group) and H. pylori–negative (HP–) samples. HP+, H. pylori–positive; Nor, normal; Can, cancer.
gi-22072f6.jpg
Fig. 7.
Gene expression patterns at the mRNA level for prognostic markers in gastric cancer (GC) including DOCK4 (A), GNAS (B), CTGF (C), TGFB1 (D), ESR1 (E), MRPS5 (F), SELE (G), TIMP3 (H), SMARCE1 (I), and TXNIP (J). Box plots are based on 408 GC tissues (red color) and 211 healthy gastric samples (green color). TPM, transcripts per million.
gi-22072f7.jpg
Fig. 8.
Protein expression patterns of GNAS (A) and TXNIP (B) in gastric cancer. The left and right images demonstrate protein staining in cancerous and healthy tissues, respectively.
gi-22072f8.jpg
Fig. 9.
A schematic of the present study's research design and main findings. BP, biological process; CC, cellular component; DEM, differentially expressed miRNA; GC, gastric cancer; MF, molecular function.
gi-22072f9.jpg
Table 1.
Five of the miRNAs were assigned as differential in patients with Helicobacter pylori–induced gastric cancer compared to H. pylori–positive patients with non-cancerous tissue, identified by microarray analysis
miRNA ID FC disease/control ABS Log2 FC p-value
hsa-miR-21 2.86 1.51 0.00353
hsa-miR-18b 2.27 1.18 0.00846
hsa-miR-548a-5p 2.66 1.41 0.00706
hsa-miR-17 3.06 1.61 0.00556
hsa-miR-551b 0.31 1.71 0.0069

FC, fold change; ABS, absolute.

Table 2.
Details of eight substantial clusters in the protein interaction map related to Helicobacter pylori–induced gastric cancer
Cluster No. MCODE score No. of nodes No. of edges Seed node Seed degree Seed betweenness
1 26 26 325 RLIM 32 0.0051
2 20.35 41 407 FOXO3 63 0.0104
3 10.837 44 233 SMAD2 64 0.0118
4 8.957 24 103 MRPS10 23 0.0042
5 6.474 39 123 NA NA NA
8 4.923 40 96 ATF2 33 0.0026
9 4.167 13 25 NA NA NA
15 3.091 12 17 SMARCE1 21 0.0029

NA, not available.

Table 3.
Differentially expressed miRNAs in three datasets selected from GSE54397
Groups of study Total No. of common DEMs miRNA ID
Case vs. HP+ Normal & Case vs. HP– Cancer & Case vs. HP– Normal 1 hsa-miR-551b
Case vs. HP+ Normal & Case vs. HP– Normal 2 hsa-miR-21, hsa-miR-17
Case vs. HP– Cancer & Case vs. HP– Normal 1 hsa-miR-934
Case vs. HP+ Normal 2 hsa-miR-548a-5p, hsa-miR-18b
Case vs. HP– Cancer 28 hsa-miR-1321, hsa-miR-765, hsa-miR-3667-5p, hsa-miR-654-5p, kshv-miR-K12-3, ebv-miR-BART16, hsa-miR-4300, hsa-miR-595, hsa-miR-492, hsa-miR-519e, hcmv-miR-UL112, hsa-miR-4296, hsa-miR-3621, hsa-miR-320c, hsa-miR-1182, hsa-miR-630, hsa-miR-939, ebv-miR-BHRF1-1, hsa-miR-28-3p, hsa-miR-3679-5p, ebv-miR-BART12, hsa-miR-1291, hsa-miR-664, hsa-miR-3187-3p, hsa-miR-708, hsa-miR-3663-5p, kshv-miR-K12-7, hsa-miR-1915
Case vs. HP– Normal 18 hsa-miR-25, hsa-miR-508-3p, hsa-miR-548d-5p, hsa-miR-3117-3p, hsa-miR-1305, hsa-miR-335, hsa-miR-645, hsa-miR-3127-5p, hsa-miR-892b, hsa-miR-1288, ebv-miR-BART19-3p, hsa-miR-3125, hcmv-miR-UL22A, hsa-miR-204, hsa-miR-375, hsa-miR-604, hsa-miR-148a, hsa-let-7c_v16.0

miRNA, microRNA; DEM, differentially expressed miRNA; HP+, Helicobacter pylori–positive; HP–, H. pylori–negative.

References

1. Hayakawa Y, Sethi N, Sepulveda AR, Bass AJ, Wang TC. Oesophageal adenocarcinoma and gastric cancer: should we mind the gap? Nat Rev 2016;16:305–318.
crossref pdf
2. Ferlay J, Soerjomataram I, Dikshit R, Eser S, Mathers C, Rebelo M, et al. Cancer incidence and mortality worldwide: sources, methods and major patterns in GLOBOCAN 2012. Int J Cancer 2015;136:E359–E386.
crossref pmid
3. Zhen Y, Guanghui L, Xiefu Z. Knockdown of EGFR inhibits growth and invasion of gastric cancer cells. Cancer Gene Ther 2014;21:491–497.
crossref pmid pdf
4. Kurokawa Y, Matsuura N, Kawabata R, Nishikawa K, Ebisui C, Yokoyama Y, et al. Prognostic impact of major receptor tyrosine kinase expression in gastric cancer. Ann Surg Oncol 2014;21 Suppl 4:S584–S590.
crossref pmid pdf
5. Nielsen TO, Friis-Hansen L, Poulsen SS, Federspiel B, Sorensen BS. Expression of the EGF family in gastric cancer: downregulation of HER4 and its activating ligand NRG4. PLoS One 2014;9:e94606.
crossref pmid pmc
6. Melo FF, Batista SA, et al. STAT3 polymorphism and Helicobacter pylori CagA strains with higher number of EPIYA-C segments independently increase the risk of gastric cancer. BMC Cancer 2015;15:528.
pmid pmc
7. Polk DB, Peek RM. Helicobacter pylori: gastric cancer and beyond. Nat Rev Cancer 2010;10:403–414.
crossref pmid pmc pdf
8. Chang S, Liu J, Guo S, He S, Qiu G, Lu J, et al. HOTTIP and HOXA13 are oncogenes associated with gastric cancer progression. Oncol Rep 2016;35:3577–3585.
crossref pmid
9. Zhang H, Ma RR, Wang XJ, Su ZX, Chen X, Shi DB, et al. KIF26B, a novel oncogene, promotes proliferation and metastasis by activating the VEGF pathway in gastric cancer. Oncogene 2017;36:5609–5619.
crossref pmid pdf
10. Niu Q, Zhu J, Yu X, Feng T, Ji H, Li Y, et al. Immune response in H. pylori-associated gastritis and gastric cancer. Gastroenterol Res Pract 2020;2020:9342563.
crossref pmid pmc pdf
11. Li Q, Yu H. The role of non-H. pylori bacteria in the development of gastric cancer. Am J Cancer Res 2020;10:2271–2281.
pmid pmc
12. El-Omar EM, Carrington M, Chow WH, McColl KE, Bream JH, Young HA, et al. Interleukin-1 polymorphisms associated with increased risk of gastric cancer. Nature 2000;404:398–402.
crossref pmid pdf
13. Figueiredo C, Machado JC, Pharoah P, Seruca R, Sousa S, Carvalho R, et al. Helicobacter pylori and interleukin 1 genotyping: an opportunity to identify high-risk individuals for gastric carcinoma. J Natl Cancer Inst 2002;94:1680–1687.
crossref pmid
14. El-Omar EM, Rabkin CS, Gammon MD, Vaughan TL, Risch HA, Schoenberg JB, et al. Increased risk of noncardia gastric cancer associated with proinflammatory cytokine gene polymorphisms. Gastroenterology 2003;124:1193–1201.
crossref pmid
15. Machado JC, Figueiredo C, Canedo P, Pharoah P, Carvalho R, Nabais S, et al. A proinflammatory genetic profile increases the risk for chronic atrophic gastritis and gastric carcinoma. Gastroenterology 2003;125:364–371.
crossref pmid
16. Rocha GA, Guerra JB, Rocha AM, Saraiva IE, da Silva DA, de Oliveira CA, et al. IL1RN polymorphic gene and cagA-positive status independently increase the risk of noncardia gastric carcinoma. Int J Cancer 2005;115:678–683.
crossref pmid
17. Gobert AP, Wilson KT. Polyamine- and NADPH-dependent generation of ROS during Helicobacter pylori infection: a blessing in disguise. Free Radic Biol Med 2017;105:16–27.
crossref pmid
18. Peterson AJ, Menheniott TR, O'Connor L, Walduck AK, Fox JG, Kawakami K, et al. Helicobacter pylori infection promotes methylation and silencing of trefoil factor 2, leading to gastric tumor development in mice and humans. Gastroenterology 2010;139:2005–2017.
crossref pmid
19. Cheng AS, Li MS, Kang W, Cheng VY, Chou JL, Lau SS, et al. Helicobacter pylori causes epigenetic dysregulation of FOXD3 to promote gastric carcinogenesis. Gastroenterology 2013;144:122–133.
crossref pmid
20. den Hartog G, Chattopadhyay R, Ablack A, Hall EH, Butcher LD, Bhattacharyya A, et al. Regulation of Rac1 and reactive oxygen species production in response to infection of gastrointestinal epithelia. PLoS Pathog 2016;12:e1005382.
crossref pmid pmc
21. Shin VY, Chu KM. MiRNA as potential biomarkers and therapeutic targets for gastric cancer. World J Gastroenterol 2014;20:10432–10439.
crossref pmid pmc
22. Lan H, Tang Z, Jin H, Sun Y. Neddylation inhibitor MLN4924 suppresses growth and migration of human gastric cancer cells. Sci Rep 2016;6:24218.
crossref pmid pmc pdf
23. Wei J, Zhao ZX, Li Y, Zhou ZQ, You TG. Cortactin expression confers a more malignant phenotype to gastric cancer SGC-7901 cells. World J Gastroenterol 2014;20:3287–3300.
crossref pmid pmc
24. Zhang EB, Kong R, Yin DD, You LH, Sun M, Han L, et al. Long noncoding RNA ANRIL indicates a poor prognosis of gastric cancer and promotes tumor growth by epigenetically silencing of miR-99a/miR-449a. Oncotarget 2014;5:2276–2292.
crossref pmid pmc
25. Han M, Ma L, Qu Y, Tang Y. Decreased expression of the ATM gene linked to poor prognosis for gastric cancer of different nationalities in Xinjiang. Pathol Res Pract 2017;213:908–914.
crossref pmid
26. Villanueva MT. Therapeutics: gastric cancer gets a red carpet treatment. Nat Rev Cancer 2014;14:648.
crossref pdf
27. Hu L, Bai ZG, Ma XM, Bai N, Zhang ZT. MRFAP1 plays a protective role in neddylation inhibitor MLN4924-mediated gastric cancer cell death. Eur Rev Med Pharmacol Sci 2018;22:8273–8280.
pmid
28. Wu Y, Yun D, Zhao Y, Wang Y, Sun R, Yan Q, et al. Down regulation of RNA binding motif, single-stranded interacting protein 3, along with up regulation of nuclear HIF1A correlates with poor prognosis in patients with gastric cancer. Oncotarget 2017;8:1262–1277.
crossref pmid
29. Yan M, Parker BA, Schwab R, Kurzrock R. HER2 aberrations in cancer: implications for therapy. Cancer Treat Rev 2014;40:770–780.
crossref pmid
30. Naruke A, Azuma M, Takeuchi A, Ishido K, Katada C, Sasaki T, et al. Comparison of site-specific gene expression levels in primary tumors and synchronous lymph node metastases in advanced gastric cancer. Gastric Cancer 2015;18:262–270.
crossref pmid pdf
31. Jiang L, Chen Y, Sang J, Li Y, Lan T, Wang Y, et al. Type II cGMP-dependent protein kinase inhibits activation of key members of the RTK family in gastric cancer cells. Biomed Rep 2013;1:399–404.
crossref pmid pmc
32. Nagatsuma AK, Aizawa M, Kuwata T, Doi T, Ohtsu A, Fujii H, et al. Expression profiles of HER2, EGFR, MET and FGFR2 in a large cohort of patients with gastric adenocarcinoma. Gastric Cancer 2015;18:227–238.
crossref pmid pdf
33. Zhang J, Cao J, Li J, Zhang Y, Chen Z, Peng W, et al. A phase I study of AST1306, a novel irreversible EGFR and HER2 kinase inhibitor, in patients with advanced solid tumors. J Hematol Oncol 2014;7:22.
crossref pmid pmc pdf
34. Lim JY, Yoon SO, Hong SW, Kim JW, Choi SH, Cho JY. Thioredoxin and thioredoxin-interacting protein as prognostic markers for gastric cancer recurrence. World J Gastroenterol 2012;18:5581–5588.
crossref pmid pmc
35. Mishra A, Verma M. Cancer biomarkers: are we ready for the prime time? Cancers (Basel) 2010;2:190–208.
crossref pmid pmc
36. Rivera C, Oliveira AK, Costa RAP, De Rossi T, Paes Leme AF. Prognostic biomarkers in oral squamous cell carcinoma: a systematic review. Oral Oncol 2017;72:38–47.
crossref pmid
37. Bao G, Qiao Q, Zhao H, He X. Prognostic value of HMGB1 overexpression in resectable gastric adenocarcinomas. World J Surg Oncol 2010;8:52.
crossref pmid pmc pdf
38. Santini D, Vincenzi B, Fratto ME, Perrone G, Lai R, Catalano V, et al. Prognostic role of human equilibrative transporter 1 (hENT1) in patients with resected gastric cancer. J Cell Physiol 2010;223:384–388.
crossref pmid
39. Ooki A, Yamashita K, Kikuchi S, Sakuramoto S, Katada N, Watanabe M. Phosphatase of regenerating liver-3 as a prognostic biomarker in histologically node-negative gastric cancer. Oncol Rep 2009;21:1467–1475.
pmid
40. Kim JS, Kim MA, Kim TM, Lee SH, Kim DW, Im SA, et al. Biomarker analysis in stage III-IV (M0) gastric cancer patients who received curative surgery followed by adjuvant 5-fluorouracil and cisplatin chemotherapy: epidermal growth factor receptor (EGFR) associated with favourable survival. Br J Cancer 2009;100:732–738.
crossref pmid pmc pdf
41. Kim YJ, Kim MA, Im SA, Kim TM, Kim DW, Yang HK, et al. Metastasis-associated protein S100A4 and p53 predict relapse in curatively resected stage III and IV (M0) gastric cancer. Cancer Invest 2008;26:152–158.
crossref pmid
42. Cui M, Wang H, Yao X, Zhang D, Xie Y, Cui R, et al. Circulating microRNAs in cancer: potential and challenge. Front Genet 2019;10:626.
crossref pmid pmc
43. Deiuliis JA. MicroRNAs as regulators of metabolic disease: pathophysiologic significance and emerging role as biomarkers and therapeutics. Int J Obes (Lond) 2016;40:88–101.
crossref pmid pdf
44. Holley CL, Topkara VK. An introduction to small non-coding RNAs: miRNA and snoRNA. Cardiovasc Drugs Ther 2011;25:151–159.
crossref pmid pdf
45. Portius D, Sobolewski C, Foti M. MicroRNAs-dependent regulation of PPARs in metabolic diseases and cancers. PPAR Res 2017;2017:7058424.
crossref pmid pmc pdf
46. Xie Z, Allen E, Fahlgren N, Calamar A, Givan SA, Carrington JC. Expression of Arabidopsis miRNA genes. Plant Physiol 2005;138:2145–2154.
crossref pmid pmc pdf
47. Michlewski G, Caceres JF. Post-transcriptional control of miRNA biogenesis. RNA 2019;25:1–16.
crossref pmid pmc
48. Lin S, Gregory RI. MicroRNA biogenesis pathways in cancer. Nat Rev Cancer 2015;15:321–333.
crossref pmid pmc pdf
49. Dimova DK, Dyson NJ. The E2F transcriptional network: old acquaintances with new faces. Oncogene 2005;24:2810–2826.
crossref pmid pdf
50. O'Brien J, Hayder H, Zayed Y, Peng C. Overview of microRNA biogenesis, mechanisms of actions, and circulation. Front Endocrinol (Lausanne) 2018;9:402.
pmid pmc
51. Mahfuz A, Zubair-Bin-Mahfuj AM, Podder DJ. A network-biology approach for identification of key genes and pathways involved in malignant peritoneal mesothelioma. Genomics Inform 2021;19:e16.
crossref pmid pmc pdf
52. de la Chapelle A, Jazdzewski K. MicroRNAs in thyroid cancer. J Clin Endocrinol Metab 2011;96:3326–3336.
crossref pmid pmc
53. Erler P, Keutgen XM, Crowley MJ, Zetoune T, Kundel A, Kleiman D, et al. Dicer expression and microRNA dysregulation associate with aggressive features in thyroid cancer. Surgery 2014;156:1342–1350.
crossref pmid
54. Chou CK, Liu RT, Kang HY. MicroRNA-146b: a novel biomarker and therapeutic target for human papillary thyroid cancer. Int J Mol Sci 2017;18:636.
crossref pmid pmc
55. Huang Y, Liao D, Pan L, Ye R, Li X, Wang S, et al. Expressions of miRNAs in papillary thyroid carcinoma and their associations with the BRAFV600E mutation. Eur J Endocrinol 2013;168:675–681.
crossref pmid
56. Ueda T, Volinia S, Okumura H, Shimizu M, Taccioli C, Rossi S, et al. Relation between microRNA expression and progression and prognosis of gastric cancer: a microRNA expression analysis. Lancet Oncol 2010;11:136–146.
crossref pmid
57. Taherkhani A, Farrokhi Yekta R, Mohseni M, Saidijam M, Arefi Oskouie A. Chronic kidney disease: a review of proteomic and metabolomic approaches to membranous glomerulonephritis, focal segmental glomerulosclerosis, and IgA nephropathy biomarkers. Proteome Sci 2019;17:7.
crossref pmid pmc pdf
58. Yang Q, Tian GL, Qin JW, Wu BQ, Tan L, Xu L, et al. Coupling bootstrap with synergy self-organizing map-based orthogonal partial least squares discriminant analysis: stable metabolic biomarker selection for inherited metabolic diseases. Talanta 2020;219:121370.
crossref pmid
59. Draghici S, Khatri P, Eklund AC, Szallasi Z. Reliability and reproducibility issues in DNA microarray measurements. Trends Genet 2006;22:101–109.
crossref pmid
60. Bakay M, Chen YW, Borup R, Zhao P, Nagaraju K, Hoffman EP. Sources of variability and effect of experimental approach on expression profiling data interpretation. BMC Bioinformatics 2002;3:4.
crossref pmid pmc
61. Bammler T, Beyer RP, Bhattacharya S, Boorman GA, Boyles A, Bradford BU, et al. Standardizing global gene expression analysis between laboratories and across platforms. Nat Methods 2005;2:351–356.
crossref pmid pdf
62. Taherkhani A, Moradkhani S, Orangi A, Jalalvand A, Khamverdi Z. Molecular docking study of flavonoid compounds for possible matrix metalloproteinase-13 inhibition. J Basic Clin Physiol Pharmacol 2020;32:1105–1119.
crossref pmid
63. Ho PT, Clark IM, Le LT. MicroRNA-based diagnosis and therapy. Int J Mol Sci 2022;23:7167.
crossref pmid pmc
64. Turchinovich A, Weiz L, Langheinz A, Burwinkel B. Characterization of extracellular circulating microRNA. Nucleic Acids Res 2011;39:7223–7233.
crossref pmid pmc
65. Pattarayan D, Thimmulappa RK, Ravikumar V, Rajasekaran S. Diagnostic potential of extracellular microRNA in respiratory diseases. Clin Rev Allergy Immunol 2018;54:480–492.
crossref pmid pdf
66. Mraz M, Malinova K, Mayer J, Pospisilova S. MicroRNA isolation and stability in stored RNA samples. Biochem Biophys Res Commun 2009;390:1–4.
crossref pmid
67. Bayat Z, Farhadi Z, Taherkhani A. Identification of potential biomarkers associated with poor prognosis in oral squamous cell carcinoma through integrated bioinformatics analysis: a pilot study. Gene Rep 2021;24:101243.
crossref
68. Yue H, Zhu H, Luo D, Du Q, Xie Y, Huang S, et al. Differentially expressed genes in nasopharyngeal carcinoma tissues and their correlation with recurrence and metastasis of nasopharyngeal carcinoma. Comput Math Methods Med 2022;2022:1941412.
crossref pmid pmc pdf
69. Chang H, Kim N, Park JH, Nam RH, Choi YJ, Lee HS, et al. Different microRNA expression levels in gastric cancer depending on Helicobacter pylori infection. Gut Liver 2015;9:188–196.
crossref pmid
70. Barrett T, Wilhite SE, Ledoux P, Evangelista C, Kim IF, Tomashevsky M, et al. NCBI GEO: archive for functional genomics data sets: update. Nucleic Acids Res 2013;41:D991–D995.
crossref pmid
71. Taherkhani A, Dehto SS, Jamshidi S, Shojaei S. Pathogenesis and prognosis of primary oral squamous cell carcinoma based on microRNAs target genes: a systems biology approach. Genomics Inform 2022;20:e27.
crossref pmid pmc pdf
72. Wang Y, Wang YS, Hu NB, Teng GS, Zhou Y, Bai J. Bioinformatics analysis of core genes and key pathways in myelodysplastic syndrome. Zhongguo Shi Yan Xue Ye Xue Za Zhi 2022;30:804–812.
pmid
73. Goedhart J, Luijsterburg MS. VolcaNoseR is a web app for creating, exploring, labeling and sharing volcano plots. Sci Rep 2020;10:20560.
crossref pmid pmc pdf
74. Dweep H, Gretz N. miRWalk2.0: a comprehensive atlas of microRNA-target interactions. Nat Methods 2015;12:697.
crossref pmid pdf
75. Bindea G, Mlecnik B, Hackl H, Charoentong P, Tosolini M, Kirilovsky A, et al. ClueGO: a Cytoscape plug-in to decipher functionally grouped gene ontology and pathway annotation networks. Bioinformatics 2009;25:1091–1093.
crossref pmid pmc pdf
76. von Mering C, Huynen M, Jaeggi D, Schmidt S, Bork P, Snel B. STRING: a database of predicted functional associations between proteins. Nucleic Acids Res 2003;31:258–261.
crossref pmid pmc
77. Shannon P, Markiel A, Ozier O, Baliga NS, Wang JT, Ramage D, et al. Cytoscape: a software environment for integrated models of biomolecular interaction networks. Genome Res 2003;13:2498–2504.
crossref pmid pmc
78. Bayat Z, Mirzaeian A, Taherkhani A. Potential biomarkers and signaling pathways associated with the pathogenesis of primary ameloblastoma: a systems biology approach. Int J Dent 2022;2022:3316313.
crossref pmid pmc pdf
79. Croft D, O'Kelly G, Wu G, Haw R, Gillespie M, Matthews L, et al. Reactome: a database of reactions, pathways and biological processes. Nucleic Acids Res 2011;39:D691–D697.
crossref pmid
80. Li J, Wang Y, Wang X, Yang Q. CDK1 and CDC20 overexpression in patients with colorectal cancer are associated with poor prognosis: evidence from integrated bioinformatics analysis. World J Surg Oncol 2020;18:50.
crossref pmid pmc pdf
81. Oskouie AA, Ahmadi MS, Taherkhani A. Identification of prognostic biomarkers in papillary thyroid cancer and developing non-Invasive diagnostic models through integrated bioinformatics analysis. Microrna 2022;11:73–87.
crossref pmid pdf
82. Bayat Z, Ahmadi-Motamayel F, Parsa MS, Taherkhani A. Potential biomarkers and signaling pathways associated with the pathogenesis of primary salivary gland carcinoma: a bioinformatics study. Genomics Inform 2021;19:e42.
crossref pmid pmc pdf
83. Manoochehri H, Jalali A, Tanzadehpanah H, Taherkhani A, Saidijam M. Identification of key gene targets for sensitizing colorectal cancer to chemoradiation: an integrative network analysis on multiple transcriptomics data. J Gastrointest Cancer 2022;53:649–668.
crossref pmid pdf
84. Tang Z, Li C, Kang B, Gao G, Li C, Zhang Z. GEPIA: a web server for cancer and normal gene expression profiling and interactive analyses. Nucleic Acids Res 2017;45:W98–W102.
crossref pmid pmc
85. Uhlen M, Fagerberg L, Hallstrom BM, Lindskog C, Oksvold P, Mardinoglu A, et al. Proteomics: tissue-based map of the human proteome. Science 2015;347:1260419.
pmid
86. Parizadeh SM, Jafarzadeh-Esfehani R, Avan A, Ghandehari M, Goldani F, Parizadeh SM. The prognostic and predictive value of microRNAs in patients with H. pylori-positive gastric cancer. Curr Pharm Design 2018;24:4639–4645.
crossref pdf
87. Collins GA, Goldberg AL. The logic of the 26S proteasome. Cell 2017;169:792–806.
crossref pmid pmc
88. Pickart CM. Mechanisms underlying ubiquitination. Annu Rev Biochem 2001;70:503–533.
crossref pmid
89. Dye BT, Schulman BA. Structural mechanisms underlying posttranslational modification by ubiquitin-like proteins. Annu Rev Biophys Biomol Struct 2007;36:131–150.
crossref pmid
90. He M, Zhou Z, Wu G, Chen Q, Wan Y. Emerging role of DUBs in tumor metastasis and apoptosis: therapeutic implication. Pharmacol Ther 2017;177:96–107.
crossref pmid pmc
91. Xue J, Lin X, Chiu WT, Chen YH, Yu G, Liu M, et al. Sustained activation of SMAD3/SMAD4 by FOXM1 promotes TGF-beta-dependent cancer metastasis. J Clin Invest 2014;124:564–579.
crossref pmid pmc
92. Wang S, Wu X, Zhang J, Chen Y, Xu J, Xia X, et al. CHIP functions as a novel suppressor of tumour angiogenesis with prognostic significance in human gastric cancer. Gut 2013;62:496–508.
crossref pmid
93. Black JC, Whetstine JR. RNF2 E3 or not to E3: dual roles of RNF2 overexpression in melanoma. Cancer Discov 2015;5:1241–1243.
crossref pmid pmc pdf
94. Qiu D, Wang Q, Wang Z, Chen J, Yan D, Zhou Y, et al. RNF185 modulates JWA ubiquitination and promotes gastric cancer metastasis. Biochim Biophys Acta Mol Basis Dis 2018;1864:1552–1561.
crossref pmid
95. Soucy TA, Smith PG, Milhollen MA, Berger AJ, Gavin JM, Adhikari S, et al. An inhibitor of NEDD8-activating enzyme as a new approach to treat cancer. Nature 2009;458:732–736.
crossref pmid pdf
96. Deshaies RJ, Joazeiro CA. RING domain E3 ubiquitin ligases. Annu Rev Biochem 2009;78:399–434.
crossref pmid
97. Nakayama KI, Nakayama K. Ubiquitin ligases: cell-cycle control and cancer. Nat Rev Cancer 2006;6:369–381.
crossref pmid pdf
98. Zhao Y, Sun Y. Cullin-RING ligases as attractive anti-cancer targets. Curr Pharm Design 2013;19:3215–3225.
crossref
99. Jia L, Sun Y. SCF E3 ubiquitin ligases as anticancer targets. Curr Cancer Drug Targets 2011;11:347–356.
crossref pmid pmc
100. Sun Y. E3 ubiquitin ligases as cancer targets and biomarkers. Neoplasia 2006;8:645–654.
crossref pmid pmc
101. Li H, Tan M, Jia L, Wei D, Zhao Y, Chen G, et al. Inactivation of SAG/RBX2 E3 ubiquitin ligase suppresses KrasG12D-driven lung tumorigenesis. J Clin Invest 2014;124:835–846.
crossref pmid pmc
102. Sun Y, Li H. Functional characterization of SAG/RBX2/ROC2/RNF7, an antioxidant protein and an E3 ubiquitin ligase. Protein Cell 2013;4:103–116.
crossref pmid pdf
103. Enchev RI, Schulman BA, Peter M. Protein neddylation: beyond cullin-RING ligases. Nat Rev Mol Cell Biol 2015;16:30–44.
crossref pmid pmc pdf
104. Zhou L, Zhang W, Sun Y, Jia L. Protein neddylation and its alterations in human cancers for targeted therapy. Cell Signal 2018;44:92–102.
crossref pmid pmc
105. Zhao Y, Morgan MA, Sun Y. Targeting Neddylation pathways to inactivate cullin-RING ligases for anticancer therapy. Antioxid Redox Signal 2014;21:2383–2400.
crossref pmid pmc
106. Li L, Wang M, Yu G, Chen P, Li H, Wei D, et al. Overactivated neddylation pathway as a therapeutic target in lung cancer. J Natl Cancer Inst 2014;106:dju083.
crossref pmid
107. Nawrocki ST, Griffin P, Kelly KR, Carew JS. MLN4924: a novel first-in-class inhibitor of NEDD8-activating enzyme for cancer therapy. Expert Opin Investig Drugs 2012;21:1563–1573.
crossref pmid
108. Swords RT, Erba HP, DeAngelo DJ, Bixby DL, Altman JK, Maris M, et al. Pevonedistat (MLN4924), a first-in-class NEDD8-activating enzyme inhibitor, in patients with acute myeloid leukaemia and myelodysplastic syndromes: a phase 1 study. Br J Haematol 2015;169:534–543.
crossref pmid
109. Tikhmyanova N, Little JL, Golemis EA. CAS proteins in normal and pathological cell growth control. Cell Mol Life Sci 2010;67:1025–1048.
crossref pmid pdf
110. Ji H, Ramsey MR, Hayes DN, Fan C, McNamara K, Kozlowski P, et al. LKB1 modulates lung cancer differentiation and metastasis. Nature 2007;448:807–810.
crossref pmid pdf
111. Han YG, Kim HJ, Dlugosz AA, Ellison DW, Gilbertson RJ, Alvarez-Buylla A. Dual and opposing roles of primary cilia in medulloblastoma development. Nat Med 2009;15:1062–1065.
crossref pmid pmc pdf
112. Schraml P, Frew IJ, Thoma CR, Boysen G, Struckmann K, Krek W, et al. Sporadic clear cell renal cell carcinoma but not the papillary type is characterized by severely reduced frequency of primary cilia. Mod Pathol 2009;22:31–36.
crossref pmid pdf
113. Reilova-Velez J, Seiler MW. Abnormal cilia in a breast carcinoma: an ultrastructural study. Arch Pathol Lab Med 1984;108:795–797.
pmid
114. Yuan K, Frolova N, Xie Y, Wang D, Cook L, Kwon YJ, et al. Primary cilia are decreased in breast cancer: analysis of a collection of human breast cancer cell lines and tissues. J Histochem Cytochem 2010;58:857–870.
crossref pmid pmc pdf
115. Wong SY, Seol AD, So PL, Ermilov AN, Bichakjian CK, Epstein EH Jr, et al. Primary cilia can both mediate and suppress Hedgehog pathway-dependent tumorigenesis. Nat Med 2009;15:1055–1061.
crossref pmid pmc pdf
116. Jansen S, Gosens R, Wieland T, Schmidt M. Paving the Rho in cancer metastasis: Rho GTPases and beyond. Pharmacol Ther 2018;183:1–21.
crossref pmid
117. Zhang H, Nie W, Zhang X, Zhang G, Li Z, Wu H, et al. NEDD4-1 regulates migration and invasion of glioma cells through CNrasGEF ubiquitination in vitro. PLoS One 2013;8:e82789.
crossref pmid pmc
118. Yan D, Li F, Hall ML, Sage C, Hu WH, Giallourakis C, et al. An isoform of GTPase regulator DOCK4 localizes to the stereocilia in the inner ear and binds to harmonin (USH1C). J Mol Biol 2006;357:755–764.
crossref pmid
119. Hiramoto-Yamaki N, Takeuchi S, Ueda S, Harada K, Fujimoto S, Negishi M, et al. Ephexin4 and EphA2 mediate cell migration through a RhoG-dependent mechanism. J Cell Biol 2010;190:461–477.
crossref pmid pmc pdf
120. The UniProt Consortium. UniProt: the universal protein knowledgebase. Nucleic Acids Res 2017;45:D158–D169.
crossref pmid
121. Ungefroren H, Witte D, Lehnert H. The role of small GTPases of the Rho/Rac family in TGF-beta-induced EMT and cell motility in cancer. Dev Dyn 2018;247:451–461.
crossref pmid pdf
122. Westbrook JA, Wood SL, Cairns DA, McMahon K, Gahlaut R, Thygesen H, et al. Identification and validation of DOCK4 as a potential biomarker for risk of bone metastasis development in patients with early breast cancer. J Pathol 2019;247:381–391.
crossref pmid pmc pdf
123. Li H, Wang M, Zhou H, Lu S, Zhang B. Long noncoding RNA EBLN3P promotes the progression of liver cancer via alteration of microRNA-144-3p/DOCK4 signal. Cancer Manag Res 2020;12:9339–9349.
pmid pmc
124. Wilson CH, McIntyre RE, Arends MJ, Adams DJ. The activating mutation R201C in GNAS promotes intestinal tumourigenesis in Apc(Min/+) mice through activation of Wnt and ERK1/2 MAPK pathways. Oncogene 2010;29:4567–4575.
crossref pmid pmc pdf
125. Ueyama H, Yao T, Nakashima Y, Hirakawa K, Oshiro Y, Hirahashi M, et al. Gastric adenocarcinoma of fundic gland type (chief cell predominant type): proposal for a new entity of gastric adenocarcinoma. Am J Surg Pathol 2010;34:609–619.
crossref pmid
126. Ikuta K, Seno H, Chiba T. Molecular changes leading to gastric cancer: a suggestion from rare-type gastric tumors with GNAS mutations. Gastroenterology 2014;146:1417–1418.
crossref pmid
127. Vieth M, Kushima R, Borchard F, Stolte M. Pyloric gland adenoma: a clinico-pathological analysis of 90 cases. Virchows Arch 2003;442:317–321.
crossref pmid pdf
128. Matsubara A, Sekine S, Kushima R, Ogawa R, Taniguchi H, Tsuda H, et al. Frequent GNAS and KRAS mutations in pyloric gland adenoma of the stomach and duodenum. J Pathol 2013;229:579–587.
crossref pmid
129. Liu L, Li Z, Feng G, You W, Li J. Expression of connective tissue growth factor is in agreement with the expression of VEGF, VEGF-C, -D and associated with shorter survival in gastric cancer. Pathol Int 2007;57:712–718.
crossref pmid
130. Liu LY, Han YC, Wu SH, Lv ZH. Expression of connective tissue growth factor in tumor tissues is an independent predictor of poor prognosis in patients with gastric cancer. World J Gastroenterol 2008;14:2110–2114.
crossref pmid pmc
131. Jiang CG, Lv L, Liu FR, Wang ZN, Liu FN, Li YS, et al. Downregulation of connective tissue growth factor inhibits the growth and invasion of gastric cancer cells and attenuates peritoneal dissemination. Mol Cancer 2011;10:122.
crossref pmid pmc pdf
132. Li J, Gao X, Ji K, Sanders AJ, Zhang Z, Jiang WG, et al. Differential expression of CCN family members CYR611, CTGF and NOV in gastric cancer and their association with disease progression. Oncol Rep 2016;36:2517–2525.
crossref pmid pmc
133. Guo W, Dong Z, Guo Y, Chen Z, Yang Z, Kuang G, et al. Polymorphisms of transforming growth factor-beta1 associated with increased risk of gastric cardia adenocarcinoma in north China. Int J Immunogenet 2011;38:215–224.
pmid
134. Bhayal AC, Prabhakar B, Rao KP, Penchikala A, Ayesha Q, Jyothy A, et al. Role of transforming growth factor-beta1 -509 C/T promoter polymorphism in gastric cancer in south Indian population. Tumour Biol 2011;32:1049–1053.
pmid
135. Lin XD, Li C, Shi Y, Chen Y, Zhang LY, Zheng XW. Correlation of polymorphism of Nme1-1465 T>C and TGFbeta1-509 T>C with genetic susceptibility of gastric carcinoma. Zhonghua Bing Li Xue Za Zhi 2010;39:681–685.
pmid
136. Zhang P, Di JZ, Zhu ZZ, Wu HM, Wang Y, Zhu G, et al. Association of transforming growth factor-beta 1 polymorphisms with genetic susceptibility to TNM stage I or II gastric cancer. Jpn J Clin Oncol 2008;38:861–866.
crossref pmid
137. Lindholm C, Quiding-Jarbrink M, Lonroth H, Hamlet A, Svennerholm AM. Local cytokine response in Helicobacter pylori-infected subjects. Infect Immun 1998;66:5964–5971.
crossref pmid pmc pdf
138. Messa C, Di Leo A, Greco B, Caradonna L, Amati L, Linsalata M, et al. Successful eradicating treatment of Helicobacter pylori in patients with chronic gastritis: gastric levels of cytokines, epidermal growth factor and polyamines before and after therapy. Immunopharmacol Immunotoxicol 1996;18:1–13.
pmid
139. Jayapal M, Melendez AJ. DNA microarray technology for target identification and validation. Clin Exp Pharmacol Physiol 2006;33:496–503.
crossref pmid
140. Leask A, Holmes A, Black CM, Abraham DJ. Connective tissue growth factor gene regulation: requirements for its induction by transforming growth factor-beta 2 in fibroblasts. J Biol Chem 2003;278:13008–13015.
pmid
141. Ball DK, Moussad EE, Rageh MA, Kemper SA, Brigstock DR. Establishment of a recombinant expression system for connective tissue growth factor (CTGF) that models CTGF processing in utero. Reproduction 2003;125:271–284.
crossref pmid
142. Rio MC, Bellocq JP, Daniel JY, Tomasetto C, Lathe R, Chenard MP, et al. Breast cancer-associated pS2 protein: synthesis and secretion by normal stomach mucosa. Science 1988;241:705–708.
crossref pmid
143. Soutto M, Peng D, Katsha A, Chen Z, Piazuelo MB, Washington MK, et al. Activation of beta-catenin signalling by TFF1 loss promotes cell proliferation and gastric tumorigenesis. Gut 2015;64:1028–1039.
crossref pmid
144. Soutto M, Belkhiri A, Piazuelo MB, Schneider BG, Peng D, Jiang A, et al. Loss of TFF1 is associated with activation of NF-kappaB-mediated inflammation and gastric neoplasia in mice and humans. J Clin Invest 2011;121:1753–1767.
crossref pmid pmc
145. Carvalho R, Kayademir T, Soares P, Canedo P, Sousa S, Oliveira C, et al. Loss of heterozygosity and promoter methylation, but not mutation, may underlie loss of TFF1 in gastric carcinoma. Lab Invest 2002;82:1319–1326.
crossref pmid
146. Tomita H, Takaishi S, Menheniott TR, Yang X, Shibata W, Jin G, et al. Inhibition of gastric carcinogenesis by the hormone gastrin is mediated by suppression of TFF1 epigenetic silencing. Gastroenterology 2011;140:879–891.
crossref pmid
147. McChesney PA, Aiyar SE, Lee OJ, Zaika A, Moskaluk C, Li R, et al. Cofactor of BRCA1: a novel transcription factor regulator in upper gastrointestinal adenocarcinomas. Cancer Res 2006;66:1346–1353.
crossref pmid pdf
148. Zhou L, Wu Y, Xin L, Zhou Q, Li S, Yuan Y, et al. Development of RNA binding proteins expression signature for prognosis prediction in gastric cancer patients. Am J Transl Res 2020;12:6775–6792.
pmid pmc
149. Luck K, Kim DK, Lambourne L, Spirohn K, Begg BE, Bian W, et al. A reference map of the human binary protein interactome. Nature 2020;580:402–408.
pmid pmc
150. Liarmakopoulos E, Gazouli M, Aravantinos G, Theodoropoulos G, Rizos S, Vaiopoulou A, et al. E-Selectin S128R gene polymorphism in gastric cancer. Int J Biol Markers 2013;28:38–42.
crossref pmid pdf
151. Xia HZ, Du WD, Wu Q, Chen G, Zhou Y, Tang XF, et al. E-selectin rs5361 and FCGR2A rs1801274 variants were associated with increased risk of gastric cancer in a Chinese population. Mol Carcinog 2012;51:597–607.
crossref pmid pdf
152. Alexiou D, Karayiannakis AJ, Syrigos KN, Zbar A, Sekara E, Michail P, et al. Clinical significance of serum levels of E-selectin, intercellular adhesion molecule-1, and vascular cell adhesion molecule-1 in gastric cancer patients. Am J Gastroenterol 2003;98:478–485.
crossref pmid
153. Yoo NC, Chung HC, Chung HC, Park JO, Rha SY, Kim JH, et al. Synchronous elevation of soluble intercellular adhesion molecule-1 (ICAM-1) and vascular cell adhesion molecule-1 (VCAM-1) correlates with gastric cancer progression. Yonsei Med J 1998;39:27–36.
crossref pmid
154. Ke JJ, Shao QS, Ling ZQ. Expression of E-selectin, integrin beta1 and immunoglobulin superfamily member in human gastric carcinoma cells and its clinicopathologic significance. World J Gastroenterol 2006;12:3609–3611.
pmid pmc
155. Maruo Y, Gochi A, Kaihara A, Shimamura H, Yamada T, Tanaka N, et al. ICAM-1 expression and the soluble ICAM-1 level for evaluating the metastatic potential of gastric cancer. Int J Cancer 2002;100:486–490.
crossref pmid
156. Li YH, Shao JY, Li S, Zou BY, Huang HQ, Guan ZZ. Clinical significance of quantitative analysis of serum VEGF, CD44s, and MMP-3 protein in nasopharyngeal carcinoma. Ai Zheng 2004;23:1060–1064.
pmid
157. Arguello-Ramirez J, Perez-Cardenas E, Delgado-Chavez R, Solorza-Luna G, Villa-Trevino S, Arenas-Huertero F. Matrix metalloproteinases-2, -3, and -9 secreted by explants of benign and malignant lesions of the uterine cervix. Int J Gynecol Cancer 2004;14:333–340.
crossref pmid
158. Mylona E, Magkou C, Giannopoulou I, Agrogiannis G, Markaki S, Keramopoulos A, et al. Expression of tissue inhibitor of matrix metalloproteinases (TIMP)-3 protein in invasive breast carcinoma: relation to tumor phenotype and clinical outcome. Breast Cancer Res 2006;8:R57.
crossref pmid pmc pdf
159. Mino N, Takenaka K, Sonobe M, Miyahara R, Yanagihara K, Otake Y, et al. Expression of tissue inhibitor of metalloproteinase-3 (TIMP-3) and its prognostic significance in resected non-small cell lung cancer. J Surg Oncol 2007;95:250–257.
crossref pmid
160. Islekel H, Oktay G, Terzi C, Canda AE, Fuzun M, Kupelioglu A. Matrix metalloproteinase-9,-3 and tissue inhibitor of matrix metalloproteinase-1 in colorectal cancer: relationship to clinicopathological variables. Cell Biochem Funct 2007;25:433–441.
crossref pmid
161. Liu H, Zhao YR, Chen B, Ge Z, Huang JS. High expression of SMARCE1 predicts poor prognosis and promotes cell growth and metastasis in gastric cancer. Cancer Manag Res 2019;11:3493–3509.
pmid pmc
162. Welsh SJ, Bellamy WT, Briehl MM, Powis G. The redox protein thioredoxin-1 (Trx-1) increases hypoxia-inducible factor 1alpha protein expression: Trx-1 overexpression results in increased vascular endothelial growth factor production and enhanced tumor angiogenesis. Cancer Res 2002;62:5089–5095.
pmid
163. Ungerstedt JS, Sowa Y, Xu WS, Shao Y, Dokmanovic M, Perez G, et al. Role of thioredoxin in the response of normal and transformed cells to histone deacetylase inhibitors. Proc Natl Acad Sci U S A 2005;102:673–678.
crossref pmid pmc
164. Kim SJ, Miyoshi Y, Taguchi T, Tamaki Y, Nakamura H, Yodoi J, et al. High thioredoxin expression is associated with resistance to docetaxel in primary breast cancer. Clin Cancer Res 2005;11:8425–8430.
crossref pmid pdf
165. Junn E, Han SH, Im JY, Yang Y, Cho EW, Um HD, et al. Vitamin D3 up-regulated protein 1 mediates oxidative stress via suppressing the thioredoxin function. J Immunol 2000;164:6287–6295.
crossref pmid pdf
166. Nishinaka Y, Nishiyama A, Masutani H, Oka S, Ahsan KM, Nakayama Y, et al. Loss of thioredoxin-binding protein-2/vitamin D3 up-regulated protein 1 in human T-cell leukemia virus type I-dependent T-cell transformation: implications for adult T-cell leukemia leukemogenesis. Cancer Res 2004;64:1287–1292.
pmid
167. Kwon HJ, Won YS, Nam KT, Yoon YD, Jee H, Yoon WK, et al. Vitamin D(3) upregulated protein 1 deficiency promotes N-methyl-N-nitrosourea and Helicobacter pylori-induced gastric carcinogenesis in mice. Gut 2012;61:53–63.
crossref pmid
168. Ossandon FJ, Villarroel C, Aguayo F, Santibanez E, Oue N, Yasui W, et al. In silico analysis of gastric carcinoma serial analysis of gene expression libraries reveals different profiles associated with ethnicity. Mol Cancer 2008;7:22.
crossref pmid pmc pdf
TOOLS
Share :
Facebook Twitter Linked In Google+
METRICS Graph View
  • 1 Crossref
  • 0 Scopus
  • 2,536 View
  • 117 Download
Related articles in GNI


ABOUT
ARTICLE CATEGORY

Browse all articles >

BROWSE ARTICLES
FOR CONTRIBUTORS
Editorial Office
Room No. 806, 193 Mallijae-ro, Jung-gu, Seoul 04501, Korea
Tel: +82-2-558-9394    Fax: +82-2-558-9434    E-mail: kogo3@kogo.or.kr                

Copyright © 2024 by Korea Genome Organization.

Developed in M2PI

Close layer
prev next