Introduction
Kruppel-like factors (KLFs) are zinc-finger transcription factors considered to be crucial regulators of cell differentiation, development, and cell cycle progression [1]. Each KLF has its own function and acts as a transcriptional activator or repressor, depending on the promoters [2]. Several features distinguish KLFs from the highly conserved classical zinc-finger transcription factors [2, 3]. Zinc-fingers are located at the carboxyl terminus of the protein and permit KLFs to bind to related GC- and CACCC-boxes of DNA [4]. In contrast to the zinc-finger regions, the non-DNA-binding regions are highly controversial, regulate activation and repression, and often mediate interaction of protein-protein [3].
Recently, a potential role for KLFs in adipogenesis has been suggested [5]. For example, KLF5 and KLF2 are expressed in 3T3-L1 preadipocytes and bind directly to the peroxisome proliferator-activated receptor
γ2 (PPARγ2) promoter or inhibit its activity [6]. KLF5 (also known as BTEB2 or IKLF) was first identified as a transcription factor for SMemb/non-muscle myosin heavy chain-B (NMHC-B), a marker of smooth muscle cells in vascular disease [7]. KLF5 upregulates in activated smooth muscle cells or fibroblasts of vascular lesions and downregulates in adult vessels [7, 8] KLF5 binds directly to the PPARγ promoter, and PPARγ activity can be enhanced by either C/EBPβ or C/EBPδ [4]. Therefore, several studies suggested KLF5 is downstream of C/EBPβ or C/EBPδ and upstream of PPARγ during adipocyte differentiation [4, 5]. Just like KLF2, KLF5 might contribute to adipogenesis transcriptional regulation via PPARγ. KLF15 induces differentiation of 3T3-L1 in the late stage and expression of the glucose transporter GLUT4 [9]. KLF7 is expressed in adipocytes, as well as several human tissues, such as pancreas, skeletal muscle, and liver [10]. However, the functions of these KLFs in adipocyte differentiation in vivo remain unclear.
The prevalence of overweight and obesity is increasing worldwide. The imbalance between energy expenditures and energy intakes causes excessive fat accumulation, leading to an increase of the number and/or size of fat cells [4]. Basal metabolic rate (BMR) is the minimum energy required to retain the physiological functions of the body while awake. BMR accounts for approximately 45% to 70% of total energy expenditure in most healthy adults and is affected by age, gender, body surface area, body composition, genetic composition, pregnancy, and hormonal status directly [11, 12]. Thus, estimating BMR is important for establishing strategies of obesity prevention programs [11]. For several years, numerous predictive equations for BMR have been developed in different populations. Although many studies have shown the influence of ethnicity on BMR, their results have been inconsistent [11, 12].
On the other hand, resting metabolic rate (RMR) is also the energy requirement to support vital functions while resting in the supine position. Just like the BMR, RMR is quantitatively the largest component of daily energy expenditure (60-75%). In order to evaluate RMR, direct and indirect calorimeters, such as whole-room calorimeters, open-circuit Douglas bag method, metabolic carts, and ventilated hood systems, are required, and these methods are not helpful nor cost-effective for large-scale epidemiological studies. Therefore, regression equations have been used to estimate resting energy requirements in large populations [13].
So far, several studies have suggested that uncoupling protein 2 (UCP2) is involved in the regulation of energy expenditure metabolism, body weight, and obesity [14]. In other studies, the polymorphism of the uncoupling protein 1 (UCP1) gene did not have an independent effect on BMR; however, its synergistic effect with the beta3-AR gene polymorphism induced a lower BMR than the polymorphism of beta3-AR gene alone [15]. Recently, to investigate the clinical relevance of KLF5 in complex diseases, such as cardiovascular disease, several single-nucleotide polymorphisms (SNPs) within KLF5 have been analyzed; however, an association of KLF5 SNPs with BMR of children has not been identified yet. The purpose of this study is 1) to identify the contribution of novel genetic variations of KLF5 to increased BMR and the suppression of obesity in Korean children and 2) to make better use of the alterations of KLF5 in future clinical intervention studies.
Methods
Study population
A total of 62 eligible subjects were recruited from 3rd grade to 6th grade students of elementary schools in 2005. Ethical permission for the study was obtained from the Institutional Review Boards, and all subjects provided written informed consent. Demographics of age, gender, weight, height, body mass index (BMI), fat mass, muscle, waist-hip ratio (WHR), and BMR, as well as skinfold thickness, lipid profile, and hematological data, were also recorded. All variables were measured for developing the predictive equation model of BMR.
Anthropometric measurements
All measurements were made using standard techniques. The standing height was measured with a stadiometer (Jenix) attached to a wall. Weight, height, fat mass, muscle mass, and WHR were measured by bioelectrical impedance analysis (Inbody 720; Biospace, Seoul, Korea). BMI was calculated by dividing weight (kg) by the square of height (m). Subjects were divided into two groups by the 85 percentile of BMI values. Children with normal weight were the lower BMI group (BMI < 85th), and the higher BMI group was overweight (BMI ≥ 85th). Also, Rohrer index (RI) was measured by height and weight for obesity judgment. Skinfold thickness of the triceps and subscapular and suprailiac regions were measured by caliper (Cambridge Scientific Industries, Cambridge, MD, USA).
RMR and BMR measurements
RMR was measured using a MedGem metabolic analyzer (Microlife USA, Dunedin, FL, USA) [16]. This device is a handheld indirect calorimeter used for its accuracy and portability in clinical settings and is becoming popular in research studies as a screening tool and a criterion measure of RMR. This device calculates RMR using florescent quenching of ruthenium in the presence of oxygen and the modified Weir equation, with an assumed respiration quotient of 0.85 to estimate carbon dioxide production [17].
Prior to each measurement, the MedGem was autocalibrated on zero airflow according to the manufacturer's instructions. Participants rested in the supine position on a dormitory bed with a pillow for 15 min in a climate-controlled laboratory, where lights were dimmed and the setting was quiet. Following this rest period, participants were asked to breathe through a mouthpiece in a relaxed fashion for approximately 7-10 min, depending on the stability of the VO2 measures. The participants were allowed to hold the mouthpiece in their mouth during the measurement if they felt it necessary. Once the participant had reached steady-state oxygen consumption, as measured by the MedGem, data collection was completed. If the children were unable to reach steady-state oxygen consumption in the allotted time of approximately 10 min, the test was terminated at 10 min by the device, and RMR was calculated as a mathematical average from the final 8 min of data collection. The MedGem then calculated steady-state RMR for a 24-h period (kcal/day) [13]. BMR was measured using indirect calorimetry. All measurements were repeated three times.
Blood biochemistry
Blood samples were collected after 12-h fasting and were immediately placed in 4℃. For genotyping, whole blood was collected in ethylenediaminetetraacetic acid-treated tubes. For other blood profiles, blood samples were collected in serum separator tubes and centrifuged at 3,000 rpm for 20 min at 4℃. Serum samples were frozen at -80℃ until used. Levels of total cholesterol (TC), triglyceride (TG), high-density lipoprotein cholesterol (HDL-C), apolipoprotein B, apolipoprotein A1, and C-reactive protein were measured by an auto analyzer (Boeringer Mannheim, Mannheim, Germany). Low-density lipoprotein cholesterol (LDL-C) was calculated as described by the Friedewald and Laucer equation [18, 19]: LDL-C = TC - HDL-C-(TG/5). Levels of fasting glucose were measured by using an autoanalyzer (Ekachem DTSC module; Johnson & Johnson, New Brunswick, NJ, USA). Fasting insulin was measured by glucotrend (Roche, Mannheim, Germany), and homeostasis model assessment of insulin resistance (HOMA-IR) was calculated as described by Matthews equation [20]: HOMA-IR = fasting glucose (mmol/L)/22.5 × insulin (µL/mL), fasting glucose (mmol/L) = fasting glucose (mg/mL) × 0.0555.
Analysis of the KLF5 SNP
The polymorphisms for the KLF5 (rs3782933) gene were analyzed (http://www.ncbi.nlm.gov/). For each sample, the genomic DNA was isolated from whole blood using the QIAamp DNA blood mini kit (Qiagen, Valencia, CA, USA) according to the supplier's instructions. PCR was performed using the Takara DNA Polymerase Kit (Takara Bio Inc, Shiga, Japan). All the primers for PCR amplification and DNA sequencing were designed using the Primer3 software (http://Frodo.wi.mit.edu/cgi-bin/primer3/primer3); the sequences are available upon request. PCR reactions were carried out in a final volume of 25 µL containing 10× buffer, 1.5 mmol/L MgCl2, 20 µmol/L dNTP, 0.5 µmol/L of each primer, 10 ng of genomic DNA as template, and 0.5 U polymerase. Each PCR product was purified and subjected to DNA sequencing by using the QIAquick PCR purification Kit (Qiagen) and the ABI Prism genetic analyzer (Applied Biosystems, Foster City, CA, USA) after confirming the purity and mobility of each PCR product by agarose gel electrophoresis. Each sample was sequenced for both strands to confirm results.
Statistical analysis
The results are presented as mean ± standard error range. p-values for each genotype and allele were evaluated by χ2 analysis and Fisher's exact test. A p-value of <0.05 was considered to indicate a statistically significant difference between obese subjects and normal-weight subjects of the study. Associations of clinical variables, such as age, BMI, height, weight, and BMR, were analyzed by Pearson correlation test. Multiple linear regression analysis was performed to develop a BMR equation. All analyses were performed using SPSS version 18.0 (SPSS Inc., Chicago, IL, USA).
Results
Distribution of genotypes and alleles of KLF5 gene
The recruited 62 children were aged 11.51 ± 0.97 y, and girls made up more than half of the children recruited (n = 33, 53.2%). Mean BMI estimated from height and weight was 20.26 ± 3.41 kg/m2. The average BMR was 1,018.42 ± 113.86 kcal/day, and muscle averaged 28.26 ± 4.99 kg (data not shown). Children with the C allele were nearly twice those with the T allele in each group. In the overweight group, allele frequencies were 67.6% for C allele and 32.4% for T allele. However, we found no statistical significance between the frequencies of alleles and genotypes in two groups (Table 1). On the other hand, four children had TT genotype in the high-BMR group and only one child had TT genotype in the low-BMR group. Thus, four in five children with the TT genotype belong to the high-BMR group. However, there were no differences of alleles and genotypes in the low- and high-BMR groups (Table 1).
Clinical characteristics of 62 children according to genotype of rs3782933
The p-values for Hardy-Weinberg equilibrium and minor allele frequency of KLF rs3782933 were 0.8286 and 0.3333, respectively. The SNP of KLF5 showed significant differences with several clinical factors, such as BMR, muscle, LDL-C, insulin, and C-peptide (Table 2). Children with the TT genotype had significantly higher BMR than those with the wild-type (CC genotype) (p = 0.030). The highly correlated factors with BMR, such as height and muscle composition, were also higher in children with the TT genotype than those with the CC genotype (p = 0.032). The diabetic factors, such as insulin and C-peptide, were also higher in the children with the TT genotype than those with the CC genotype (p =0.029 vs. p = 0.004, respectively) (Table 2). On the other hand, the alleles of the KLF5 gene showed a divergent trend when compared with the genotype. For example, the children with the T allele had significantly lower TC and LDL-C than those with the C allele, regardless of BMR (Table 3).
Risk factors related to BMR
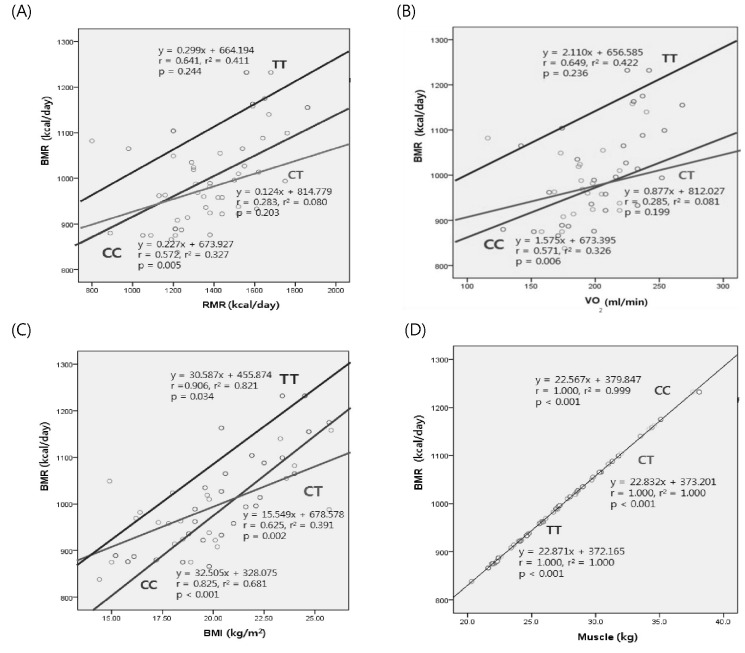
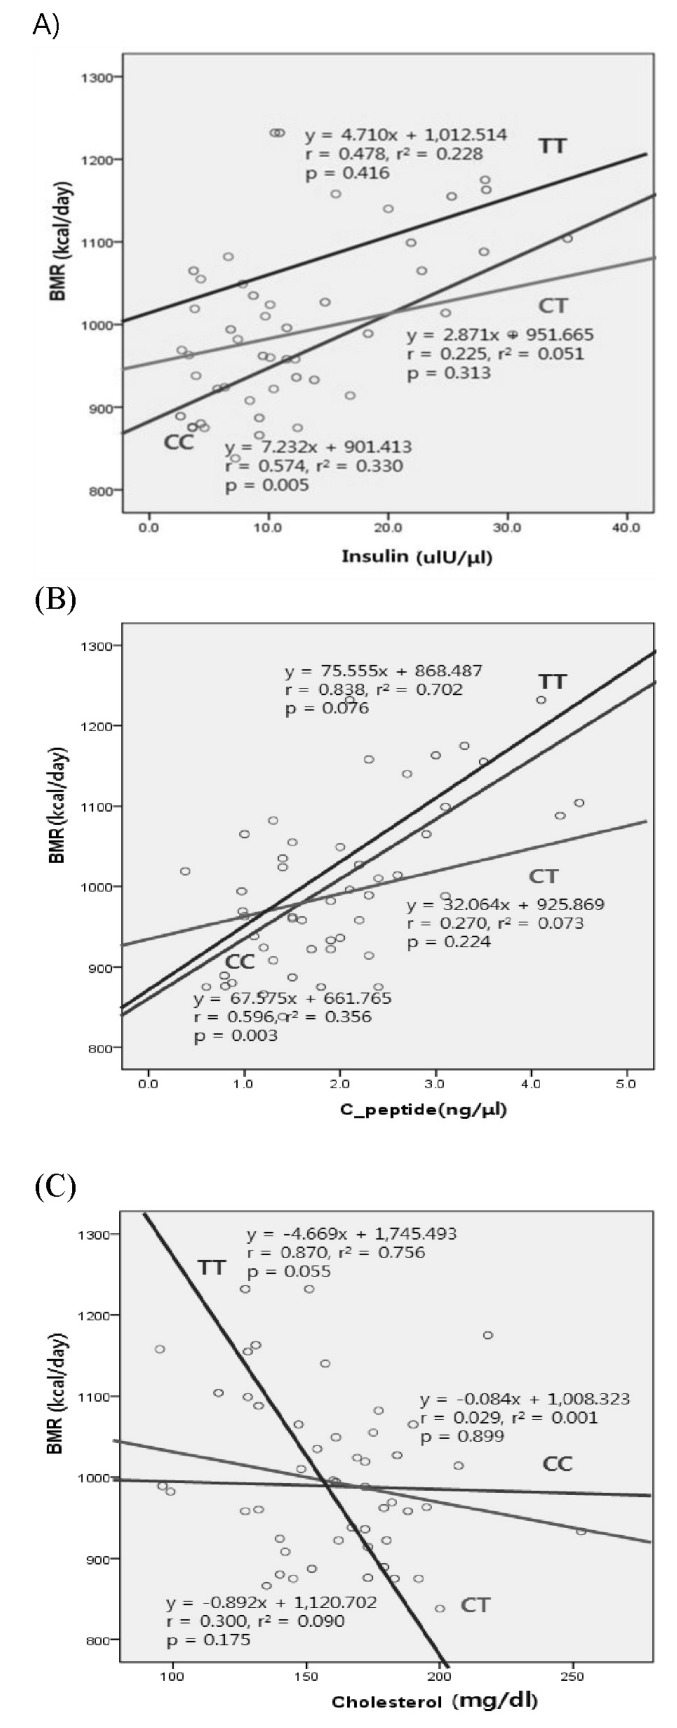
The parametric Pearson correlation analysis of the data revealed that BMR was significantly positively correlated with height (r = 0.888, p < 0.001), weight (r = 0.873, p < 0.001), BMI (r = 0.669, p < 0.001), fat mass (r = 0.596, p < 0.001), muscle (r = 1.000, p < 0.001), insulin (r = 0.377, p = 0.002), and C-peptide (r = 0.618, p < 0.001) (data not shown). Because the value of BMR and RMR was similar to each other, we analyzed the regression equation of BMR with the contributors. Linear regression analysis was performed to estimate the relative contributions of BMI, muscle, fat mass, insulin, and cholesterol to the inter-individual variations of BMR. In the linear regression analysis, BMI and muscle mass were correlated with BMR in every genotype of KLF5, whereas insulin and C-peptide were not associated with BMR in children with the CT and TT compared to CC genotype. It was interesting that TC was negatively correlated with BMR in only the TT genotype in contrast to the CC or CT genotype. (Figs. 1 and 2). Multiple linear regression analysis was performed to estimate the relative contribution of age, muscle, RI, tricep, glucose, and insulin to BMR in children. We identified that age, muscle, RI, tricep, WHR, and fat mass could explain 100% of BMR (adjusted r2 = 1.000, p < 0.001) in children (Table 4). In the high-BMR group, we observed that higher muscle, fat mass, and C-peptide affected the increase of BMR in children with TT genotype (p < 0.001, p < 0.001, and p = 0.018, respectively), while RI could explain the usual decrease in BMR (adjusted r2 = 1.000, p < 0.001). Our prediction equation of BMR including age, muscle, RI, tricep, WHR, and fat mass specific for children from 10 to 13 years old is as follows:
Discussion
This study was the first report of a KLF5 SNP (rs3782933) involved in the susceptibility to BMR in Korean elementary school children. Children with the TT genotype had significantly higher BMR, muscle, HLD-C, insulin, and C-peptide and lower LDL-C than those with the wild-type CC. However, we found that BMI, muscle, and fat mass could explain the usual increase in BMR in every genotype in KLF5, whereas insulin and C-peptide were not associated with the increase of BMR, except wild-type, in the linear regression analysis. Using multiple linear regression analysis, we estimated the predicting equation of BMR in children. In the high-BMR group, TT genotype increased BMR according to muscle, fat mass, and C-peptide, and there was an inverse correlation between BMR and RI (adjust r2 = 1.000, p < 0.001). Our results suggested an association between the TT mutant homozygotes of KLF5 rs3782933 and BMR in Korean children.
BMR is affected by many factors, such as age, gender, body composition, and genetic variation. BMR measurement in humans was primarily used for the diagnosis of hypo- and hyperthyroidism. Recently, BMR was used to estimate human energy and food requirements as well as the diagnosis of thyroid disease, diabetes, and leukemia [21]. Up to the present, alleles of specific genes, such as UCP1, LPL, and beta3-AR, were considered to play a major role in the development of metabolic complications in the obese population [22]. Moreover, some reports suggested that the variation in the beta3-adrenergic receptor gene influences BMR in obese subjects and that the synergistic effect of polymorphisms in UCP1 and beta3-adrenergic receptor genes leads to a lower BMR [15, 23]. Recently, Suchanek et al. [24] investigated the association between an alpha2 Heremans-Schmid glycoprotein (AHSG) gene polymorphism and obesity. There was a significant correlation between homozygotes of AHSG and increased BMR [24]. However, the association of the variation in KLF5 and BMR has not been confirmed yet in Korean children.
Although we identified the novel genetic variation in a noncoding region of KLF5, this SNP might affect complex diseases, such as obesity and diabetes. Many disease-associated mutations are predicted to be SNPs. Some of the SNPs associated with complex diseases might be located in the coding and/or noncoding region and lead to alterations in the function of the protein [25]. Recently, Oishi et al. [1] showed that a novel signaling and transcriptional network involving MEF2A and KLF5 -1,282 bp plays a crucial role in the pathogenesis of hypertension and that the KLF5 promoter allele (-1282A) is associated with a higher prevalence of hypertension [1]. KLF5 has also been involved in vascular smooth muscle cell differentiation, growth, and gene expression [3]. In this population, we divided them into two groups by BMI: normal weight and overweight. Children who are overweight have the potential to be obese adults when they grow up. We could infer from the relationship between the KLF5 polymorphism and BMR that the variation of KLF is associated with obesity. Several studies of diverse ethnic groups, including Pima Indians, Caucasians, and Japanese, have demonstrated that obese individuals with type 2 diabetes have a higher BMR compared to the obese non-diabetic populations [26]. In our result, 58% of children in the high-BMR group were overweight, and the children with the TT mutant homozygote of KLF5 came under the high-BMR group.
Recently, the predicting equations for BMR have been verified in many populations [12, 27-29]. To cross-validate three predicting equations for BMR established by the Schofield database, Henry, and Cole, Ramirez-Zea M used mean values for age, weight, height, and BMR. These findings suggested that the equation seemed to be appropriate to estimate BMR in men only, not women [28]. Another study indicated that a new equation may be more appropriate for calculating BMR using age, height, weight, and fat in obese children [27]. In our equation, we determined a BMR equation for children between the ages of 10 and 13 years old based on age, muscle, RI, tricep, WHR, and fat mass. Our predicting equation in children was similar to the previous studies. In the normal-weight group, we observed that the variables of age, weight, muscle, RI, glucose, and insulin were significant predictors of BMR, which accounted for 100% of the variation in BMR. However, the final model of our equation for BMR in the overweight group included both weight and muscle (data not shown). On the other hand, we divided them into 2 groups: low- and high-BMR group. In the high-BMR group, we established the predictive equation using muscle, fat mass, RI, and C-peptide. We observed an inverse correlation between BMR and RI in the high-BMR group, and the children with the TT genotype belonged to the high-BMR group. These results indicated that the children with the TT genotype have a higher BMR compared with the children with the CC genotype.
Although the mean insulin value was higher in the children with the TT genotype than those with the CC genotype, there was no significant association between HOMA-IR and TT genotype in our subjects. We postulated that the relation of insulin and HOMA-IR may contribute to insulin resistance (IR) in our children. IR was calculated according to HOMA using fasting insulin and glucose concentrations [30]. Children who were overweight have a higher morbidity rate of obesity than children with normal weight. Obese adults have more IR than normal, which may predispose them to diabetes [30]. Obesity-induced IR is the major contributor of metabolic syndrome, and both obesity and IR are components of metabolic syndrome [31, 32]. However, we could not observe IR. Also, the insulin value and HOMA-IR were not involved in the equation of the overweight group. In the high-BMR group only, we observed that the higher C-peptide affected the increase of BMR in children with the TT genotype. Therefore, obese children with the TT genotype may have no potential for becoming obese adults with metabolic syndrome.
There are several limitations in this study. First of all, a sample size of this study was too small, because 1) it was necessary to use a direct calorimeter for measuring RMR, but the device and its expendables, such as mouthpieces, were too expensive and not cost-effective for our study. If the children were unable to reach steady-state oxygen consumption in the allotted time of approximately 10 min, the children repeated numerous times after resting, and it was not easy for younger participants. 2) Parent's signed permission for these children was mandatory at the first visit, but several parents and children rejected informed consent. 3) It was not sufficient to obtain the blood samples of all children for analyzing the genetic polymorphism of KLF5, and there was a genotyping error sometimes. Second, we could not find out the citations to explain the association between the KLF5 polymorphism and BMR. There is abundant satisfactory research showing the predictive equation for BMR in several populations. Although we discovered the studies to suggest the genes involved in the regulation of energy expenditure metabolism, including UCP1, there was not enough research to demonstrate the association of KLF5 and BMR in this study.
In this study, we found that the TT homozygote of KLF5 plays a crucial role for increasing BMR and fat mass in Korean children. We could make better use of the novel variations within KLF5 in a future clinical intervention study of obesity.