Genomics Inform Search

CLOSE


Genomics Inform > Volume 17(3); 2019 > Article
Lee, Won, Oh, and Shin: In silico approach to calculate the transcript capacity

Abstract

We sought the novel concept, transcript capacity (TC) and analyzed TC. Our approach to estimate TC was through an in silico method. TC refers to the capacity that a transcript exerts in a cell as enzyme or protein function after translation. We used the genome-wide association study (GWAS) beta effect and transcription level in RNA-sequencing to estimate TC. The trait was body fat percent and the transcript reads were obtained from the human protein atlas. The assumption was that the GWAS beta effect is the gene’s effect and TC was related to the corresponding gene effect and transcript reads. Further, we surveyed gene ontology (GO) in the highest TC and the lowest TC genes. The most frequent GOs with the highest TC were neuronal-related and cell projection organization related. The most frequent GOs with the lowest TC were wound-healing related and embryo development related. We expect that our analysis contributes to estimating TC in the diverse species and playing a benevolent role to the new bioinformatic analysis.

Introduction

There have been various experimental studies regarding enzyme activity [1,2]. Enzyme activity is defined by a measure of the quantity of active enzyme present. Most enzyme activity studies are based on in vitro experiments. This approach is a limited method because it does not contain in vivo situations. Our approach was to introduce transcript capacity (TC) concept and this concept has both resemblance and difference in comparison to the enzyme activity estimation. It can be considered that TC plays a role like enzyme activity as transcript activity or TC but it is mainly related to the analyzed traits. Thus, TC does not match to the concept of enzyme activity, perfectly. Although enzyme activity is not directly associated with TC, the investigation of TC can be one of the important route to examine enzyme activity because both deal with the capacity of specific cellular units, i.e. enzyme and transcript. We calculated TC using the genome-wide association study (GWAS) beta effect and transcript reads in RNA-sequencing (RNA-seq) data, and our study is based on an in silico analysis. Our novel approach was based on that gene effect could be a function of TC and transcript reads. TC refers to the capacity that one unit of transcripts exerts as a cellular function. TC cannot be easily measured in experiments. We calculated TC using bioinformatics studies.
GWAS can be used for finding significant variants and genes associated with given traits. It is a very efficient and powerful method for detecting genes of significance. GWAS has been used to discover disease-associated genes and quantitative trait loci genes [3-5]. Lu et al. [6] tried to discover new loci associated with body fat percent (BF%) and identified cardiometabolic disease risk genomic factors. For TC estimation, we used BF% as the phenotype and performed GWAS. The beta effect in GWAS denotes the coefficient of the regression model and it can be the additive effect of the single nucleotide polymorphism (SNP) in the GWAS [7-9]. The significant markers associated with phenotypes have been used as the significance of the encompassed genes in GWAS. This is plausible because SNPs is linked at those encompassing genes which are usually called “linkage disequilibrium.”
RNA-seq data provides transcripts’ reads [10,11]. Through transcript reads and gene effects, we calculated TC. TC analysis can be important because it can be further analyzed the enzyme activity if the protein expression level instead of transcript reads is given.

Methods

Data description

For GWAS, we used Ansan-Anseong cohort data. These were for a study of a chronic diseases within Ansan city and Anseong rural areas in Korea. The dataset comprised men (8,842 people) between 40–69 years of age who had been residents of the region for at least 6 months [12,13]. Our study was from the 3rd Ansan-Anseong cohort dataset version 2.1. The analyzed phenotypes were BF% unit and the covariates were set to be area, age and sex. The SNP dataset was implemented using Affymetrix Genome-wide Human SNP Array 5.0 (Affymetrix, Santa Clara, CA, USA). The mean call rate was 99.01%. The total number of SNPs was 352,228 and after quality control (minor allele frequency < 0.05, Hardy-Weinberg equilibrium p-value < 0.0001 and missing genotype rate > 0.05), 308,003 SNPs were left.
For transcript reads, we used transcript reads per million (TPM) data at the following website (http://www.proteinatlas.org). The Human Protein Atlas was released with protein profile data covering 48 different human tissues and organs, including adipocytes, the kidney and the liver [14,15]. Among these organs, we used adipocyte’s transcript reads data. The TPM data of the Human Protein atlas is based on the reads per gene. Thus the gene length was pre-considered for the accurate reads estimation per gene.

Genome-wide association study (GWAS)

GWAS was performed using GCTA (a tool for genome-wide complex trait analysis) to estimate the beta effects [9,16]. The following model was:
(1)
y=a+bx+g+e      
where y is the phenotypic value (BF%), a is the mean term, b is the additive beta effect of the candidate SNP for association, x is the SNP genotype indicator variable, g is the polygenic effect, and e is the residual. The covariates were sex (male and female), area (Ansan and Anseong) and age. The age was factored to be 10-age steps. The b was the beta effect of the SNPs.

TC calculation

TC was calculated using the following relationships:
(2)
TC=effect of genetranscript reads
Eq. (2) uses the gene effect and transcript reads (TPM) to determine the TC. We assumed that the effect of the gene was proportional to the transcript reads and TC. The gene effect is proportional to TC as given in Eq. (2). If A and B genes’ effect is 10, 10, respectively and transcript reads are 1,000 and 10,000, then TCs of A and B are 0.01 and 0.001. Thus the capacity of the A transcript is 10-fold stronger than B transcript. One unit of A transcripts influences 10-fold to the traits in comparison to the B transcripts.

Gene ontology analysis

The gene ontology (GO) analysis was performed using DAVID (Database for Annotation, Visualization and Integrated Discovery) [17]. The gene catalogue was retrieved from Ensembl DB (http://www.ensembl.org). We selected the genes with the highest and lowest TC (top and bottom 5% in TC values) for the GO analysis.

Results

Figure description

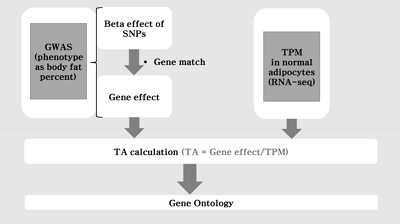
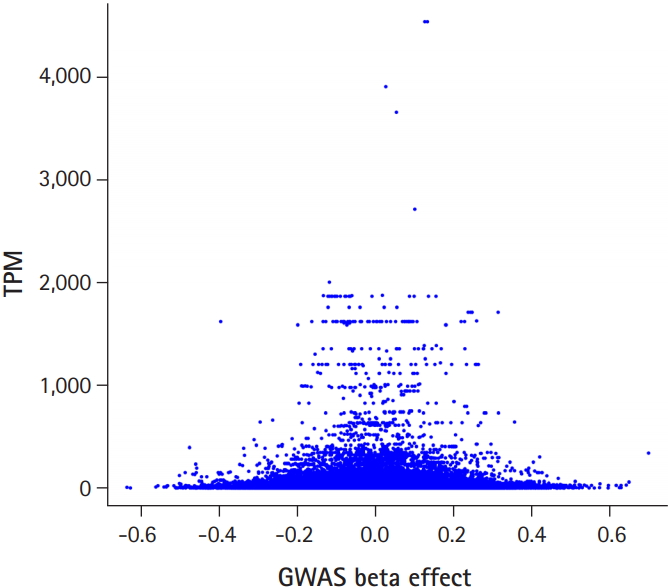
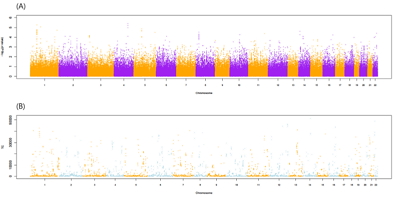
Fig. 1 shows the flow chart of our analysis. It explains the procedure of the TC calculation. The gene effect was calculated using GWAS and TC was calculated using gene effect and TPM. As shown in Eq. (2), the TC unit in our analysis is BF%. Fig. 2 shows the plot of TPM and GWAS beta effect. The genes with a higher TPM had a smaller beta effect across the board. According to Eq. (2), a higher TPM and a smaller beta effect would show a smaller TC. Fig. 3 shows the Manhattan plot of –log10(p-value) and the TC across chromosomes. The p-value was from GWAS results and TC was calculated as shown in Fig. 1.

TC calculation and GO analysis

Table 1 shows the summary statistics (minimum, maximum, average, standard deviation) of GWAS beta effect, TPM and TC. Table 2. shows the gene information with the lowest p-values (<0.0001) and the estimated TC. The TC was simply calculated using Eq. (2). Table 3 illustrates genes’ TC information of the highest p-values (top 5% genes in TC value). The neuronal genes including neuronal-activity regulated genes have important functions in dendrites and synapses and are likely to regulate circuit connectivity directly. Thus for the easy regulation of circuit connectivity, they might have the strategy through possessing low transcript reads and high TC [18]. Brain-derived neurotrophic factor (BDNF; TC, 1.88 BF%) encodes a neurotrophin that is secreted at the synapse. The induction of BDNF promotes both synapse maturation and dendritic growth. BDNF had high TC and its mutation can cause neurological and psychiatric disorders [18]. Table 4 shows the GO with the lowest TC (bottom 5% genes). It shows that the lowest TC’s major GO terms were endoderm formation, wound healing and embryo development. The von Willebrand factor (VWF) is not an enzyme and thus, has no catalytic activity (https://en.wikipedia.org/wiki/Von_Willebrand_factor). In our analysis, the VWF had high transcript reads and low TC (TPM, 155.1; TC, 0.002 BF%).

Discussion

GWAS and expression quantitative trait loci

We used the GWAS and RNA-seq data associated with body fat. The expression quantitative trait loci (eQTL) are genomic loci that explain a variation in expression levels of mRNAs (https://en.wikipedia.org/wiki/Expression_quantitative_trait_loci). Parks et al. [19] showed the genetic control of obesity and gut microbiota composition using eQTL analysis. In our analysis, the accurate beta effect estimation accompanied by p-value are crucial and thus eQTL analysis can help better estimating TC because eQTL information contains the mRNA expression level.

GWAS p-value and accuracy of TC calculation

In GWASs, the significance is guaranteed by the p-value. The p-value is the criteria to dissect the significant variants and those genes from insignificant ones. Although genes’ effects were dissected by the p-value, only the beta effect was used for TC calculation. The gene’s GWAS p-value and beta effect can be varied with respect to analyzed phenotypes. The highly accurate TC calculation should be certified by using diverse phenotypes in GWAS. Additionally, the transcript reads in RNA-seq data can be diverse in various tissues. By using diverse tissues and information from various traits, the accurate TC calculation can be plausible for generally acceptable estimation.
BF% can be used to approximate fat accumulation in adipose tissues. The trait reflects the fat accumulation and the gene’s play in adipose tissue. The GWAS directs the significant variants associated with body fat but the TC quantity only mirrors the transcript activity only related to the analyzed traits as indicated by TC unit (BF%).
Our GWAS calculation for the gene effect was based on the linkage disequilibrium between SNP markers and the gene. Despite the advantages of GWAS using SNP markers, diverse SNP markers per gene can cause a problem. Thus gene-based GWAS can be an another alternative method. And RNA-seq data had better be obtained from the similar sample to the GWAS dataset.
The neuronal and cell projection organization genes were enriched in the GO analysis (Table 2). These genes have low p-values in the GWAS analysis of BF% across the board. Inspecting the relationship between TC and GO terms why the lowest TC values are associated with certain GO terms, is a subject that needs to be addressed. Likewise, the reason why wound healing and embryo development GO terms have low TC values must be elucidated.

Features of the TC calculation in our study

Unlike previous studies that calculate the protein activity, TC calculation is a high-throughput analysis. Vermeirssen et al.[20] used a quantitative in silico analysis to calculate the inhibitory activity of angiotensin I converting enzyme (ACE). They used an in vivo analysis to calculate ACE activity, also. Our study to calculate TC is theoretically novel. Additionally, it is feasible not only to calculate TC, but also to calculate other annotated ones including transcription factor whose activity cannot be easily measured experimentally.

Notes

Authors’ Contribution

Conceptualization: YSL. Data curation: JDO, DS, KHW. Formal analysis: YSL. Funding acquisition: YSL. Methodology: YSL. Writing - original draft: YSL. Writing - review & editing: JDO, DS.

Conflicts of Interest

No potential conflict of interest relevant to this article was reported.

Acknowledgments

This research was supported by the Basic Science Research Program through the National Research Foundation of Korea (NRF) funded by the Ministry of Education (No. NRF-2017R1A6A3A11033784 & NRF-2017R1C1B3007144).

Fig. 1.
The flow chart of the analysis. The transcript capacity was calculated in silico using genome-wide association study (GWAS) and RNA-sequencing (RNA-seq). SNP, single nucleotide polymorphism; TA, transcript activity (synonym: transcript capacity); TPM, transcript per million reads.
gi-2019-17-3-e31f1.jpg
Fig. 2.
Transcript reads per million (TPM) versus genome-wide association study (GWAS) beta effect. Larger beta effect genes had a smaller TPM across the board.
gi-2019-17-3-e31f2.jpg
Fig. 3.
The Manhattan plot of–log10(p-value) including total analyzed single nucleotide polymorphisms (SNPs) (A) and transcript capacity (TC) (B) under p-value < 0.05 across chromosomes. The P-value was obtained from the genome-wide association study (GWAS) of the SNPs and those encompassing genes. TC was calculated using the GWAS beta effect and transcript per million reads.
gi-2019-17-3-e31f3.jpg
Table 1.
Summary statistics of beta effect, TPM, and TC in our analysis
Min Max Average SD
Beta –0.9378 1.326 0.004 0.387
TPM 0.1 1864.5 19.855 70.551
TC 0.000146 7.483 0.371 0.857

Beta, GWAS beta effect; TPM, transcript per million reads; TC, transcript capacity.

Table 2.
Genes with the lowest p-values (cutoff 0.0001) and their TC estimation
CHROM SNP Position Beta p-value Gene TPM TC
1 SNP_A-2261105 56496439 –0.49 0.00000569 PLPP3 147.9 0.003
1 SNP_A-2137301 77704683 0.39 0.00000908 USP33 45 0.009
4 SNP_A-4203089 134200024 0.4 0.0000107 PABPC4L 1.6 0.25
5 SNP_A-1821378 75406064 0.43 0.0000138 COL4A3BP 37.7 0.01
1 SNP_A-1848974 56496993 –0.46 0.0000169 PLPP3 147.9 0.003
1 SNP_A-2302611 56520770 –0.38 0.0000176 PLPP3 147.9 0.003
1 SNP_A-2276931 235264645 0.38 0.0000191 ARID4B 12.7 0.03
5 SNP_A-4258112 75370070 0.43 0.0000201 COL4A3BP 37.7 0.01
5 SNP_A-4193701 75413307 0.42 0.0000233 COL4A3BP 37.7 0.01
14 SNP_A-2203004 32144721 0.54 0.0000247 ARHGAP5 26.9 0.02
5 SNP_A-2111116 171218237 –0.42 0.0000335 RANBP17 0.2 2.12
22 SNP_A-2212209 42624987 0.7 0.0000391 CYB5R3 337.7 0.002
11 SNP_A-1946877 114585252 0.36 0.000041 NXPE4 0.1 3.6
14 SNP_A-2203008 32145585 0.41 0.0000533 ARHGAP5 26.9 0.015
10 SNP_A-4304897 77131018 –0.46 0.0000558 KCNMA1 11.1 0.04
16 SNP_A-2161617 78907824 –0.45 0.0000603 WWOX 10.5 0.04
6 SNP_A-4211857 96568889 0.58 0.0000811 FHL5 41.6 0.014
2 SNP_A-2266417 75681594 –0.35 0.0000813 MRPL19 35 0.01
2 SNP_A-2266417 75681594 –0.35 0.0000813 GCFC2 10.1 0.03
2 SNP_A-4257172 46029907 0.38 0.000082 PRKCE 5 0.08
5 SNP_A-1943727 75381858 0.4 0.0000879 COL4A3BP 37.7 0.01
5 SNP_A-2283204 75433640 0.39 0.0000927 COL4A3BP 37.7 0.01
1 SNP_A-1827525 216928377 –0.34 0.0000937 ESRRG 0.4 0.85

The estimation of TC and TPM belongs to the corresponding gene.

TC, transcript capacity; CHROM, chromosome name; SNP, single nucleotide polymorphism; TPM, transcript reads per million.

Table 3.
GO for the highest (as TC values) top 1% of the genes
Term Count p-value Genes Fold enrichment
GO:0007399~nervous system development 29 0.000000124 OPRM1, RP1, DPF3, GRIK1, GRIP1, SYT2, CTNND2, RP1L1, RIMS2, BDNF, BARX2, KIRREL3, RFX4, MDGA2, GRIN2A, ARMC4, RPGRIP1, ELAVL4, ALK, GRHL2, PPP1R17, CTNNA2, EPHA7, HYDIN, CHRM3, RASGRF1, CHRM2, CHST8, ATP8A2 2.89
GO:0048858~cell projection morphogenesis 16 0.00000257 RP1, RFX4, SYT2, RP1L1, CTNND2, ARMC4, ELAVL4, RIMS2, DNAH7, NME8, CTNNA2, EPHA7, BDNF, HYDIN, ATP8A2, KIRREL3 4.34
GO:0032990~cell part morphogenesis 16 0.00000349 RP1, RFX4, SYT2, RP1L1, CTNND2, ARMC4, ELAVL4, RIMS2, DNAH7, NME8, CTNNA2, EPHA7, BDNF, HYDIN, ATP8A2, KIRREL3 4.23
GO:0030030~cell projection organization 20 0.00000418 RP1, MYO1A, RFX4, GRIP1, SYT2, RP1L1, CTNND2, ARMC4, ACTN2, ELAVL4, RIMS2, DNAH7, NME8, CTNNA2, BDNF, EPHA7, HYDIN, RASGRF1, ATP8A2, KIRREL3 3.32
GO:0032989~cellular component morphogenesis 18 0.000075 RP1, RFX4, SYT2, RP1L1, CTNND2, ARMC4, ACTN2, ELAVL4, RIMS2, DNAH7, NME8, GRHL2, CTNNA2, BDNF, EPHA7, HYDIN, ATP8A2, KIRREL3 2.95
GO:0035082~axoneme assembly 5 0.0000991 RP1, HYDIN, RP1L1, ARMC4, DNAH7 20.4
GO:0048666~neuron development 15 0.000104 RP1, GRIP1, SYT2, RP1L1, CTNND2, RPGRIP1, ELAVL4, RIMS2, ALK, CTNNA2, EPHA7, BDNF, RASGRF1, ATP8A2, KIRREL3 3.36
GO:0000902~cell morphogenesis 17 0.000123 RP1, RFX4, SYT2, RP1L1, CTNND2, ARMC4, ELAVL4, RIMS2, DNAH7, NME8, GRHL2, CTNNA2, BDNF, EPHA7, HYDIN, ATP8A2, KIRREL3 2.96
GO:0022008~neurogenesis 18 0.000227 OPRM1, RP1, GRIP1, SYT2, MDGA2, GRIN2A, RP1L1, CTNND2, RPGRIP1, ELAVL4, RIMS2, ALK, CTNNA2, BDNF, EPHA7, RASGRF1, ATP8A2, KIRREL3 2.69
GO:0048699~generation of neurons 17 0.000346 OPRM1, RP1, GRIP1, SYT2, MDGA2, RP1L1, CTNND2, RPGRIP1, ELAVL4, RIMS2, ALK, CTNNA2, BDNF, EPHA7, RASGRF1, ATP8A2, KIRREL3 2.71
GO:0042384~cilium assembly 7 0.000355 RP1, HYDIN, RFX4, RP1L1, ARMC4, DNAH7, NME8 7.35
GO:0030182~neuron differentiation 16 0.00037 RP1, GRIP1, SYT2, MDGA2, RP1L1, CTNND2, RPGRIP1, ELAVL4, RIMS2, ALK, CTNNA2, EPHA7, BDNF, RASGRF1, ATP8A2, KIRREL3 2.82
GO:0010927~cellular component assembly involved in morphogenesis 8 0.000385 RP1, HYDIN, RFX4, RP1L1, ARMC4, ACTN2, DNAH7, NME8 5.88
GO:0048468~cell development 21 0.000399 OPRM1, RP1, IL5, GRIP1, SYT2, RP1L1, CTNND2, ACTN2, RPGRIP1, ELAVL4, RIMS2, ALK, GRHL2, CTNNA2, BDNF, EPHA7, HYDIN, RASGRF1, ATP8A2, NUP210L, KIRREL3 2.31
GO:0007268~chemical synaptic transmission 11 0.000405 OPRM1, CDH8, KCNQ5, CHRM3, GRIK1, RASGRF1, CHRM2, SYT2, GRIN2A, RIMS2, OPRD1 3.94
GO:0098916~anterograde trans-synaptic signaling 11 0.000405 OPRM1, CDH8, KCNQ5, CHRM3, GRIK1, RASGRF1, CHRM2, SYT2, GRIN2A, RIMS2, OPRD1 3.94
GO:0099536~synaptic signaling 11 0.000405 OPRM1, CDH8, KCNQ5, CHRM3, GRIK1, RASGRF1, CHRM2, SYT2, GRIN2A, RIMS2, OPRD1 3.94
GO:0099537~trans-synaptic signaling 11 0.000405 OPRM1, CDH8, KCNQ5, CHRM3, GRIK1, RASGRF1, CHRM2, SYT2, GRIN2A, RIMS2, OPRD1 3.94
GO:0001578~microtubule bundle formation 5 0.000443 RP1, HYDIN, RP1L1, ARMC4, DNAH7 13.86
GO:0044782~cilium organization 7 0.000593 RP1, HYDIN, RFX4, RP1L1, ARMC4, DNAH7, NME8 6.67
GO:0030031~cell projection assembly 9 0.000636 RP1, MYO1A, HYDIN, RFX4, RP1L1, ARMC4, ACTN2, DNAH7, NME8 4.64
GO:0060271~cilium morphogenesis 7 0.000922 RP1, HYDIN, RFX4, RP1L1, ARMC4, DNAH7, NME8 6.13

The major gene ontology (GO) terms were neuronal and cell projection organization-related.

TC, transcript capacity.

Table 4.
GO for the lowest (as TC values) bottom 1% of the genes
Term Count p-value Gene Fold enrichment
GO:0007369~gastrulation 6 0.0000374 COL4A2, DLD, LAMB1, MMP2, PLPP3, FN1 15.22
GO:0042060~wound healing 7 0.0000543 VWF, CD34, HMOX1, IGF1, MYH9, PLPP3, FN1 9.98
GO:0009611~response to wounding 7 0.000136 VWF, CD34, HMOX1, IGF1, MYH9, PLPP3, FN1 8.45
GO:0009790~embryo development 10 0.000165 FKBP8, COL4A2, DLD, IGF1, LAMB1, MYH9, MMP2, PLPP3, RCN1, FN1 4.69
GO:0035987~endodermal cell differentiation 4 0.000206 COL4A2, LAMB1, MMP2, FN1 33.52
GO:0001944~vasculature development 8 0.000217 COL4A2, ANP32B, CD34, QKI, MYH9, MMP2, PLPP3, THY1 6.2
GO:0031589~cell-substrate adhesion 6 0.000273 VWF, CD34, FERMT2, LAMB1, THY1, FN1 9.99
GO:0001706~endoderm formation 4 0.000366 COL4A2, LAMB1, MMP2, FN1 27.65
GO:0007492~endoderm development 4 0.000751 COL4A2, LAMB1, MMP2, FN1 21.69

The major gene ontology (GO) terms were wound-healing and embryo development.

TC, transcript capacity.

References

1. Chen J, Lipska BK, Halim N, Ma QD, Matsumoto M, Melhem S, et al. Functional analysis of genetic variation in catechol-O-methyltransferase (COMT): effects on mRNA, protein, and enzyme activity in postmortem human brain. Am J Hum Genet 2004;75:807–821.
crossref pmid pmc
2. Bailey MJ, Biely P, Poutanen K. Interlaboratory testing of methods for assay of xylanase activity. J Biotechnol 1992;23:257–270.
crossref
3. Kraus WE, Muoio DM, Stevens R, Craig D, Bain JR, Grass E, et al. Metabolomic quantitative trait loci (mQTL) mapping implicates the ubiquitin proteasome system in cardiovascular disease pathogenesis. PLoS Genet 2015;11:e1005553.
crossref pmid pmc
4. Warren CR, O'Sullivan JF, Friesen M, Becker CE, Zhang X, Liu P, et al. Induced pluripotent stem cell differentiation enables functional validation of GWAS variants in metabolic disease. Cell Stem Cell 2017;20:547–557.
crossref pmid
5. Marigorta UM, Denson LA, Hyams JS, Mondal K, Prince J, Walters TD, et al. Transcriptional risk scores link GWAS to eQTLs and predict complications in Crohn's disease. Nat Genet 2017;49:1517–1521.
crossref pmid pmc pdf
6. Lu Y, Day FR, Gustafsson S, Buchkovich ML, Na J, Bataille V, et al. New loci for body fat percentage reveal link between adiposity and cardiometabolic disease risk. Nat Commun 2016;7:10495.
crossref pmid pmc pdf
7. Lauc G, Essafi A, Huffman JE, Hayward C, Knezevic A, Kattla JJ, et al. Genomics meets glycomics-the first GWAS study of human N-Glycome identifies HNF1alpha as a master regulator of plasma protein fucosylation. PLoS Genet 2010;6:e1001256.
crossref pmid pmc
8. Nettleton JA, McKeown NM, Kanoni S, Lemaitre RN, Hivert MF, Ngwa J, et al. Interactions of dietary whole-grain intake with fasting glucose- and insulin-related genetic loci in individuals of European descent: a meta-analysis of 14 cohort studies. Diabetes Care 2010;33:2684–2691.
crossref pmid pmc
9. Yang J, Lee SH, Goddard ME, Visscher PM. GCTA: a tool for genome-wide complex trait analysis. Am J Hum Genet 2011;88:76–82.
crossref pmid pmc
10. Pertea M, Pertea GM, Antonescu CM, Chang TC, Mendell JT, Salzberg SL. StringTie enables improved reconstruction of a transcriptome from RNA-seq reads. Nat Biotechnol 2015;33:290–295.
crossref pmid pmc pdf
11. Bray NL, Pimentel H, Melsted P, Pachter L. Near-optimal probabilistic RNA-seq quantification. Nat Biotechnol 2016;34:525–527.
crossref pmid pdf
12. Lim S, Jang HC, Lee HK, Kimm KC, Park C, Cho NH. A rural-urban comparison of the characteristics of the metabolic syndrome by gender in Korea: the Korean Health and Genome Study (KHGS). J Endocrinol Invest 2006;29:313–319.
crossref pmid pdf
13. Cho YS, Go MJ, Kim YJ, Heo JY, Oh JH, Ban HJ, et al. A large-scale genome-wide association study of Asian populations uncovers genetic factors influencing eight quantitative traits. Nat Genet 2009;41:527–534.
crossref pmid pdf
14. Berglund L, Bjorling E, Oksvold P, Fagerberg L, Asplund A, Szigyarto CA, et al. A genecentric Human Protein Atlas for expression profiles based on antibodies. Mol Cell Proteomics 2008;7:2019–2027.
crossref pmid
15. Uhlen M, Oksvold P, Fagerberg L, Lundberg E, Jonasson K, Forsberg M, et al. Towards a knowledge-based Human Protein Atlas. Nat Biotechnol 2010;28:1248–1250.
crossref pmid pdf
16. Kapoor M, Wang JC, Wetherill L, Le N, Bertelsen S, Hinrichs AL, et al. A meta-analysis of two genome-wide association studies to identify novel loci for maximum number of alcoholic drinks. Hum Genet 2013;132:1141–1151.
crossref pmid pmc pdf
17. Ashburner M, Ball CA, Blake JA, Botstein D, Butler H, Cherry JM, et al. Gene ontology: tool for the unification of biology. The Gene Ontology Consortium. Nat Genet 2000;25:25–29.
crossref pmid pmc pdf
18. Flavell SW, Greenberg ME. Signaling mechanisms linking neuronal activity to gene expression and plasticity of the nervous system. Annu Rev Neurosci 2008;31:563–590.
crossref pmid pmc
19. Parks BW, Nam E, Org E, Kostem E, Norheim F, Hui ST, et al. Genetic control of obesity and gut microbiota composition in response to high-fat, high-sucrose diet in mice. Cell Metab 2013;17:141–152.
crossref pmid pmc
20. Vermeirssen V, van der Bent A, Van Camp J, van Amerongen A, Verstraete W. A quantitative in silico analysis calculates the angiotensin I converting enzyme (ACE) inhibitory activity in pea and whey protein digests. Biochimie 2004;86:231–239.
crossref pmid
TOOLS
Share :
Facebook Twitter Linked In Google+
METRICS Graph View
  • 0 Crossref
  • 0 Scopus
  • 4,976 View
  • 92 Download
Related articles in GNI


ABOUT
ARTICLE CATEGORY

Browse all articles >

BROWSE ARTICLES
FOR CONTRIBUTORS
Editorial Office
Room No. 806, 193 Mallijae-ro, Jung-gu, Seoul 04501, Korea
Tel: +82-2-558-9394    Fax: +82-2-558-9434    E-mail: kogo3@kogo.or.kr                

Copyright © 2024 by Korea Genome Organization.

Developed in M2PI

Close layer
prev next