Introduction
In 2011, the Encyclopedia of DNA Elements (ENCODE) consortium released the ChromHMM chromatin state annotations for 9 consolidated epigenomes, where ChromHMM is software developed by ENCODE labs, to integrate multiple chromatin datasets of various histone modifications to discover de novo the major combinatorial and spatial patterns of marks [1, 2]. The 15-chromatin-state model of the ENCODE Project consists of 15 states that are publicly available through 9 Browser Extensible Data (BED) files [3]. Since, large-scale epigenetic datasets such as ENCODE have become publicly available, a growing interest has been shown in predicting the function of non-coding DNA regions directly from sequence by utilizing these large-scale ChromHMM annotations [4–7].
On the other hand, many researchers have shown that formal language theory is an appropriate tool in analyzing various biological sequences [1, 2]. The hidden Markov model (HMM) is most closely related to regular grammars, because an n-gram is a subsequence of n items from a given sequence, and language models that are built from n-grams are actually (n-1)-order Markov models. We therefore proposed n-gram probabilistic language models for predicting the functions of ChromHMM regions of ENCODE [8]. In our previous study, we performed preliminary experiments to test whether the DNA sequences contained in each different chromatin unit of the ENCODE project possess the Markov property by applying Markov chains built from the two BED files of ENCODE tier 1 cell lines (GM12878, a B-lymphocyte lymphoblastoid cell line; and K562, a leukemia cell line) [8]. Our rationale for using the n-gram model was that each of the sequences contained in the ChromHMM chromatin states can follow a linguistic grammar, not merely as a form of short fragments of motifs or DNA signatures, but as a continuous and longer fragment of sequences.
Our simulation studies showed that some of these chromatin states possessed strong Markov properties of DNA sequences, and could even be predicted by the naïve Bayesian classifier. However, our model could have been biased, as our n-gram analyses were conducted only on two of the cell lines.
Thus, as a follow-up to our preliminary study on ENCODE datasets [8], we extend our previous study and continue our ongoing efforts to build comparative nucleotide frequency profiles to detect Markov properties by analyzing the datasets of the full range of 9 cells and tissue types provided by ENCODE. It was therefore critical to propose a new functional annotation framework that can be generalized to different cell types.
A generalizable framework can be achieved through statistically-justifiable models. We downloaded BED files from ENCODE and combined all the annotations spread out through 9 different BED files, into a single integrated BED file. Based on the newly integrated BED file, we assigned a dominant chromatin state for each 200-bp unit. We then rebuilt newer Markov chains by iteratively analyzing the variability count of the chromatin states of each 200-bp unit. By eliminating the highly variable 200-bp units, in our simulation studies we finally analyzed the active chromatin states that showed a strong Markov property.
Methods
When making 15-state ChromHMM BED files, the ENCODE consortium uses a core set of 9 chromatin markers [1]. We investigated whether some subsets of the annotated ENCODE 15-state model can be predicted by simply creating n-gram models of DNA sequences, in reverse [9]. To achieve this, ChromHMM blocks of human genome were initially dissected into a nucleosome resolution of 200-bp units and, by analyzing the 9 BED files of ChromHMM, each individual unit was assigned one dominant chromatin state. The process is explained in detail in the following sections: combining 9 BED files into a single file, filtering out highly variable 200-bp units, and finally building 5th order Markov Models.
Combining 9 BED files into a single file
The ENCODE consortium released a 15-state model BED file from an analysis of consolidated epigenomes, resulting in a total of 9 epigenomes for public download in ChromHMM BED files [3].
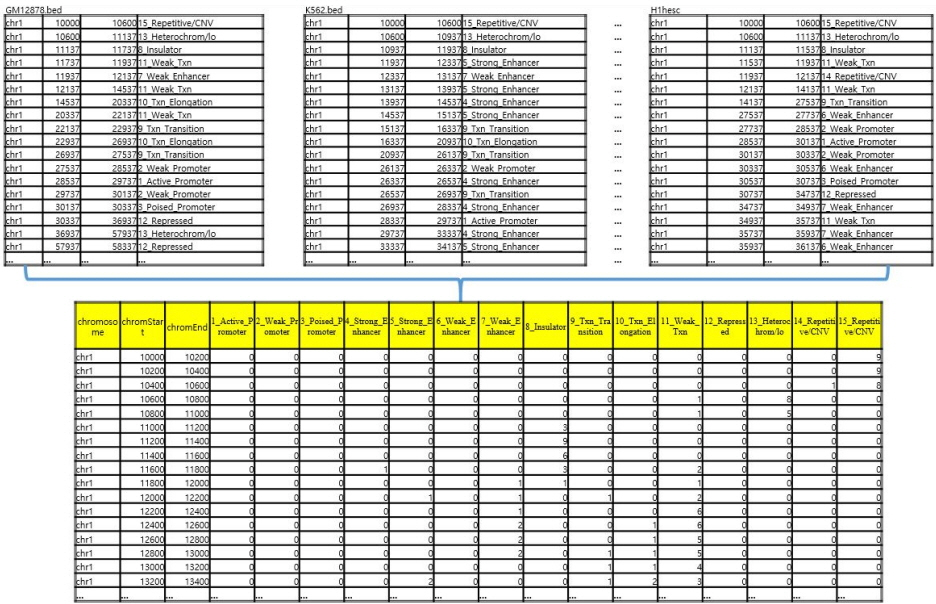
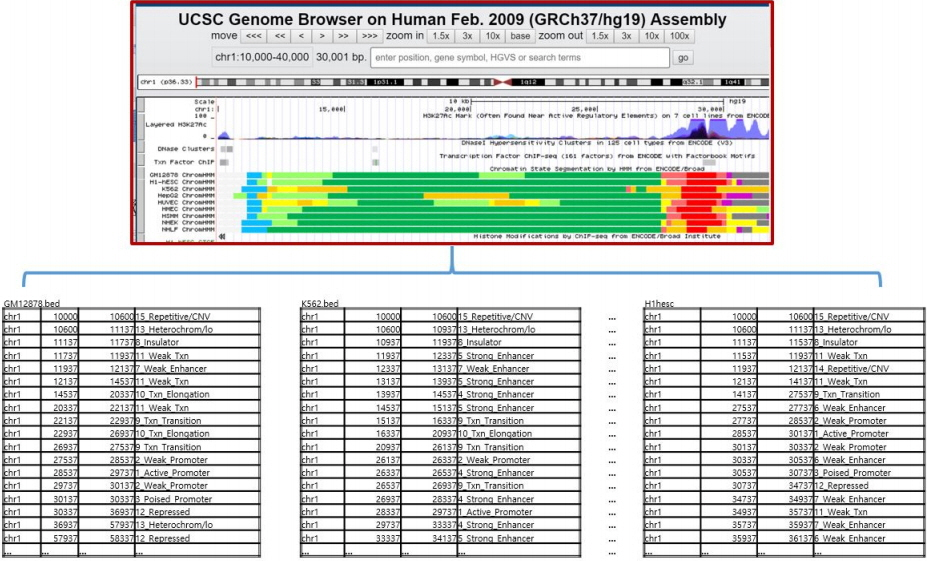
Fig. 1 shows the chromatin states of the 9 cell lines from chr1: 10,000 to chr1: 30,000 displayed in the University of California Santa Cruz (UCSC) genome browser (with human genome GRCh35/hg19). The BED format shown at the bottom of Fig. 1 provides a flexible way to define the data lines that are shown in an annotation track. The four BED fields shown in each BED file represents chrom (name of the chromosome), chromStart (starting position of the feature in the chromosome), chromEnd (ending position of the feature in the chromosome), and state (15 chromatin states, numbered from 1 to 15).
For example, the chromatin state of Gm12878 shown at the bottom of Fig. 1, for the block from chr1: 10,600 to chr1: 11,137, is 13_Heterochrom/lo, whereas the chromatin state of K562, for the block from chr1: 10,937 to chr1: 11,937, is 8_Insulator.
We attempted to build comparative nucleotide frequency profiles to detect their Markov property. Thus, it became critical to devise a functional annotation framework that can be generalized to different cell types. To design good predictive models in building the Markov chain atlas of the human genome, we modified the original BED files by dissecting the ChromHMM blocks in each BED file into 200-bp units. When the size of a dissected unit near the ChromHMM boundary is less than 150-bp, we discarded the unit, whereas when the size of dissected unit was greater than 150-bp, we rounded it up to a 200-bp unit.
For example, the original Gm12878 block in Fig. 1, from chr1: 10,600 to chr1: 11,137 (a block size of 537 bp), was dissected into two units of 200-bp blocks (from chr1: 10,600 to chr1: 10,800; from chr1: 10,800 to chr1: 11,000), in a new BED file, by discarding the last unit. Likewise, the original K562 block in Fig. 1, from chr1: 10,937 to chr1: 11,937 (a block size of 1,000 bp), was dissected into five units of 200-bp blocks (from chr1: 11,000 to chr1: 11,200; from chr1: 11,200 to chr1: 11,400; from chr1: 11,400 to chr1: 11,600; from chr1: 11,600 to chr1: 11,800; and from chr1: 11,800 to chr1: 12,000), by rounding up the last unit. Profiling nucleotide frequency tables into units of 200-bp is a convenient way to build a general framework and test various Markov properties simply by combining these 200-bp frequency tables in various ways for specific purposes.
Dissecting the blocks uniformly made it possible to combine all the annotations spread out through 9 different BED files into a single integrated BED file [10], as shown in Fig. 2. Each row of the integrated BED file shown at the bottom of Fig. 2 is composed of eighteen entries: chromosome number, starting block number, ending block number, and the remaining fifteen entries that show the number of annotation frequencies of each of the chromatin states, in the original BED files. For example, the chr1: 12,800–13,000 unit at the bottom of Fig. 2 shows that this specific 200-bp unit is annotated two times as state 7 (Weak_Enhancer), one time as state 9 (Txn_Transition), one time as state 10 (Txn_Elongation), and 5 times as state 11 (Weak_Txn) throughout the original 9 BED files, whereas all of the occurrence count numbers of the remaining chromatin states for this unit are zero (in 1, 2, 3, 4, 5, 6, 8, 12, 13, 14, and 15 states).
Filtering out highly variable 200-bp units
After integrating the BED files, we defined the variability count of the chromatin states of a given 200-bp unit as the number of states where counts of occurrences were non-zeroes, to define and compare the observed consistency of each chromatin state at any given genomic position across all 9 epigenomes. For example, the chromatin state variability count of the chr1: 12,800–13,000 block in Fig. 2 would be four, as there are four non-zero states (i.e., 7, 9, 10, and 11), whereas the chromatin state variability count of the chr1: 10,200–10,400 block in Fig. 2 would be one, as there is only one non-zero state.
We could then use variability count statistics and maximum likelihood decision rule to create an optimal classification Markov model, as uniform priors can be assumed if 200-bp units with stable chromatin state are used. In this way, the highly variable 200-bp units, with which different chromatin states were frequently switched to other states across different tissues and cell types, could be eliminated in the training Markov transition tables. Our rationale behind this was that, compared to the highly variable 200-bp units, the 200-bp units that are less frequently changed would show a strong Markov property.
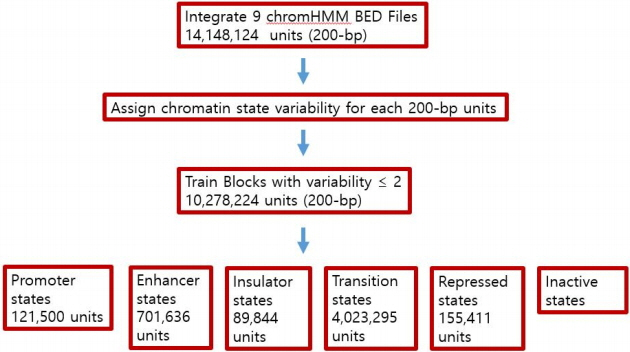
When the human genome was dissected into a 200-bp unit, there were originally 14,148,124 units (see Table 1). Among these units, all of the variability counts of the chromatin states of 5,721,116 units were one, indicating that all 9 cell lines were annotated with the same state in these 200-bp units, and the variability counts of the chromatin states of 4,557,108 units were two. It also indicates that all of the 9 cell lines were annotated as either of the two states in these 200-bp units.
This means that most of these 200-bp units have strong preferences for certain dominant chromatin state, where a dominant state of a 200-bp unit is the most frequently annotated chromatin state among the 15 chromatin states. This provided good heuristic insight for designing new Markov models for our study. Thus, it was possible to assign only one or two dominant chromatin states for most of the 200-bp units of the entire human genome.
Building fifth order Markov models
After we assigned a dominant chromatin state for each 200-bp unit, frequency counts were used to build fifteen initial transition tables for the fifth order Markov models [10]. For example, a uniform fifth order Markov chain is specified by a vector with initial probabilities P(Xn-5, Xn-4, Xn-3, Xn-2, Xn-1) for 4,096 components as well as a matrix of transitional probabilities P(Xn | Xn-5, Xn-4, Xn-3, Xn-2, Xn-1) with a size of 4,096 × 4. These tables were used to build a global Markov chain classifier to explore and rank sub-optimal predictions of the chromatin states. Based on the nucleotide frequency profiles, given a random sequence x1, x2,⋯, x200 in the state of a cell line, we compared sequences π1,π2,⋯,π200 of chromatin states that maximized the following probability of the initial 15 Markov chain models, where aπiπi+1 is a transition probability:
By trial and error, we rebuilt newer Markov chains by iteratively analyzing the variability count of the chromatin states of a given 200-bp unit, and by eliminating the highly variable 200-bp units in training.
Fig. 3 summarizes our process of building Markov chains. When the human genome was dissected into 200-bp units, there were originally 14,075,448 units. By trial and error, we rebuilt newer Markov chains by eliminating the highly variable 200-bp units in training. We finally excluded 200-bp units that showed more than two different chromatin state signatures when training our transition tables. Thus, our result is based on 7,038,863 units, which accounted for approximately 49.75% of the entire human genome. However, determining whether the remaining 50.25% of highly variable 200-bp units of the genome would show a Markov property is beyond the scope of this paper.
By this process, we found that some inactive chromatin states were highly constitutive and marked in most of the 9 epigenomes. For example, state 13 (Hetero_Chromatin state), which covered on average 70.48% of each reference epigenome, was excluded when considering the variability count of the chromatin states. We also excluded units in which a transcribed state showed both promoter and enhancer signatures. Mostly, we profiled each 200-bp with chromatin states and built new transition tables by training the 200-bp blocks with a chromatin variability of less than 2 (and containing at least one active state).
These fifteen chromatin states were then merged into six broad states: Promoter, Enhancer, Insulator, Transition, Repressed, and Inactive. Our final transition tables for the Promoter, Enhancer, Insulator, Transition and Repressed state (excluding inactive states) were built from 121,500, 701,636, 89,844, 4,023,295, and 155,411 200-bp units, respectively. As these Markov chains could be used as a Naive Bayes classifier, we calculated the sequence of each 200-bp unit that maximized our Markov models. We defined a correctly predicted unit as one in which the predicted result matched one of the dominant chromatin states in the same broad state.
Results
As a means to proving Markov property, we directly investigated whether our sequence-based Markov chain models for each chromatin state have the discriminating power necessary to identify different chromatin states.
The samples were stratified according to chromosomes into strictly non-overlapping training and testing sets. A total of 6,334,977 200-bp units were trained, and 703,886 200-bp units were tested for prediction accuracy. At this time, reverse complements of sequences were not considered when building the Markov models, since the backward Markov chain could show similar properties for solutions.
Table 2 shows the result: 52.86% precision for Promoter states, 37.95% precision for Transcribed states, and 59.82% for Enhancer states. These percentages were obtained by adding all units that were predicted correctly as a dominant state in each of the 200-bp units divided by the number of all testing units in the same broad group.
By estimating the prediction accuracy of chromatin states, we infer that the Promoter states showed reasonable Markov property, the Repressed state did not seem to display Markov property, and those units related to the Enhancer states (4, 5, 6, and 7 states) were the most tissue specific, whereas those related to the Transcription states (9, 10, and 11 states) were highly constitutive.
Discussion
In this short report, we did not provide any interpretable biological meanings for our statistically defined dominant state, yet. Therefore, our study should only be considered from a computational perspective, and, is thus a preliminary work. Still, it is important to note that we only used DNA sequences contained in the epigenetic datasets in modeling the Markov chains. Our study showed that once a dominant state for each 200-bp unit is assigned, a generalizable Markov framework can be achieved. Based on the framework, we showed that some subsets of the active chromatin states possessed a strong Markov property. We are currently investigating the overall co-occurrence of the 200-bp chromatin states for ENCODE ChromHMM datasets together with Roadmap Genomics datasets [11].