Genome-Wide Association Studies Associated with Backfat Thickness in Landrace and Yorkshire Pigs
Article information
Abstract
Although pork quality traits are important commercially, genome-wide association studies (GWASs) have not well considered Landrace and Yorkshire pigs worldwide. Landrace and Yorkshire pigs are important pork-providing breeds. Although quantitative trait loci of pigs are well-developed, significant genes in GWASs of pigs in Korea must be studied. Through a GWAS using the PLINK program, study of the significant genes in Korean pigs was performed. We conducted a GWAS and surveyed the gene ontology (GO) terms associated with the backfat thickness (BF) trait of these pigs. We included the breed information (Yorkshire and Landrace pigs) as a covariate. The significant genes after false discovery rate (<0.01) correction were AFG1L, SCAI, RIMS1, and SPDEF. The major GO terms for the top 5% of genes were related to neuronal genes, cell morphogenesis and actin cytoskeleton organization. The neuronal genes were previously reported as being associated with backfat thickness. However, the genes in our results were novel, and they included ZNF280D, BAIAP2, LRTM2, GABRA5, PCDH15, HERC1, DTNBP1, SLIT2, TRAPPC9, NGFR, APBB2, RBPJ, and ABL2. These novel genes might have roles in important cellular and physiological functions related to BF accumulation. The genes related to cell morphogenesis were NOX4, MKLN1, ZNF280D, BAIAP2, DNAAF1, LRTM2, PCDH15, NGFR, RBPJ, MYH9, APBB2, DTNBP1, TRIM62, and SLIT2. The genes that belonged to actin cytoskeleton organization were MKLN1, BAIAP2, PCDH15, BCAS3, MYH9, DTNBP1, ABL2, ADD2, and SLIT2.
Introduction
Landrace and Yorkshire pigs are commercial breeds used for pork production. The Landrace pig is a long, white pig with 16 or 17 ribs. Landrace pigs are utilized as Grandparents in the production of F1 parent stock females in a terminal crossbreeding (http://nationalswine.com/about/about_breeds/landrace.php). They outperform other pigs in litter size, birth and weaning weight, rebreeding interval, longevity and durability. Yorkshire pigs are muscular with a high proportion of lean meat. Yorkshire pigs have been maintained with great diligence, with a focus on sow productivity, growth, and backfat formation.
In Korea, the Landrace and Yorkshire breeds in Korea are used for commercial pork production. Pork quality traits are polygenic and quantitative trait loci (QTL) are associated with pork quality traits. In this regard, we analyzed genome-wide association studies (GWASs) for backfat thickness (BF) for these breeds. BF is an important trait in pork production. Despite the importance of BF, there have not been in-depth GWAS of the BF in the Landrace and Yorkshire breeds.
Rohrer et al. [1] performed a genome scan for loci affecting pork quality including BF in a Duroc-Landrace F2 population. Okumura et al. [2] studied genomic regions affecting BF by GWAS in a Duroc pig population. Likewise, we performed a GWAS and surveyed gene ontology (GO) terms. The top 5% genes were selected for GO analysis after the GWAS. The GO terms of the top 5% genes belonged to major GO terms of neuronal genes, cell morphogenesis and actin cytoskeleton organization [3–5]. Lee et al. [4] used a GWAS for fat thickness in humans and pigs and found that neuronal genes were associated with fat thickness. The results of our study were similar but the genes significantly associated with BF were novel.
Methods
Data preparation
The number of Landrace individuals was 1,041 and the number of Yorkshire individuals was 836. Their BF were measured and the genomic DNA of each individual Landrace or Yorkshire pig was genotyped using an Illumina Porcine 60 K SNP Beadchip (Illumina, San Diego, CA, USA). Total number of single nucleotide polymorphisms (SNPs) was 62,551 and 62,551 in the Landrace and Yorkshire breeds, respectively. After quality control (minor allele frequency <0.05, Hardy-Weinberg equilibrium p < 0.0001 and genotyping rate threshold < 0.05), the number of SNPs in the Landrace and Yorkshire breeds was 42,654 and 57,799, respectively. After merging the data of the two breeds, the number of SNPs was 38,002.
GWAS of BF
A GWAS using BF of Landrace and Yorkshire pigs was performed. The PLINK program was used for the GWAS [6]. The covariates were sex, parity and breed. The model used for the Landrace and Yorkshire pigs was the following:
where yi is the backfat thickness of the i-th individual, μ is the mean of backfat thickness in the population, sex, parity and breeds are the covariate, β is the beta effect in GWAS, gi represents the SNP genotypes and ei is the error in the model.
GO analysis
We analyzed the GO of the top 5% genes (p-value order) associated with BF in Landrace and Yorkshire pigs. Because the test result with a p-value < 0.05 in our study was very genial and multiple testing such as the Bonferroni correction and the false discovery rate (FDR) of our study result was very restrictive, we performed the GO analysis with the top 5% genes. The gene catalogue was retrieved from Ensemble database (http://www.ensembl.org) and the GO analysis was performed with the DAVID (david.ncifcrf.gov; Database for Annotation, Visualization and Integrated Discovery v6.7). A list of gene identifiers was uploaded to summarize the functional annotations associated with groups or each individual genes and each biological process–related GO terms was based on the number of genes and the p-values [7, 8].
Results
Phenotype description
The BF statistics for Landrace pigs were 7.22 (minimum), 19.42 (maximum), 11.89 (average), and 1.54 (standard deviation). The BF statistics for Yorkshire pigs were 8.44 (minimum), 18.04 (maximum), 12.70 (average), and 1.49 (standard deviation). The average value of Yorkshire BF was greater than that of Landrace BF, while the maximum value of Yorkshire BF was less than that of Landrace pig BF. Table 1 shows the BF summary statistics of these two breeds in Korea.
GWAS in Landrace and Yorkshire pigs
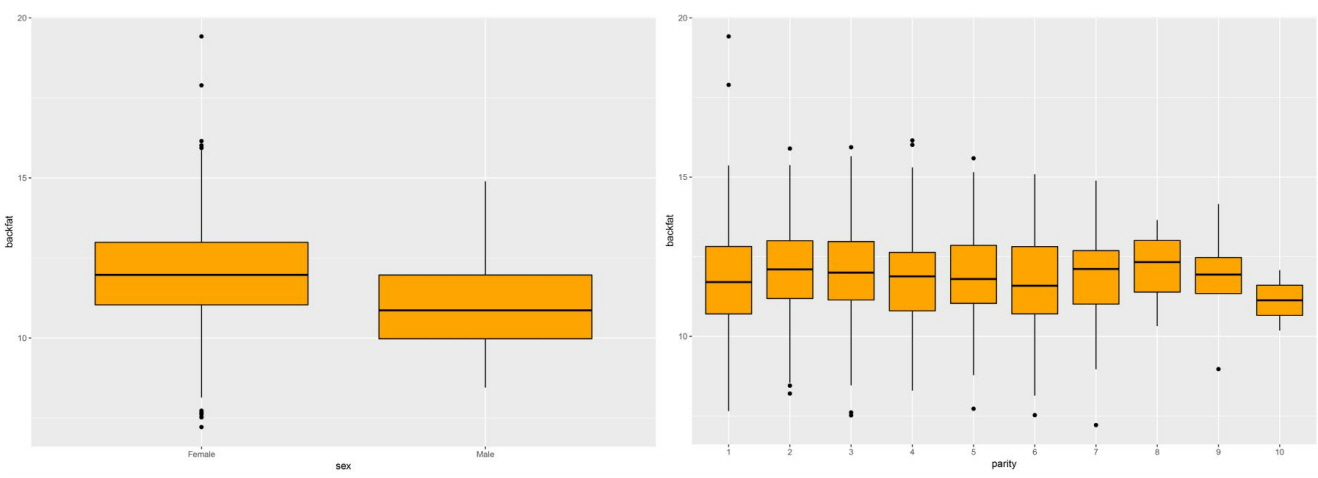
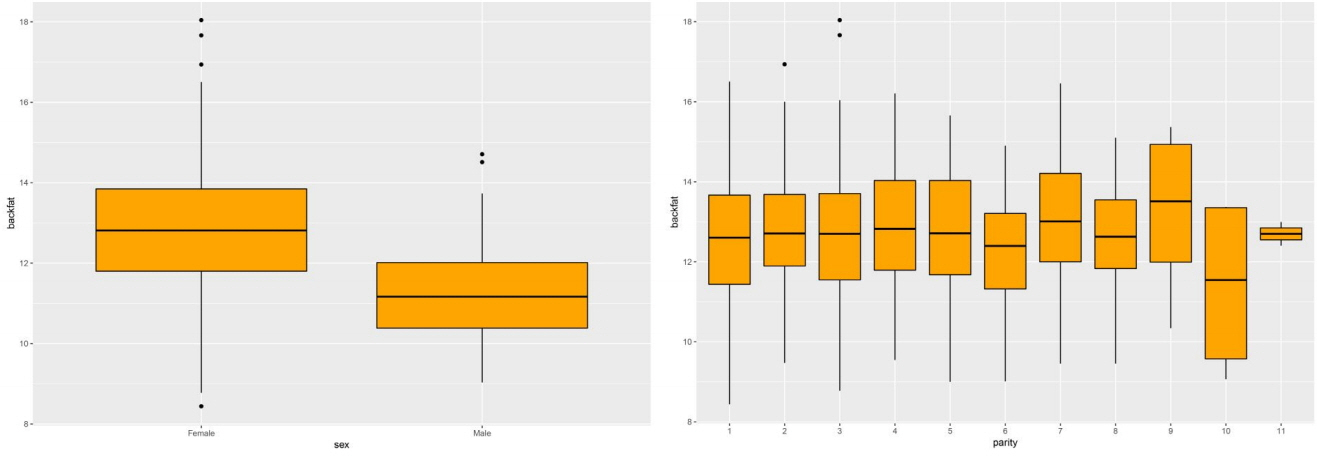
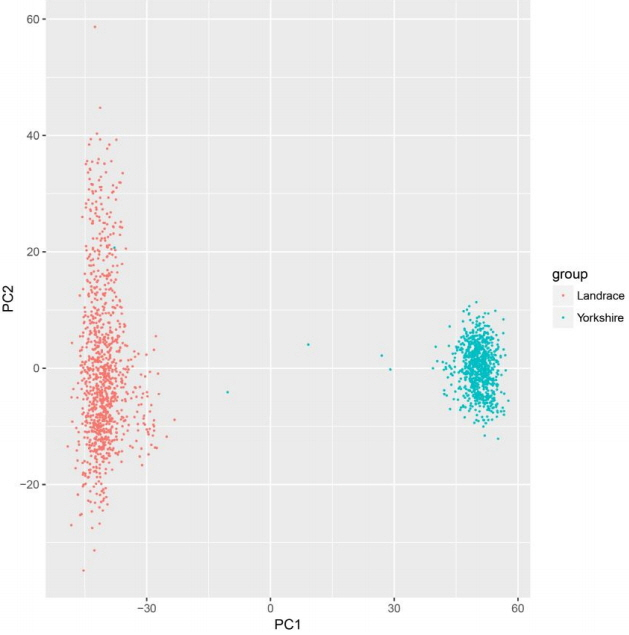
The GWAS was performed and the p-values were FDR-corrected. Fig. 1 shows the Manhattan plot across chromosomes. In our analysis, SNPs on chromosome 1 were frequent and the SCAI, AFG1L, and RIMS1 genes on chromosome 1, SPDEF on chromosome 7 were the most significant genes after FDR correction. The SCAI gene is a suppressor of cancer cell invasion. AFG1L is an ATPase family gene 1 homolog. RIMS1 is a member of the Ras superfamily of genes and a synaptic protein that regulates synaptic vesicle exocytosis. SPDEF encodes SAM pointed domain-containing ETS transcription factor. The boxplots of the sex and parity covariates in our model are shown (Figs. 2, 3). The figures show that females had greater BF than males. Table 2 shows the significant SNPs and those containing genes using an FDR cutoff p-value of 0.01. Most of the significant SNPs had a positive beta effect. Fig. 4 represents the quantile-quantile plot (QQ-plot) of GWAS p-values and it shows the normality of our results. Fig. 5 illustrates the principal component analysis in Landrace and Yorkshire breeds to check the population stratification problem between Landrace and Yorkshire samples. It shows separation between Landrace and Yorkshire pigs in PC1 (Principal Component 1).
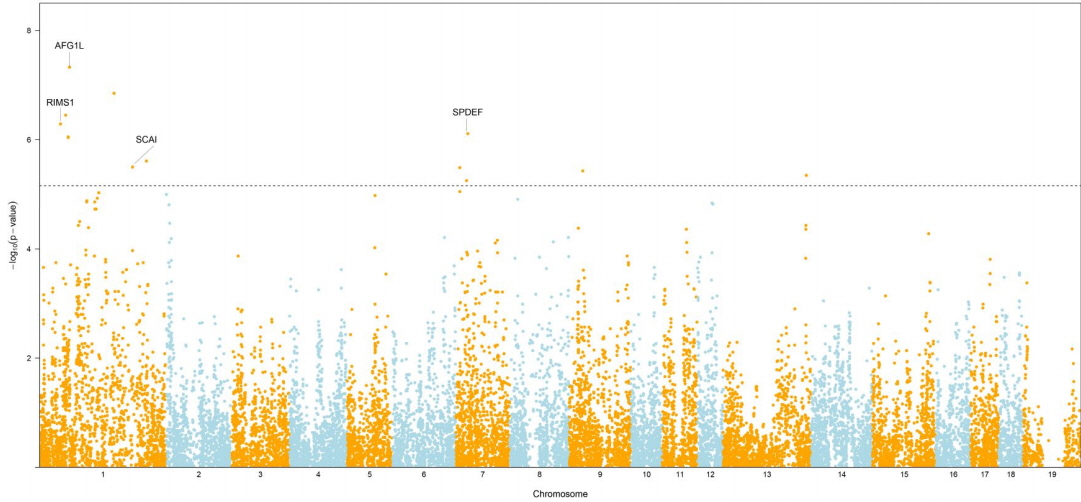
Mahattan plot showing the −log10(p-value) for backfat thickness across chromosomes in Landrace and Yorkshire pigs in Korea. The horizontal dotted line represents an false discovery rate of 0.01.
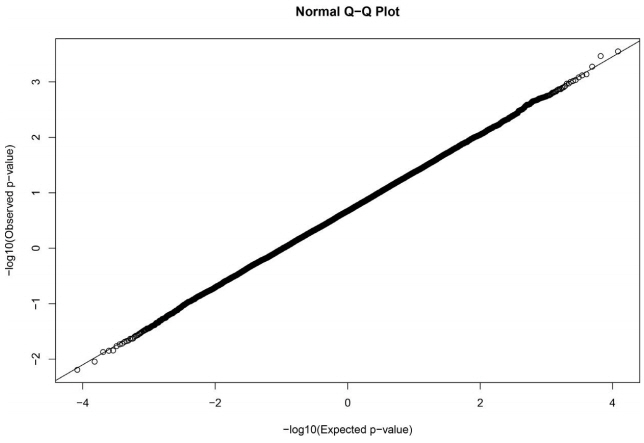
The quantile-quantile plot (QQ-plot) of genome-wide association study p-values. It represents the normality of our results.
GO analysis
A GO analysis was performed in Landrace and Yorkshire pigs in Korea. Table 3 shows the GO terms with a p-value < 0.05. The major GO terms were related to neuronal genes, cell morphogenesis and actin cytoskeleton organization and reorganization. Neuronal genes were reported to be related to subcutaneous fat thickness in human and pig [4]. However, the neuronal genes mentioned above did not match any genes in our neuron-related genes. The neuronal genes were ZNF280D, BAIAP2, LRTM2, GABRA5, PCDH15, HERC1, DTNBP1, SLIT2, TRAPPC9, NGFR, APBB2, RBPJ, and ABL2. We considered the association between fat accumulation and these neuronal genes to be novel. The cell morphogenesis genes were NOX4, MKLN1, ZNF280D, BAIAP2, DNAAF1, LRTM2, PCDH15, NGFR, RBPJ, MYH9, APBB2, DTNBP1, TRIM62, and SLIT2. In addition, the actin cytoskeleton organization and reorganization genes were MKLN1, BAIAP2, PCDH15, BCAS3, MYH9, DTNBP1, ABL2, ADD2, and SLIT2. Among these genes, PCDH15 is related to individual noise-induced hearing loss (NIHL) susceptibility. NIHL is a commonly recorded disorder, accounting for 7% to 21% of hearing loss [9]. NGFR is the nerve growth factor receptor [10] and dystrobrevin-binding protein 1 (DTNBP1) is an NMDA-receptor mediated signaling gene. NMDA is N-methyl-D-aspartate and DTNBP1 has the ability to modulate synaptic plasticity and glutamatergic transmission through NMDA receptors [11]. BAIAP2 is the brain-specific angiogenesis inhibitor-1 associated protein gene [12].
Discussion
Genome-wide association studies
The commercial pig breeds in Korea are mainly the Landrace, Yorkshire, Duroc and Berkshire breeds. Among these breeds, we analyzed GWASs of backfat thickness using the Landrace and Yorkshire breeds. Although there is a pig QTL database (QTL DB, https://www.animalgenome.org) associated with BF, we aimed to determine the significant variants and those containing genes by using the Korean pig population. While the QTL DB provides much information about QTL and significant genes, detailed information about the significant genes is not available. Thus, a GWAS should be performed with the QTL information.
Neuron-related terms in the GO analysis
It was reported that neuronal genes are closely related to fat accumulation [4]. Lee et al. [4] used local genomic sequencing and SNP association to identify genes for subcutaneous fat thickness. They reported that NEGR1, SLC44A5, PDE4B, LPHN2, ELTD1, ST6GALNAC5, and TTLL7 are fat-associated neuronal genes. However, in our analysis, these genes did not appear. This may be because the aforementioned study used Korean native pig. We examined BF in Korean Landrace pigs. Despite this difference, neuron-related terms were also major ones in our analysis. In Yorkshire pigs, neuronal genes were also found. The neuronal genes ZNF280D, BAIAP2, LRTM2, GABRA5, PCDH15, HERC1, DTNBP1, SLIT2, TRAPPC9, NGFR, APBB2, RBPJ, and ABL2 were not yet reported. In our study, these genes reported in the GWAS of pigs but they have been reported in GWASs of cattle, chickens, and sheep.
Actin cytoskeleton organization and cell morphogenesis genes
Among the actin cytoskeleton organization genes and cell morphogenesis genes, PCDH15, NGFR, DTNBP1, and BAIAP2 are also neuronal genes and thus can be classified into the GO terms of neuronal genes. These genes obviously play a role as neuronal genes, actin cytoskeleton organization genes (BAIAP2 gene) and cell morphogenesis genes (PCDH15, NGFR, and DTNBP1 genes). These genes not only play a role as neuronal genes but also act as actin cytoskeleton organization and cell morphogenesis genes. Interestingly, these neuronal genes are associated with brain function, nerves and diseases. Thus, some of the backfat-associated genes play a neuronal role. We expect that how backfat and neuronal genes or neuropathic genes are related to each other will be revealed.
Notes
Authors’ contribution
Conceptualization: YSL, DS
Data curation: DS
Formal analysis: YSL
Methodology: YSL, DS
Writing – original draft: YSL
Writing – review & editing: YSL, DS
Acknowledgments
This research was supported by the Basic Science Research Program through the National Research Foundation of Korea (NRF) funded by the Ministry of Education (No. NRF-2017R1A6A3A11033784 & NRF-2017R1C1B3007144).


