Introduction
Protein is a primary component of living organisms that has structural and chemical roles. Among the many characters of proteins, the structural information has been a major concern for biological and pharmaceutical studies for its intimate relationship to the function of the protein. Most of the databases of protein structure utilize structure analysis, based on the 3D representation of the positions of protein atoms. The space of possible positions of atoms of proteins, however, could be described using the torsional representation of atoms along the axis of covalent single bonds. Most of the movements of atoms are actually limited to the rotations along the single bond axes, considering the rotational property of covalent single bonds and the infrequency of the change of the length and angles of the covalent bonds for high-energy barriers. The reliability of this torsional system, which represents the native processes of structural change in the structural analysis, was partially proven by previous research of structure alignment [1]. In most typical representation systems of protein structures, the 3D structure of proteins is represented by Cα atom positions on the Cartesian system. Better homology delineation was achievable by applying the torsional representation of backbone structures than a typical Cartesian system in the structure alignment. The structures of two proteins were aligned using the information of the torsion angles of Cα atoms of the backbones to compare the structural similarity. The strings of the torsion angles of the two protein backbones were compared using a sequence alignment algorithm. The conducted backbone torsion angle-based structure alignment has advantages over typical structure alignment methods from the comparison of backbone topology, rather than the general globular 3D shape of proteins [2]. The better accuracy of the torsion angle system in the structural alignment analysis was utilized for the construction of a relevant information repository. Thus, a structural information repository and analysis tool based on better structural representation of a torsional system might be appreciable. Here, the secondary structural information- and structure comparison function-providing web server, based on the backbone torsional representation of a protein structure, is newly introduced. The structure alignment function with torsion angles of amino acid backbones was supplied in a developed web server. Functions of secondary structure database search, secondary structure calculation, and protein pair-wise structural comparison are supplied. The secondary structure of protein data bank (PDB) and structural classification of proteins (SCOP) entries are supplied using MySQL infrastructure. Protein secondary structure calculation and pair-wise comparison functions are supplied, based on JAVA/JSP infrastructure.
Computational Methods
The newly developed web server serves information of the constructed secondary structure database from prebuilt 3D structure databases using a classification scheme, driven from backbone torsion angles. The utility of protein structure comparison, based on the backbone torsional representation, is also provided by the server. Details of the classification scheme of secondary structures, the comparison method, and the similarity measurements are as follows.
Secondary structure determination
Three categories of "helix," "extended," and "others" were used for the classification of the secondary structures of each residue. Secondary structure determination for each residue referred to the backbone torsion angle values. Amino acid residue was classified into "helix" if the backbone torsion angles belonged to the range of (φ, ψ) = (-155° to -47°, -62° to -52°), (-104° to -47°, -52° to -37°), and (-117° to -104°, -52° to -37°). A residue was classified into the "extended" secondary structure if the backbone torsion angles belonged to the range of (φ, ψ) = (-155° to -138°, 90° to 155°), (-140° to -64°, 90° to 180°), (-64° to -53°, 90° to 100°, or 110° to 168°). Residues with backbone torsion angles belonging to other ranges were classified as "others." The range was determined based on typical Ramachandran plots.
Pair-wise structure alignment
Two measurements (RamRMSD and logPr) were used to determine the structural similarity of two aligned proteins, as described in the previous structure alignment study [1]. RamRMSD was named for the value representing the distance of the two points of the residues on the Ramachandran plots of the two proteins. While RamRMSD is the root mean square deviation of the Euclidean distance of the φ and ψ angles of matched residues, which is similar to the measurement of Δt used by Karpen et al. [3], logPr is the statistical quantity that describes the probability that a closer alignment than observed is possible. In this study, both the geometric distance of RamRMSD and statistical quantity of logPr were utilized for the assessment of the structural similarity [2]. The Euclidean distance can be defined as follows:
where D is the distance and
where φ1 and φ2 are φ angles from each residue and ψ1 and ψ2 are ψ angles from each residue. Conditional terms are added to find the smallest distance between any two angles with our -180° to +180° notation; i.e., for example, not to consider the distance of two angles, +180° and -180°, as 360° apart rather than 0° apart. The RamRMSD would be as follows:

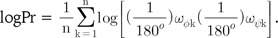
where n is the total number of residues to be compared and Dk is the distance of points of kth residues of each protein on each Ramachandran plot as defined above. RMSD is weak to small number of local deviations [4]. logPr circumvents this problem of the RMSD and is defined as the logarithm of the mean probability of finding a closer angular similarity than the observed similarity in a random environment between each torsion angle pair of compared chains.
If the difference of the φ and ψ angles is defined as a vector Ω (ωφ1, ωψ1, ωφ2, ωψ2, … , ωφn, ωψn), where ωφk is the difference of two φ angles of the kth amino acid of each n-residue-long string and ωψk is the difference of two ψ angles of the kth amino acid of each n-residue-long string, the constant probability density function ρ (ω) and the Pr-value in a random environment could be mathematically written as follows:
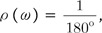
where ω is the angular difference, and
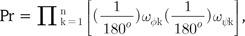
where n is the number of total residues being compared and every angular difference is presumed to be statistically independent. Because multiplied values range from 0 to 1, the Pr-value is more strongly dependent for small values than for large values. We used the logPr-value to circumvent a computational overflow problem and used log base 10 for easy comprehension of the order of magnitude of the probability, Pr. Also, Bonferroni correction was applied for proper comparison of the similarities from protein pairs of different length. Thus, the logPr value could be defined as follows.
Global alignment with no gaps was performed using these two measurements. The comparison frame was shifted by a single residue for each frame with boundary conditions for the most similar alignment.
Parameter settings for alignments and clustering
Global alignment with a gap open penalty of 13, extension penalty of 3, and free end gap penalty was conducted for sequences of 30 proteases and 30 kinases. A UPGMA algorithm with bootstrapping of 100 replicates was used for tree construction from a sequence of proteases. CLC bioinformatics workbench was used for alignment and tree calculation, and the Geneious workbench was used for graphical representation. (8 + logPr), RamRMSD, and (1-TM-score) were used for distance, and a Fitch-Margoliash algorithm was employed for building trees from protein structures. TM-score was normalized by the size of the target protein of the comparison pair. An appropriate integer (8) was added to logPr to make distances positive. Trees were generated from a distance matrix using the FITCH program of the PHYLIP package. The Geneious workbench was used for graphical representation of trees.
Receiver operating characteristic (ROC) curve analysis
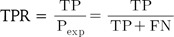
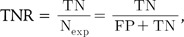
ROC curve analysis illustrates the accuracy of a binary classifier with graphical representation of the specificity and sensitivity with varying threshold for the discrimination of true and false pairs on a plot. After setting a threshold for the delineation of positive and negative classes, true positive (TP), true negative (TN), false positive (FP), and false negative (FN) are defined. The sensitivity, or true positive rate (TPR), and specificity, or true negative rate (TNR), are defined as follows:
while numerical ROC values are also defined as follows:
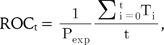
where Ti signifies the number of true positives ranked
ahead of the ith false positive. An ROC curve was drawn following these calculations. To draw the curve, the thresholds are varied from the ones for the most sensitive discrimination, where all predictions are positive, to the one for the most specific discrimination, where all predictions are negative. A good classifier would show high sensitivity and high specificity concurrently. The more accurate classifier displays an earlier and steeper increase of the curve, while a less accurate classifier displays a less steep increase in the lower left region. Thus, the area under the curve could possibly signify the accuracy of the classifier. Area under the ROC curve (AUROC) was calculated using approximations of the curve, with a grid width of 0.01.
Web Application Implementation
The secondary structure database was constructed from 92,998 PDB chains and 64,799 SCOP entries based on the simple classification scheme according to the backbone torsion angles (http://lcbb.snu.ac.kr/TorsWebDB). SCOP entry 3D structure files were obtained from the ASTRAL PDB style database [5-7]. The function of the calculation of new secondary structures is additionally supplied. The backbone torsion angle-based structure alignment tool is also supplied by the newly developed web server. The platform of the web application was built in the machine with an AMD phenome II quad-core CPU (3.0 GHz) and openSUSE Linux 11.2 operating system. JAVA/JSP infrastructure was utilized for the construction of the server platform.
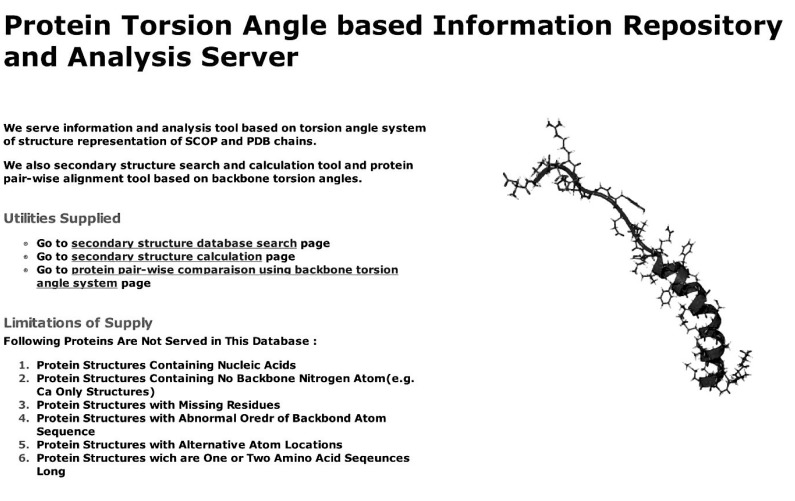
The web application introduced here offers functions of secondary structure database search, secondary structure calculation, and pair-wise protein structure comparison. The index page of the server web application supplies hyperlinks to the three functions, along with a general introduction and the explanation of the cases of limitations in the supply of data (Fig. 1). The query for each function is input, and the result is retrieved through JSP pages in coordination with MySQL database engines in the case of the secondary structure database search. The results of the secondary structure database search query display information of entries of the searched database that satisfy the criteria (Fig. 2). Protein structure comparison supports pair-wise comparison of proteins from both uploaded files and specified IDs of SCOP entries, and the result of the comparison displays logPr and RamRMSD values as similarity measurements and CPU times that were spent for the calculation of each value (Fig. 3).
Example of Application
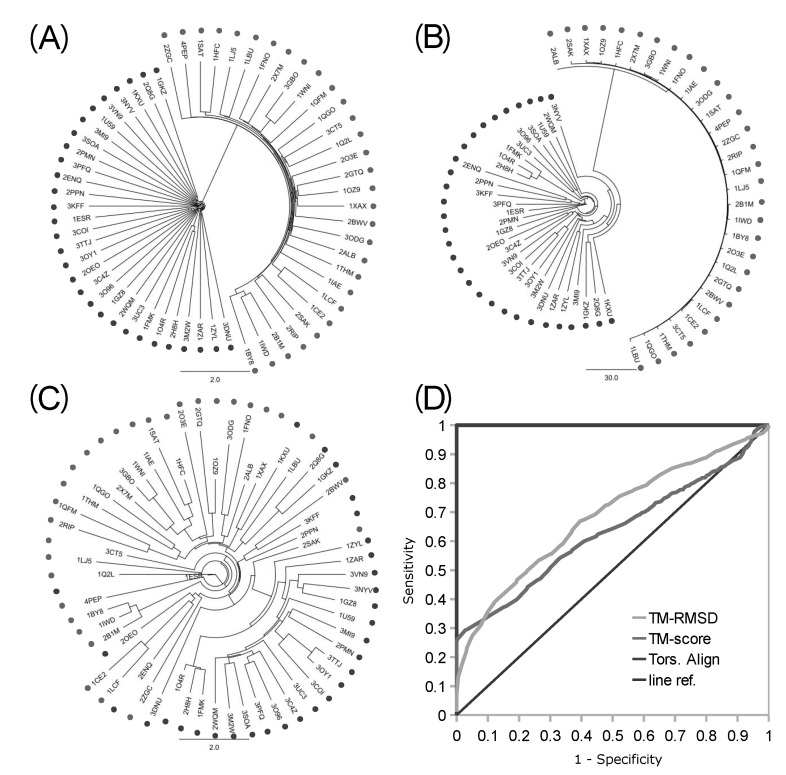
The robustness of the backbone torsion angle method in structure alignment was partly validated before by the clustering analysis of 4 types of proteases [1]. More distant groups of proteins were used for the assessment of the accuracy of the backbone torsion angle method here. A mixed set of 30 kinases and 30 proteases were clustered, and the accuracy of delineation was analyzed with the resulting 1,770 pairs (Fig. 4). Trees of clustering from logPr (Fig. 4A) and RamRMSD (Fig. 4B) measurements showed an apparent delineation of kinases from proteases. The distances between these two groups were very long, so that one could easily recognize the perfect separation of each from the other. The distances among kinases and proteases each were rather comparable in the case of logPr measurements, while RamRMSD showed much shorter distances of proteases than those of the kinases. The difference between the distances of the two measurements might have originated from the weighting of the smaller distance in the case of logPr, which might have caused the distances among kinases to shrink. The logPr and RamRMSD tree showed a smaller distance between internodes than the distance between terminal leaves and the last internode, indicating that structural information is quite homogeneous within the group of identical functional homology. The clear discrimination of two homology group members indicates that the structural classification is strongly robust with the backbone torsion angle method, especially in the case of a lucid functional difference.
The clustering tree from the TM-align RMSD measurement did not show clear delineations between kinases and proteases, while it showed some aggregations of each as subclusters (Fig. 4C). Though 22 kinases were posed close to each other, members of this major cluster of kinases were in very close proximity to members of the protease group, making them hard to be clearly separated from proteases, referring the pair-wise distances. Furthermore, 8 kinases were posed within the cluster of proteases. The distribution of pair-wise distances among 60 proteins was also rather even. This incomplete separation markedly shows the better ability of our backbone torsion angle method than the conventional 3D alignment algorithm, like the TM-align method. The inferior performance of TM-align might be due to the inconsideration of connectional information among the matched Cα atoms. Neglect of this information might have made the algorithm crucially vulnerable to the similar ostensible shape, with different topology of the connecting backbones. According to our previous finding [2], the proteins generally adopt strong globular structures, and the most significant difference among proteins is the topology of the backbone structure. Thus, there is a possibility that TM-align might have been misled by the general globular positions of Cα atoms. This partly indicates the robustness of backbone torsion angle alignments and the possible problems of 3D methods that neglect the connectional information of matched reference points.
The numerical measurement of accuracy of both of our new backbone torsion angle-based method and the typical 3D method of TM-align was performed with ROC curve analysis (Fig. 4D). Fortunately, our new method, with both logPr and RamRMSD measurements, showed perfect accuracy, with an AUROC of 1.0, which means that every pair-wise distance might be correctly classified as true or false pairs. This clear discrimination reflects the long distance between the two groups in the trees of logPr and RamRMSD measurements (Fig. 4A and 4B). The TM-align method with RMSD and TM-score measurements, however, showed no marked improvements in this more clearly distinctive set than the set of protease subtypes of a previous study [1], possibly indicating less robustness of 3D methods in more distinctive cases of functional differences. This is also shown by the similarity of the AUROCs of the RMSD (0.6846) and TM-score (0.6319) to the previous ones of 0.5965 and 0.5494 each. The TM-score result showed worse performance than that of the RMSD result in the TM-align method assessment.
Conclusion
In this study, torsion angle-based representation of the protein backbone structure was utilized for the construction of a secondary structure information repository and analysis tool of pair-wise structure comparison. This web application provides a search interface for deposited secondary structures of PDB and SCOP entries and a secondary structure calculation utility for the user's own structures. It also supports a pair-wise protein structure comparison utility that is more accurate than the typical 3D alignment method in both cases of clear functional differences, as shown here, and very similar functional homologies, as shown previously [1]. The web server tries to explain in as much detail as possible the changes and occurrence of exceptions along the computational processes.
A secondary structure search through a query string using sequence alignment algorithms might be possible for further improvements. Future protein structure research might be aided more through a secondary and tertiary structure homology search utility. A tertiary and quaternary structural information repository might be possible to be newly built by automatically utilizing the possibility of 1D representations of protein structures using backbone torsion angles and better accuracy of structural homology delineations of the comparison tool that was provided here. The information derived from this web application might be further utilized in the field of ab initio protein structure modeling or protein homology-related analyses.