Mutation Analysis of Synthetic DNA Barcodes in a Fission Yeast Gene Deletion Library by Sanger Sequencing
Article information
Abstract
Incorporation of unique barcodes into fission yeast gene deletion collections has enabled the identification of gene functions by growth fitness analysis. For fine tuning, it is important to examine barcode sequences, because mutations arise during strain construction. Out of 8,708 barcodes (4,354 strains) covering 88.5% of all 4,919 open reading frames, 7,734 barcodes (88.8%) were validated as high-fidelity to be inserted at the correct positions by Sanger sequencing. Sequence examination of the 7,734 high-fidelity barcodes revealed that 1,039 barcodes (13.4%) deviated from the original design. In total, 1,284 mutations (mutation rate of 16.6%) exist within the 1,039 mutated barcodes, which is comparable to budding yeast (18%). When the type of mutation was considered, substitutions accounted for 845 mutations (10.9%), deletions accounted for 319 mutations (4.1%), and insertions accounted for 121 mutations (1.6%). Peculiarly, the frequency of substitutions (67.6%) was unexpectedly higher than in budding yeast (~28%) and well above the predicted error of Sanger sequencing (~2%), which might have arisen during the solid-phase oligonucleotide synthesis and PCR amplification of the barcodes during strain construction. When the mutation rate was analyzed by position within 20-mer barcodes using the 1,284 mutations from the 7,734 sequenced barcodes, there was no significant difference between up-tags and down-tags at a given position. The mutation frequency at a given position was similar at most positions, ranging from 0.4% (32/7,734) to 1.1% (82/7,734), except at position 1, which was highest (3.1%), as in budding yeast. Together, well-defined barcode sequences, combined with the next-generation sequencing platform, promise to make the fission yeast gene deletion library a powerful tool for understanding gene function.
Introduction
The fission yeast Schizosaccharomyces pombe is a eukaryotic model organism that has become useful in studies of the cell cycle and chromosome dynamics [1]. According to a phylogenic tree, fission yeast is separated from the other model yeast—the budding yeast Saccharomyces cerevisiae—by an estimated 1,000 million years of evolution [2]. Fission yeast has the smallest genome among eukaryotes, with a haploid genome size of 13.8 Mb, covering ∼5,000 open reading frames (ORFs) compared with >5,500 for budding yeast [3]. Like budding yeast, fission yeast is also genetically tractable. Its popularity in studying mammalian cell biology has led to its nickname, “micro-mammal.”
Genomics has benefited from innovative advances in the field of genetic engineering. Especially, genomewide gene deletion allows the qualitative and quantitative functional analysis of genes en masse. The budding yeast is the pioneer model organism for gene deletion collections, facilitating feasible parallel growth analyses [4]. Next to the budding yeast gene deletion library, the fission yeast gene deletion library has been reported by our team [5], supplying powerful resources for cell cycle and cell shape genes [6]. The fission yeast gene deletion library was constructed using a similar strategy to the one used in budding yeast. In brief, for each strain, the ORF was replaced and tagged by homologous recombination with a deletion cassette. Each correct deletion strain was confirmed by at least one successful colony PCR out of a pair of colony PCRs from both ends of deletion cassettes. In addition, a pair of unique barcode tags was built on each deletion strain to enable the identification of genes that are affected by specific growth conditions without prior knowledge of gene function [7]. For example, the growth fitness of each strain under a chemical treatment can be measured in a highly parallel manner [8].
However, its extensive usage combined with microarray has been hampered by the high rate of mutations in barcode regions that are introduced during strain construction. According to a previous analysis of barcode sequences in budding yeast, at least 18% to 31% of the genome-integrated barcodes contain differences from those originally synthesized, depending on the sequencing method [9, 10]. Also, in a preliminary study, the fission yeast deletion library has been reported to contain ∼30% mutations in barcode sequences [11]. These mutations cause problems of anomalous hybridization during microarray, resulting in false positive signals. Supposing only a 1% hybridization error, there exist >50 false-positives among ∼5,000 ORF genes in fission yeast. To circumvent the problem caused by barcode mutations, next-generation sequencing (NGS) technology has been applied to replace the microarray method [10]. No internal mutations in barcode regions matter, because the innovative NGS protocol directly counts each barcode in a complex sample via genomic deep sequencing. For adaptation of the NGS technology, a prerequisite is to characterize the entire sequences of all barcodes.
In the study, for the first time, we assessed the prevalence of mutations of all genome-incorporated barcodes in the fission yeast deletion library by Sanger sequencing. The results in this work, combined with the NGS platform, promise to harness the fission yeast gene deletion library for understanding gene function.
Methods
Oligonucleotides, medium, the gene deletion library, and DNA samples
All synthetic DNA oligonucleotides were obtained from Bioneer (Daejeon, Korea). Cultures were grown in YES medium (0.5% yeast extract, 3% glucose, and the appropriate amino acid supplements) at 30oC, following the instructions [12]. Genomic DNA from the fission yeast gene deletion library was extracted using the Quick-DNA Fungal/Bacterial kit (Zymo Research Co., Irvine, CA, USA) and then resuspended in distilled water until use.
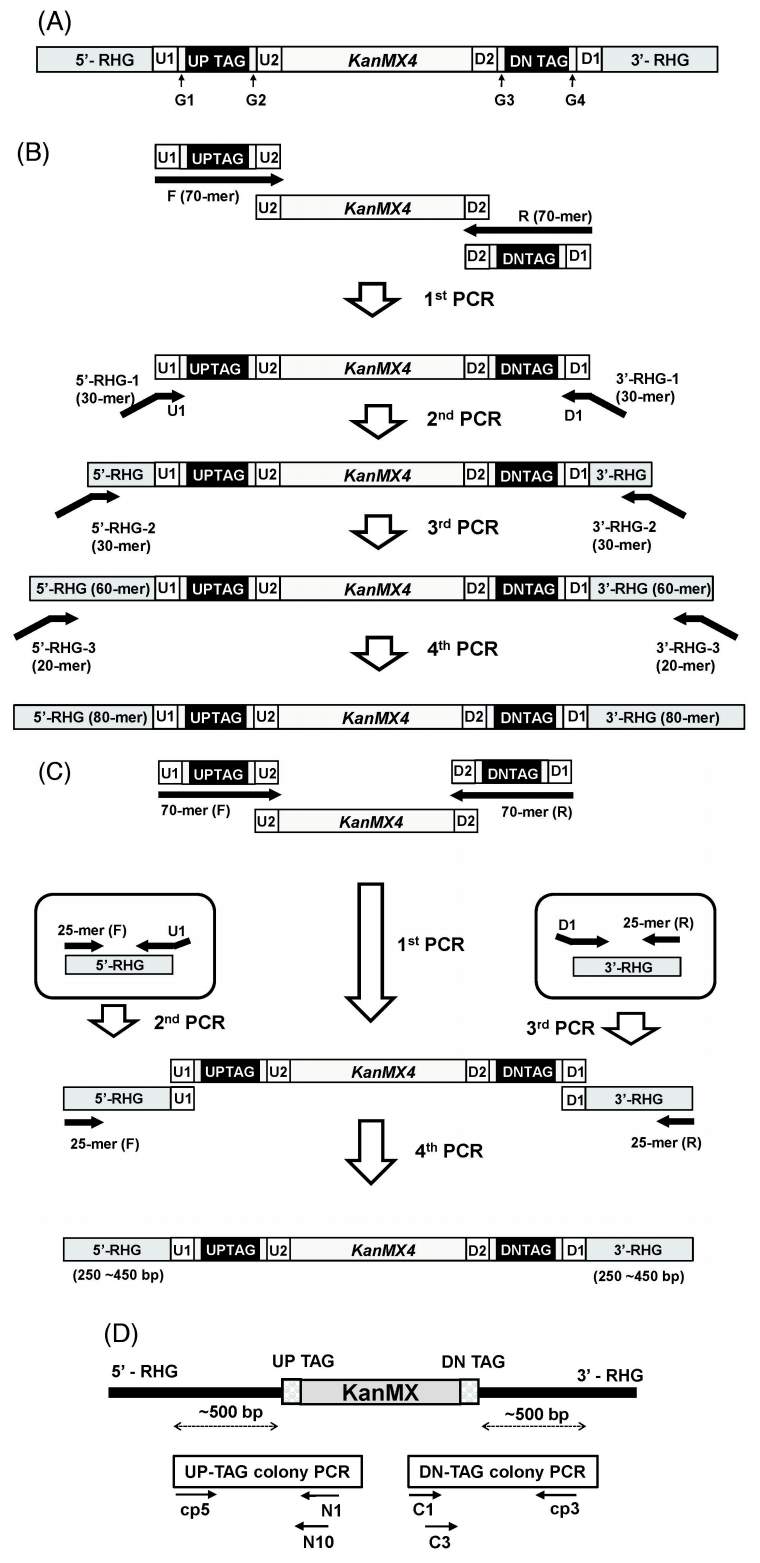
The gene deletion library used in this study was constructed based on the principle of homologous recombination, as previously reported [5]. In brief, for each strain, the ORF was replaced and tagged by homologous recombination with a deletion cassette consisting of the KanMX module [the selectable resistance gene KanMX4 and a pair of unique 20-mer molecular barcodes (up-tag and down-tag) on both sides flanking the KanMX4 gene] and its flanking homologous regions to the chromosome (Fig. 1A). Deletion cassettes were prepared by two different methods: serial or block PCR (Fig. 1B and 1C). The latter one was designed to have longer flanking homologous regions, resulting in a higher recombination rate than former. Among the 4,354 strains used in this study, 2,886 and 1,468 strains were made by the block and serial PCR methods, respectively.

Construction overview of fission yeast gene deletion strains. (A) Structure of the deletion cassette consisting of the KanMX module and its flanking RHG (Region of Homology to the Gene of interest). The KanMX4 module is flanked by unique barcodes and RHG on both sides. The deletion cassette replaces the open reading frame of interest by homologous recombination. The length of the RHG is from 80 bp to 250‒450 bp, depending on construction method. (B) Serial PCR method. For serial PCR method, 4 rounds of PCR were performed overall. The purpose of the first PCR is for preparation of the KanMX module. Through another 3 rounds of PCR, the RHG of the 80-mer was finally prepared for homologous recombination. (C) Block PCR method. For block PCR method, 4 rounds of PCR were performed overall, as with the serial PCR method. The first PCR is same as the serial PCR method for the preparation of the KanMX module. Two separate PCRs using 51-mer and 25-mer primers and chromosomal DNA as templates were then performed for the preparation of a pair of RHG blocks flanking the KanMX module. Finally, three separated blocks were combined by block PCR. (D) Strategy of colony PCR. For Sanger sequencing, barcode regions were PCR-amplified as indicated. Note that the cp5 and cp3 primers are gene-specific primers. They are around 500 bp apart from the homologous recombination site of each gene deletion cassette. For the sequences of the primers used, refer to “Methods.”
The oligonucleotide sequences used in the construction of the KanMX4 module were as follows: UP-tag (20-mer), unique barcode sequence assigned to each ORF; DN-tag (or DOWN-tag, 20-mer), unique barcode sequence assigned to each ORF; U1 (20-mer), common priming site 1 for amplifying UP-tags, 5ˊ-CGCTCCCGCCTTACTTCGCA-3ˊ (sense); U2 (18-mer), common priming site 2 for amplifying UP-tags and homologous to the 5ˊ region of the KanMX4 module, 5ˊ-TTAGCTTGCCTCGTCCCC-3ˊ (sense); D2 (18-mer), common priming site 2 for amplifying DN-tags and homologous to the 3ˊ region of the KanMX4 module, 5ˊ-TTTCGACACTGGATGGCG-3ˊ (sense); D1 (20-mer), common priming site 1 for amplifying DN-tags, 5ˊ-TTGCGTTGCGTAGGGGGGAT-3ˊ (sense); G1 (6-mer), gap sequence 1, 5ˊ-TTTAAA-3ˊ (sense); G2 (6-mer), gap sequence 2, 5ˊ-GATATC-3ˊ (sense); G3 (6-mer), gap sequence 3, 5ˊ-AGTATC-3ˊ (sense); G4 (6-mer), gap sequence 4, 5ˊ-TTTAAA-3ˊ (sense).
The oligonucleotide sequences used in the serial or block PCR method were as follows: UP-tag forward (70-mer), 5ˊ-U1-G1-(20-mer UP-tag)-G2-U2-3ˊ; 70-mer DN-tag reverse, 5ˊ-D1–G4-(20-mer DN-tag)–G3–D2-3ˊ.
Colony PCR and DNA sequencing
All barcode regions were amplified by colony PCR and subjected to Sanger sequencing. Up-tag or down-tag regions were amplified using a pair of cp5 and N1 primers or C1 and cp3 primers and sequenced using N10 or C3 as a sequencing primer, respectively (Fig. 1D). The gene-specific cp5 or cp3 primer was designed to be located approximately 500 bp from the insertion sites of the deletion cassettes. The oligonucleotide sequences were as follows: N1 5ˊ-CGTCTGTGAGGGGAGCGTTT-3ˊ, C1 5ˊ-TGATTTTGATGACGAGCGTAAT-3ˊ, N10 5ˊ-GATGTGAGAACTGTATCCTAGCAAG-3ˊ, C3 5ˊ-GGCTGGCCTGTTGAACAAGTCTGGA-3ˊ. Sequencing was performed by SolGent Co. (Daejeon, Korea).
Results
Validation of fidelity on sequenced barcodes
In the study, 8,708 barcodes from 4,354 deletion strains covering 88.5% (4,354/4,919) of all ORF genes (4,919) were amplified by colony PCR and used for the analysis of barcode sequences. At that time, 565 strains (11.5%) were under construction by gene synthesis method [15], and they were not available for barcode analysis. As shown in Table 1, out of the 8,708 barcodes from the 4,354 strains tested, 7,734 barcodes (88.8% in total, block PCR 87.7% and serial PCR 91.0%) were validated to be inserted at the correct positions on both sides—so called “high-fidelity.” The remaining 974 barcodes (11.2%, so called “medium- or low-fidelity”) were characterized only on either side.
Evaluation of defects in barcodes
An examination of the DNA sequences obtained from the 7734 high-fidelity barcodes revealed that 6,695 barcodes (86.6%) had no sequence mutation within them (Table 2). In detail, 2,920 strains (5,840 barcodes, 75.5%) had no mutation on either barcode, and 855 strains (855 barcodes, 11.1%) had mutation(s) only on either barcode. In other words, 1,039 barcodes (13.4%) had mutation(s) in the 20-mer molecular barcodes. It is noteworthy that the mutation rate of barcodes made by block PCR was higher by 4.3% than by serial PCR (14.9% vs. 10.6%). It is likely that the key process in block PCR, block-joining, is complicated and creates mutation(s). Among the 1,039 mutated barcodes, 855 mutations were found on either barcode, and 184 mutations were found on both barcodes.
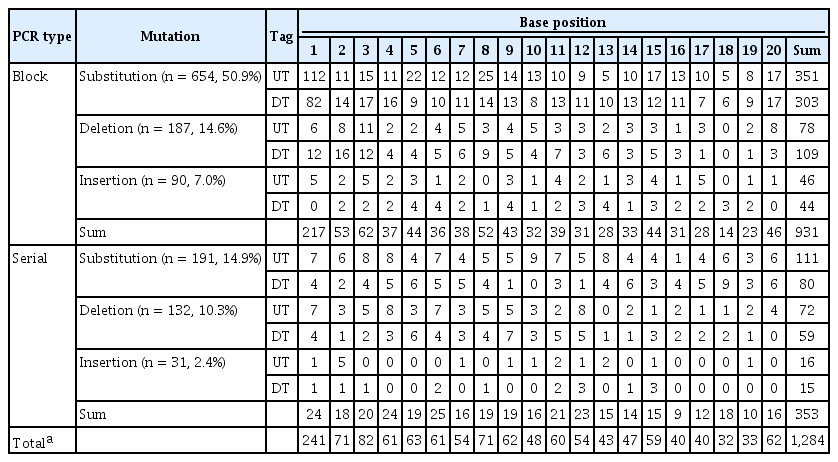
Within the 1,039 mutated barcodes out of the 7,734 sequenced barcodes, 1,284 mutations were found in total, resulting in a mutation rate of 16.6%. There was no significant difference in mutation rate between up-tags and down-tags. When type of mutation was considered for the 1284 mutations (16.6% in total), substitutions accounted for 845 mutations (10.9%), deletions accounted for 319 mutations (4.1%), and insertions accounted for 121 mutations (1.6%). The overall mutation rate was similar between both yeasts (16.6% vs. 18%). Insertions and deletions occurred at a much lower frequency than substitutions. The frequency of insertions (1.6%) was 1 order of magnitude lower than that of substitutions (10.9%).
Types of defects in mutations
The presence of 1,284 mutations within 1,039 barcodes prompted us to examine the types of barcode defects in detail. As shown in Table 3, substitutions accounted for 702 mutated barcodes (67.6%), versus deletions for 177 (17.0%), insertions for 79 (7.6%), and others for 81 (complex and unclassified, 7.8%). When compared with budding yeast (∼28%), the overall occurrence of substitution was unexpectedly high (refer to Discussion).
Mutation rate by position within 20-mer barcodes
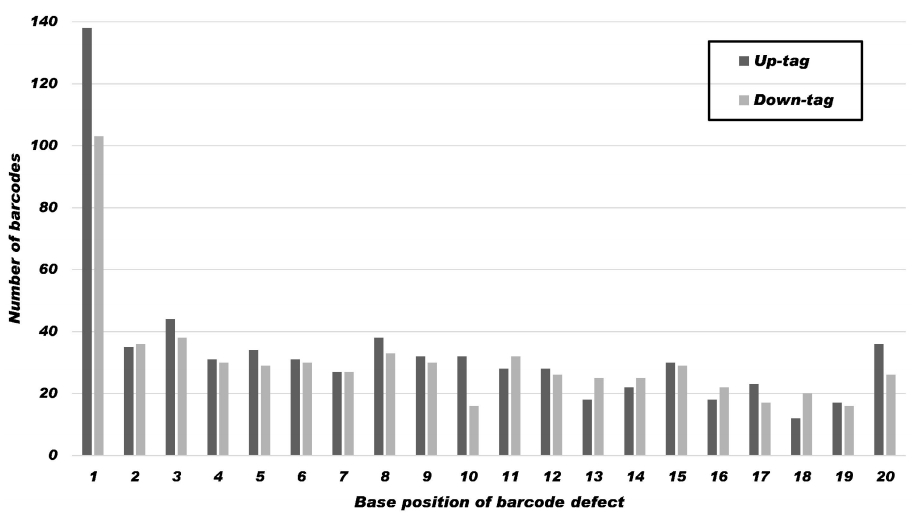
To estimate the mutation rate by position within 20-mer barcodes, 1,284 mutations from 7,734 Sanger-sequenced barcodes were analyzed. As shown in Table 4 and Fig. 2, there was no significant difference between up-tags and down-tags at a given position. The mutation frequency at a given position was similar at most positions, ranging from 0.4% (32/7,734) to 1.1% (82/7,734), except at position 1, which was highest (3.1%). Intriguingly, the mutation frequency showed an increasing tendency from position 20 to position 1 in a similar manner as budding yeast [9]. The phenomenon is consistent with a decrease in the fidelity of the solid-phase chemical synthesis with distance from the first position at the 3’-end of each oligonucleotide.

Occurrence of sequence variation by position within tags. The results show a summary of the 1,284 nucleotide sequence mutations in 7,734 Sanger-sequenced up-tags (dark grey) and down-tags (light grey) at a given position. The mutation frequency at a given position in the 20-mer barcode is similar at most positions, ranging from 0.4% (32/7,734) to 1.1%, except at position 1, which is the highest (3.1%). It shows a tendency to increase from position 20 to position 1. For the statistics in detail, refer to Table 4.
Discussion
The 11.2% failure rate (974 barcodes) of validation was unexpectedly high. The phenomenon happened simply because we only analyzed high-fidelity barcodes. When barcodes of lower fidelity that was confirmed only on either side were counted, the success rate increased to 95%. The results suggest that all of the sequenced barcodes did not locate properly because of many causes, including imperfect genome sequence information, redundancy among ORFs (e.g., wtf), and ambiguous PCR products due to sequence defects in PCR priming sites [9]. Therefore, usage of another sequencing method, such as NGS, would increase the success rate of the barcode validation up to >95%, as with budding yeast [10], because NGS technology directly counts barcode sequences without PCR amplification.
The overall mutation frequency (16.6%) in the fission yeast barcodes was similar to that in budding yeast (∼18%) [10]. In detail, the overall rates of deletions and insertions were within reasonable ranges, compared with previous results in budding yeast [9, 10]. However, the substitution rate (702 mutated barcodes, 67.6%) in fission yeast was unexpectedly high compared with budding yeast (∼28%). Moreover, it was well above the predicted error frequency from the raw Sanger sequencing data [16]: 0.1% occurrence per each base position or ca. 2% occurrence within a 20-mer tag. In addition, the high substitution rate might come from intrinsic errors during the solid-phase oligonucleotide chemical synthesis. For example, a single-nucleotide deletion might be expected to occur randomly due to periodic de-blocking failure during the oligonucleotide synthesis. In contrast, substitutions and insertions are less likely to arise during oligonucleotide synthesis, because they should come from mechanical or software errors. However, contamination of the reagents would give rise to a substitution rate of <0.2% per base position or a 4% occurrence within a 20-mer tag. Another explanation for a substitution rate (16.6%) higher than 6% might come from nucleotide misincorporation error (1/103‒104) of Taq polymerase during PCR amplification of the barcode regions. In addition, extra errors might come from errors in base-calling, because only Sanger sequencing technology was used. This will be clarified by additional analyses using NGS technology, which are underway at the moment.
Intriguingly, the sequence mutation of each base position showed a gradient difference within a 20-mer barcode in a similar manner as in budding yeast [9]. Generally, the phenomenon is consistent with a decrease in the fidelity of the oligonucleotide chemical synthesis, depending on the distance from the first position at the 3ˊ-end of each synthetic oligonucleotide. However, the prominent high occurrence at position number 1 is difficult to explain. There is no reason why position 1 had a peculiarly high mutation rate in common, because the 20-mer barcode sequences were located inside the 75-mer oligonucleotide primers used for PCR amplification of the KanMX module in both budding and fission yeasts.
Incorporation of unique barcode tags into the fission yeast gene deletion library has enabled the identification of gene functions by parallel growth fitness analysis [8]. However, the assay system requires renovation of either mutated barcodes or mismatched array sequences, which carry significant up-front costs. To circumvent the expensive situation, an NGS approach is preferred over fixing the previous microarray platform. NGS analysis directly counts each barcode in a complex sample via sequencing using a protocol, called “Barcode Analysis by Sequencing,” or “Bar-seq.” Together, well-defined barcode sequences, combined with the NGS platform, promise to make the fission yeast gene deletion library a powerful tool for understanding gene function. In this regard, the results in this study are a basis for upgrade of the parallel analysis from the previous microarray technology to NGS technology.
Notes
Authors’ contributions
Conceptualization: DK, DUK, KLH
Data curation: MN, SH, SJC
Funding acquisition: ML, DUK, KLH
Experiments: MN, SJC
Data analysis: ML, SH
Writing – original draft: ML, DUK, KLH
Writing – review & editing: ML, KLH
Acknowledgements
This work was supported by a grant from Chungnam National University.


