misMM: An Integrated Pipeline for Misassembly Detection Using Genotyping-by-Sequencing and Its Validation with BAC End Library Sequences and Gene Synteny
Article information

Abstract
As next-generation sequencing technologies have advanced, enormous amounts of whole-genome sequence information in various species have been released. However, it is still difficult to assemble the whole genome precisely, due to inherent limitations of short-read sequencing technologies. In particular, the complexities of plants are incomparable to those of microorganisms or animals because of whole-genome duplications, repeat insertions, and Numt insertions, etc. In this study, we describe a new method for detecting misassembly sequence regions of Brassica rapa with genotyping-by-sequencing, followed by MadMapper clustering. The misassembly candidate regions were cross-checked with BAC clone paired-ends library sequences that have been mapped to the reference genome. The results were further verified with gene synteny relations between Brassica rapa and Arabidopsis thaliana. We conclude that this method will help detect misassembly regions and be applicable to incompletely assembled reference genomes from a variety of species.
Introduction
The genomics era has opened in earnest with the completion of the Human Genome Project. With the development of next-generation sequencing (NGS) technologies, the amount of genomics data has exploded, and sequencing targets have become very diverse. As of 2017, there are 7,930 species of eukaryotes, 192,677 species of bacteria, and 1,412 species of archaea that have been officially registered in NCBI. As the Nagoya Protocol is initiated, it is expected that these numbers will continue to increase in the future due to the policies of each country to secure information on biological genetic resources [1, 2]. Despite the fact that the cost of genomic analysis is declining, there are still a number of technical problems that make it difficult to sequence the genome completely [3]. For example, misassembly due to the inherent limitations of NGS technology is well known [4–6]. Especially in plants, there are many barriers that make plant genomes hard to sequencing, such as Numts, repeats, and genome duplication events [7–9].
Genotyping-by-sequencing (GBS) is a technology that allows high-throughput genotyping by applying NGS technology. It is used to analyze single nucleotide polymorphisms (SNPs) in populations to find molecular markers that are related to phenotype and genotype or to draw genetic linkage maps for plant breeding. By analyzing the pattern of GBS data along each chromosome, one can find out where the gene crossover occurs. On the other hand, a small block that interrupts an otherwise continuous GBS pattern is genetically non-ideal and implies a misassembled region. Therefore, we explored the application of GBS in the detection of misassemblies [10–12].
Brassicaceae is a mustard family containing 372 genera and 4,060 accepted species, and its varieties are cultivated as economically valuable crops not only in East Asia but also globally [13]. The triangle of U theory states that the differentiation of an allotetraploid of Brassica species—Brassica juncea (AABB), Brassica napus (AACC), and Brassica carinata (BBCC)—occurs due to the polyploidization of diploid Brassica species: Brassica rapa (AA), Brassica nigra (BB), and Brassica oleracea (CC). This theory has been proven by genomic analysis by NGS of Brassica species [14–25]. Research on the correlation between the genetic information and the nutrient content of crops has been actively conducted in Brassica genomes [26]. The recently published B. rapa V2.1 genome sequence shows much improved quality, as well as a number of misassembly corrections over the previous version, V1.5 [17]. This offers an interesting opportunity to test the potential of misassembly detection, based on GBS data.
In this study, we propose a user-friendly pipeline, called misMM, which automatically identifies misassembled candidate blocks (MCBs) and adjacent to destination blocks (ADBs) and plots the genetic map of MCBs by using raw GBS data sorted by MadMapper [27]. These results are verified by using the BAC end-sequence library published in NCBI and the gene synteny relation between Arabidopsis thaliana and B. rapa [28–31].
Methods
Data source
The end sequences of B. rapa accession Chiifu-401–42, a Chinese cabbage BAC library (KBrH, KBrB, and KBrS), were downloaded from NCBI and used to verify the putative misassembly genome regions. In order to investigate the gene synteny relation between A. thaliana TAIR10 and B. rapa genome V1.5, the corresponding general feature format (GFF) annotation files and protein sequences of each species were downloaded from http://ensemblgenomes.org and http://brassicadb.org, respectively. The GBS data were produced by a previous study that investigated the correlation between flavonoid content and the genotype of B. rapa in 69 individuals of a doubled haploid F2 generation obtained by microbial culture of an F1 generation cross of two subspecies—yellow sarson of LP08 (B. rapa ssp. tricolaris) and pak choi of LP21 (B. rapa ssp. chinensis)—with distinct morphologies [26]. From the study, genotype data were obtained at a total of 8,176 positions.
Configuration of the misMM pipeline for misassembled block detection
misMM, a pipeline for genome misassembled block detection, was written in a Linux shell and with Python ver. 2.7 in-house codes. The first step is preprocessing: after loading all GBS raw data files, markers with a missing value of over 8% were filtered out. If the neighboring positions had the similar GBS pattern with consistency, they were grouped into one block. Our script then automatically prepared the three kinds of input files (.loc, IDs, and maps) for MadMapper (UC Davis) [27], a package that specializes in recombinant inbred lines analysis using large genetic markers and easy visualizes the 2D pairwise matrix. The next step is the linkage grouping and block shuffling step, performed with MadMapper. By using the default parameters of MadMapper_RECBIT (rec_cut, 0.2; bit_cut, 100; data_cut, 25; allele_dist, 0.33; missing_data, 50; trio_analysis, TRIO; double_cross, 3), linkage grouping and marker extraction were performed by generating a pairwise matrix between GBS patterns of each block. Subsequently, block shuffling was performed by MadMapper_XDELTA (marker fixation, FIXED; shuffle option, SHUFFLE; shuffle block, 6; shuffle step, 3) with each clustered block. At the end of this process, it plotted a genetic map diagram with putative misassembled blocks. In addition, it also generated 2D heatmap graphs for comparing before and after the block shuffling. All of the work flow of this pipeline is described in Fig. 1. The misMM pipeline scripts can be downloaded from http://sskimbnas.ipdisk.co.kr:80/publist/HDD1/misMM/misMM.tar.gz.

Total work flow of misMM. GBS, genotyping-by-sequencing.
Validation using BAC end sequences
In order to confirm the misassembled blocks with experimental data, we extracted 41,969 pairs of end sequences from the BAC libraries (KBrS, KBrH, and KBrB) of B. rapa and carried out sequence alignment against the B. rapa reference genome sequence using Nucmer (MUMmer3.23) with the proper options (--maxmatch, use all anchor matches; -g, global alignment; -I, >95%; -r, sort output lines by reference). The Nucmer results were then filtered for discordant BAC end pairs with one end aligned to the MCB and the other end to the ADB.
Validation using gene synteny relation between A. thaliana and B. rapa
For validation with gene synteny, the protein sequence of B. rapa were matched to those of A. thaliana using BLASTP (Blast 2.2.26), and the top four hits for each query were retained. The tabulated results were then sorted, based on the genomic coordinates of each protein, and the gene synteny relation was examined manually.
Results and Discussion
misMM was developed to provide a streamlined and yet simple-to-use pipeline for the detection of misassembled regions, so-called MCBs, based on GBS data (Fig. 1). This pipeline was tested with the GBS data of B. rapa against the B. rapa V1.5 reference genome, which is known to have some misassembled regions compared to the recently published V2.1 genome [17]. The original linkage score heatmap that was produced by MadMapper showed many off-diagonal cells with a low score that were often clustered in stretch (Fig. 2 left panel). The off-diagonal blocks scoring less than 0.33 were defined as MCBs (Table 1, Fig. 3). For each MCB, the corresponding ADB was identified by MadMapper, based on the linkage score (Table 1). The subsequent shuffled heatmap showed clean clustering, with no low-scoring off-diagonal blocks, implying the unambiguousness of the GBS pattern in detecting misassemblies (Fig. 2 right panel). The MCBs and ADBs were distributed throughout the entire pseudomolecule. A total of 16 MCBs had an average block size of 65,477 bp, and the largest one was 410,190 bp. The average size of the ADBs was 746,707 bp, with a maximum of 4,936,893 bp. The fact that only a few small MCBs were detected and that the corresponding ADBs were large in size implies that the B. rapa V1.5 genome is well assembled overall but has a few problematic regions, as shown by the recent update of the genome [17].
Before and after the results of the 2D matrix graphs of the MadMapper block shuffling analysis. A01 through A10 indicate the Brassica rapa pseudomolecules.
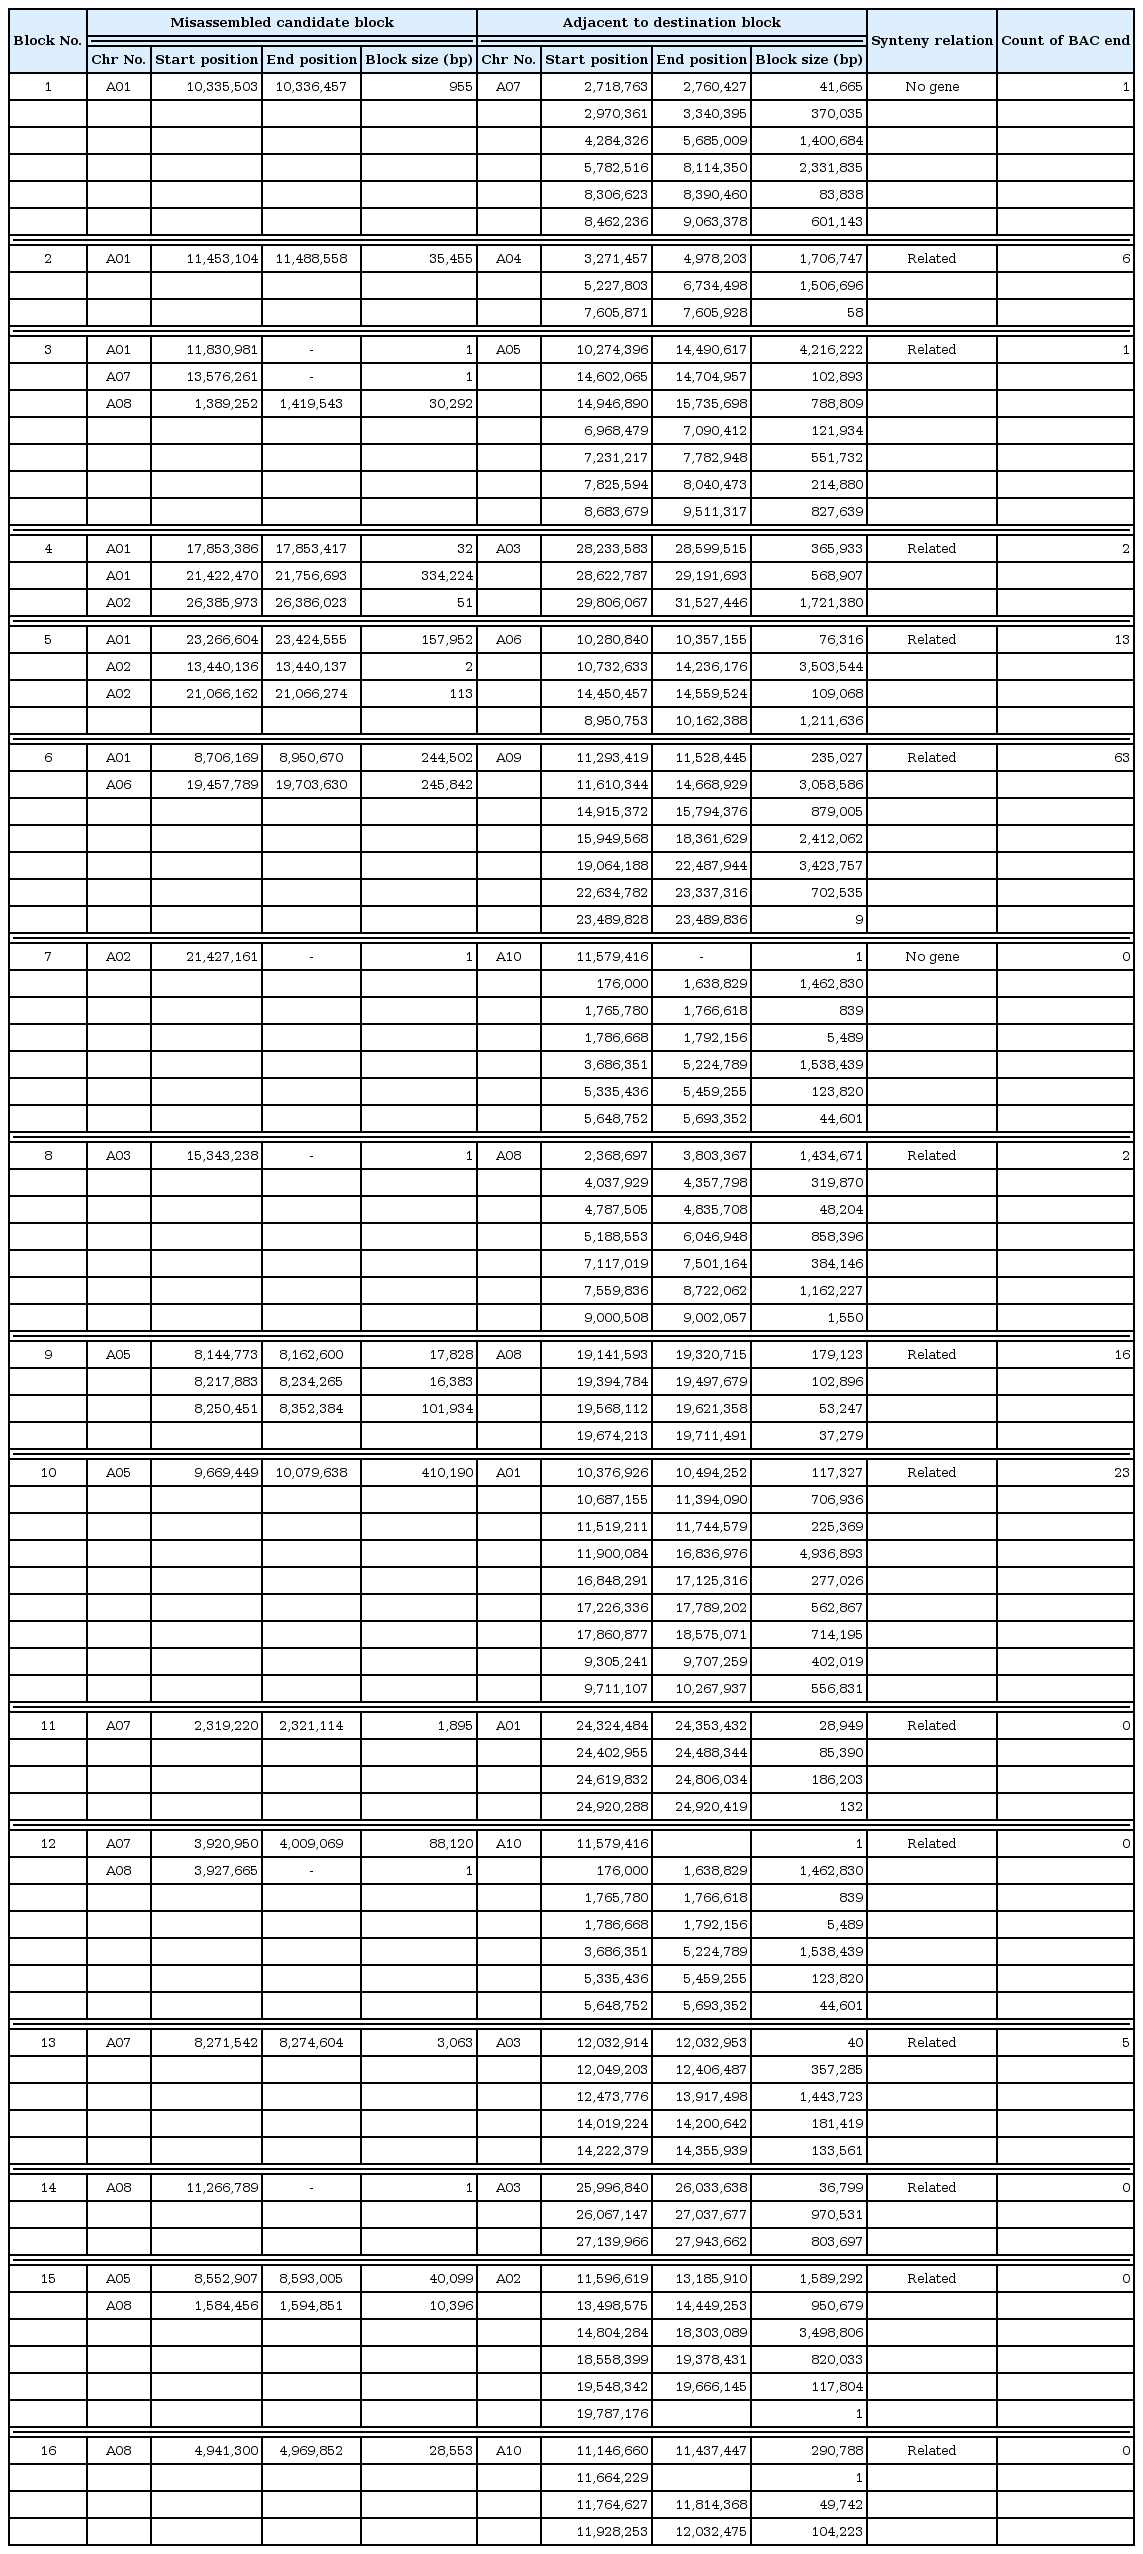
Results of misassembled block detection analysis in Brassica rapa with misMM

Example of Brassica rapa genetic map made with misMM pipeline. Red colors indicate misassembled candidate blocks.
We used two sets of data to validate that the ADBs were indeed in the neighboring area of the MCBs. The first one was used to find discordant BAC end pairs with one end aligned to the MCB and the other end aligned to the ADB. For example, the MCB of block number 2 in Table 1 was located in pseudomolecule A01, ranging from 11,453,104 to 11,488,588, while its corresponding ADBs were found in A04. Table 2 shows the mapping results of the six BAC end pairs of this block, the sizes of which ranged from 671 bp to 1,000 bp, with a mapping identity higher than 97.93%. While one end of the BAC pairs was mapped to the corresponding MCB in A01, all of the other ends were mapped within the ADB, ranging from 3,271,457 to 4,978,203 in A04. Likewise, 10 out of 16 blocks listed in Table 1 could be confirmed by the BAC end results. The true locations of these blocks could be estimated within the span of the corresponding BAC (average 110 kbp). The rest could not be confirmed, probably due to the distance between the MCB and ADB, making it incompatible with the BAC size.

Example of validation of BAC end library results
The other validation method was the use of the gene synteny relation. Compared to the A. thaliana genome, there is evidence that the B. rapa genome has undergone triplication [32]. Accordingly, most of the A. thaliana genes are preserved in gene synteny blocks at three different places. Within block number 2 in Table 1, two B. rapa genes are annotated: Bra033489 and Bra033490 (Table 3). For all 16 genes flanking these two genes, orthologs were identified by BLASTP (Table 4). Eight A. thaliana genes in the middle—including the orthologs of two genes, AT4G14330 and AT4G14350—were out of order and broke the continuity of the synteny in the region. This is consistent with our finding that this MCB is truly misplaced in B. rapa genome V1.5. The true locations of the two B. rapa genes in this MCB can be inferred by mapping the flanking genes of AT4G14330 and AT4G14350 to the B. rapa genome (Table 5). Indeed, a total of six A. thaliana flanking genes were mapped to the B. rapa orthologs that were found in the corresponding ADBs. As expected, the gene synteny of this region is also well preserved. In this way, we can estimate the approximate relative locations of these two genes. Based on this relationship, an analysis was carried out with regard to the relationship of the protein orthologs and gene coordination between the two species. First, two genes were annotated in an example block (Table 3). When these two genes were found in a table arranged by the coordinates of the B. rapa gene, there was no continuity between the ortholog genes and the surrounding genes (Table 4). But, when we sorted this based on the coordination of A. thaliana, the ortholog genes belonging to the ADB were located consecutively around the gene belonging to the MCB (Table 5). Furthermore, the gene order that was inferred here was confirmed in the updated B. rapa V2.1 genome that was recently published [17].

Information on genes included in example misassembled candidate block

Example of protein ortholog list, sorted by Brassica rapa gene coordination

Example of protein ortholog list, sorted by Arabidopsis thaliana gene coordination
In recent years, studies of expression quantitative trait loci that affect mRNA expression or protein expression using SNPs and studies to find markers that affect the environmental adaptation of plants have been becoming widely embraced [33]. For such works, accurate reference genome assembly is required. Toward that goal, our misMM pipeline is a useful tool for the identification of misassemblies in complex genomes using GBS data.
Acknowledgments
This work was funded by a program (PJ01167402) of the RDA (Rural Development Administration) and a program (NRF-2012M3A9D1054705) of the NRF (National Research Foundation of Korea) and computationally supported by a program (NRF-2010-0018156, NTIS1711048528) of the KISTI GSDC.
Notes
Authors’ contribution
Conceptualization: YJK, JSK
Data curation: YJK
Formal analysis: YJK
Funding acquisition: SK
Methodology: YJK
Writing – original draft: YJK
Writing – review & editing: SK, JSK