 |
 |
- Search
| Genomics Inform > Volume 15(3); 2017 > Article |
|
Abstract
MicroRNAs (miRNAs) act as regulators of gene expression by binding to the 3ŌĆÖ untranslated region (UTR) of target genes. They perform important biological functions in the various species. Among many miRNAs, miR-21-3p is known to serve vital functions in development and apoptosis in olive flounder. Using genomic and bioinformatic tools, evolutionary conservation of miR-21-3p was examined in various species, and expression pattern was analyzed in olive flounder. Conserved sequences (5ŌĆÖ-CAGUCG-3ŌĆÖ) in numerous species were detected through the stem-loop structure of miR-21-3p. Thus, we analyzed target genes of miR-21-3p. Among them, 3ŌĆÖ UTR region of PPIL2 gene indicated the highest binding affinity with miR-21-3p based on the minimum free energy value. The PPIL2 gene showed high expression levels in testis tissue of the olive flounder, whereas miR-21-3p showed rather ubiquitous expression patterns except in testis tissue, indicating that miR-21-3p seems to control the PPIL2 gene expression in a complementary repression manner in various tissues of olive flounder. Taken together, this current study contributes to infer the target gene candidates for the miR-21-3p using bioinformatics tools. Furthermore, our data offers important information on the relationship between miR-21-3p and target gene for further functional study.
MicroRNAs (miRNAs) are groups of endogenous small, noncoding, single-stranded RNA molecules 20ŌĆō24 nucleotides in length [1]. The miRNAs bind to the 3┬┤ untranslated regions (UTRs) of its target mRNAs entirely or partly and they act as post-transcriptional inhibitors of gene expression [2, 3]. This event causes specific mRNA degradation or translational repression [4]. Each single miRNA could target numerous mRNAs, and a single mRNA can be targeted by several miRNAs, which allows to coordinate and control regulation of protein inhibition [5]. The miRNAs have played a role in a variety of biological processes such as cell proliferation, cell survival, DNA repair, and immune response [6]. Therefore, complex interactions involved in the regulation of gene expression have been well-established. At least up to 60% of protein-coding genes expressed in various species, and down-regulated more than 1,000 miRNAs [7].
The olive flounder Paralichthys olivaceus is one of the most important fish species that widely cultured in Korea, Japan, and China [8]. Recently, due to lots of consumption, its economic values have increased in the fish markets [9]. However, olive flounder is sensitive to infection of many bacterial pathogens [10] and they can trigger significant economic losses. Therefore, there has been an increase in studies that strive to understand the effects of bacterial infection in olive flounder via quantitative real-time polymerase chain reaction (qRT-PCR) [11]. Genetic variation and population structure among olive flounder populations are estimated using several molecular approaches. Those research results indicated proper yields and retaining genetic diversity [12]. Genetic variation is beneficial and important for the long-term survival of natural populations, as it ensures that a high level of fitness is maintained by giving populations the ability to adapt to changing environmental conditions [13]. Population genetic structure is influenced by the effects of gene flow, natural selection, genetic drift, and mutation [14].
According to the several functional studies, miRNA and their targets interaction in olive flounder indicated involvement in development, apoptosis, and metabolism [6, 15]. One of the representative studies is about the miR-17, and it is about metamorphic development of olive flounder that overexpressed miR-17 in FEC cells and suppressed Cdc42 expression due to miR-17 binds to 3┬┤ UTR of Cdc42 gene. The declined metamorphic development means growth level of olive flounder also diminished [16]. Recently, studies have shown that 21 let-miR-7 precursors control metamorphosis stages from the larval to juvenile form in P. olivaceus. These let-7 miRNAs were shown in different positions of P. olivaceus genome and significantly expressed in adult tissues of olive flounder, but not expressed in embryonic development tissues, indicating that let-7 miRNAs could be associated with tissue development and metabolism process [17]. There is limited evidence between the miR-21-3p expression pattern and the quantitative expression levels of the target gene in various olive flounder tissues. Previous studies reported miR-21-3p function in different fields. For instance, some miRNAs have been found to function as oncogenic miRNAs, this can be observed in the study where miR-21-3p was found to be up-regulated in solid and hematological cancer tissues thus leading to the conclusion that miR-21-3p repress the expression of tumor suppressors like PTEN phosphatase and actin-binding protein tropomyosin I [18-20]. In addition, the set of miR-21 and its target mRNA, TGFBR2, were predicted as high binding affinity in seven types of solid tumor namely; lung, breast, colorectal, pancreatic, prostate, stomach, and bladder that indicated strong molecular interaction between miR-21 and TGFBR2 [21, 22]. The hsa-miR-21-3p was known as bipolar disorder (BP) dominant miRNA by verifying only increase of miR-21-3p in BP on fibroblast culture [23]. The miR-21-3p also upregulated expression in hearts of lipopolysaccharide-treated mice [24]. Due to down regulation of SH3 domain-containing protein 2 (SORBS2) is one of target genes of miR-21-3p and putative target of SORBS2 controls septic infection-associated cardiac dysfunction [24].
In the present study, the evolutionary conservation patterns of miR-21-3p in various species and miR-21-3p target genes were analyzed using bioinformatic tools. Also, expression patterns of miR-21-3p were analyzed in various tissues of olive flounder in relation to the target PPIL2 gene using qRT-PCR.
Total RNA was extracted from ten tissues of olive flounder (spleen, gill, muscle, kidney, intestine, stomach, liver, fin, brain, and testis) using TRIzol reagent (Invitrogen, Carlsbad, CA, USA) depending on the manufacturerŌĆÖs instructions. These RNAs were treated with RNase-Free DNase I (New England Biolabs, Beverly, MA, USA) to remove genomic DNA contamination. RNAs were separated by 1% agarose gel electrophoresis for analysis of the 28S and 18S RNA bands. The RNA concentration was quantified to 500 ng using a ND-1000 UV-Vis spectrophotometer (Nano Drop, Wilmington, DE, USA). ReverTra Ace qPCR RT Master Mix kit (TOYOBO, Osaka, Japan) was used for cDNA synthesis. Prior to use, a 1 in 50 volume of gDNA remover was added to 4├Ś DN Master Mix and then each quantitated 500 ng RNA samples 6 ╬╝L denatured at 65Ōäā for 5 min. Then, 2 ╬╝L of 4├Ś DN Master Mix was added to RNA in order to increase DNase I reaction and incubated at 37Ōäā for 5 min. After that, 2 ╬╝L of 5├Ś RT Master Mix was added to 4├Ś DN Master Mix. Reverse transcription response was performed by following steps; incubation at 37Ōäā for 15 min, 50Ōäā for 5 min, heating 98Ōäā for 5 min and stored the solutions at ŌĆÆ20Ōäā.
Quantified RNA samples were used for miR-21-3p expression and its target gene; HOXC9 3┬┤ UTR expression analysis. HB miR Multi Assay Kit System I (Heim Biotek, Seongnam, Korea) was used to miRNA analysis that miR-21-3p reverse transcription (RT) and real-time PCR. First, 500 ng RNA reaction volume per each tissue need to 11 ╬╝L containing RNase free water. Then for synthesis of cDNAŌĆöHB_I RT Reaction Kit and its reagents was used in compliance with manufacturerŌĆÖs instructions and reverse transcription polymerase chain reaction (RT-PCR) amplification was performed in a thermal cycler (Eppendorf, Hamburg, Germany) on terms of 37Ōäā for 60 min followed by incubation at 95Ōäā for 5 min for one cycle and then held at 4Ōäā. Synthesized cDNA samples in various tissues olive flounder were stored at ŌĆÆ20Ōäā. Second, HB_I Real-time PCR Master Mix Kit from the HB miR Multi Assay Kit System I was followed by manufacturerŌĆÖs protocols. All cDNA samples were amplified in triplicate to ensure reproducibility with a Rotor-Gene Q system (Qiagen, Hilden, Germany). Real-time PCR was initial denaturation for 15 min at 95Ōäā, 45 thermal cycles of 95Ōäā for 10 s and 60Ōäā for 40 s and standard melting conditions of ramp ranging from 55Ōäā to 99Ōäā with 1Ōäā rise on each step. As a standard control, miRNA U6 was used as reference. Relative expression ratio of the target miR-21-3p (5ŌĆÖ-CGACAACAGUCUGAAGGCUGUC-3ŌĆÖ) to miRNA U6 were analyzed the comparative threshold method (2-╬ö╬ö Ct).
In case of target gene expression analysis, 7 ╬╝L of ddH2O, 10 ╬╝L of QuantiTect SYBR Green PCR Master Mix (Qiagen, Valencia, CA, USA), 1 ╬╝L of each forward (5┬┤-TCGTGCA-TCTACCTCGACAG-3┬┤) and reverse (5┬┤-CCTCCTCCT-CCTTGGTTTTC-3┬┤) primers and 1 ╬╝L of cDNA template. Real-time RT-PCR amplification for target gene and housekeeping gene were carried out 45 cycles of 94Ōäā for 10 s, 60Ōäā for 15 s, and 72Ōäā for 15 s. Melting curve was progressed for 30 s at 55ŌĆÆ99Ōäā. All samples were amplified in triplicate and housekeeping gene was used universal glyceraldehyde 3-phosphate dehydrogenase (GAPDH) of sense primer (5┬┤-GAAATCCCATCACCATCTTCCAGG-3┬┤) and antisense primer (5┬┤-GAGCCCCAGCCTTCTCCATG-3┬┤). For statistical analysis, the expression data were measured as the mean ┬▒ standard deviation. Significant differences among various tissue samples were determined by the unpaired StudentŌĆÖs t test. The value of p ’╝£ 0.05 was accepted as an indication of statistical significance. Differences less than p ’╝£ 0.05 were considered.
To identify miR-21-3p mature sequences in various vertebrate species, miRBase v19.0 (http://www.mirbase.org) was used to analyze. The miR-21-3p structure identification was performed by the mfold Web Server (http://mfold.albany.edu). The evolutionary conservation pattern of various species was examined by Evolutionary Conservation of Genomes (ECR browser; https://ecrbrowser.dcode.org/) in zebrafish, fugu, Tetraodon, chicken, opossum, rat, mouse, cow, dog, and chimpanzee.
The search of target genes was performed by miRTarBase release ver. 6.0 (http://mirtarbase.mbc.nctu.edu.tw) and TargetScanHuman ver. 7.1 program (http://www.targetscan.org). Target genes were predicted and their interaction between human target genes and miR-21-3p was done by RNA hybrid ver. 2.1 program (http://bibiserv2.cebitec.uni-bielefeld.de/rnahybrid). Minimum free energy (MFE) score by binding affinity of miRNA and their target genes were also obtained in RNA hybrid program. TargetScan-Human program was used to verify binding regions of the miRNAs and their target gene 3┬┤ UTR region. This program carries out whether target gene 3┬┤ UTR sequences in several vertebrates. The mature miR-21-3p sequences were acquired from miRBase program matched with aligned 3┬┤ UTR domain. Target genes of Gene Ontology (GO) for miR-21-3p was conducted through PANTHER (Protein Analysis Through Evolutionary Relationships) classification system (http://www.pantherdb.org/), which is related to the three functional categories: molecular function (MF), biological process (BP), and cellular component (CC).
The interaction of target gene and its related genes was analyzed gene-gene interaction (GGI) by using Gene MANIA database (http://genemania.org/). In addition, to identify target protein, associated other proteins, STRING (Search Tool for the Retrieval of Interacting Genes/Proteins) ver. 10.5 program for functional protein association network (https://string-db.org/) was used and commonly referred as protein-protein interaction (PPI). STRING database informed a degree of target and related protein similarity, as well as co-occurrence analysis among various species.
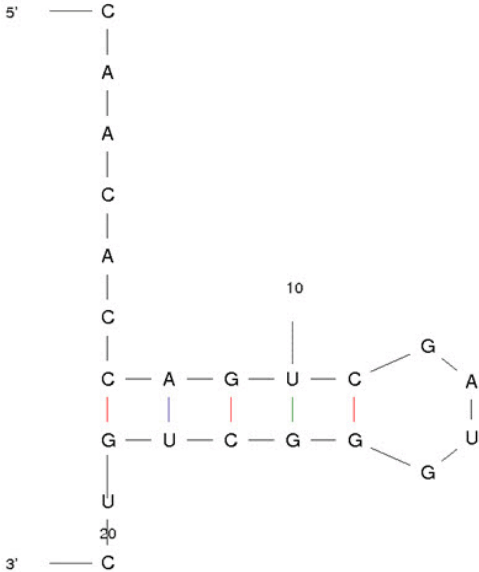
The conserved mature sequences of miR-21-3p in various species were analyzed by miRbase program. The 5┬┤-CAGUCG-3┬┤ sequences were highly conserved and indicated by shaded rectangles and marked with asterisk (Fig. 1). Using the ECR browser, evolutionary conservation of miR-21-3p was examined, indicating that miR-21-3p has been highly conserved from fishes to primates (Fig. 2). The structure of miR-21-3p was examined by mfold web server. The MFE value of miR-21-3p is ŌĆÆ6.00 kcal/mol (Fig. 3).
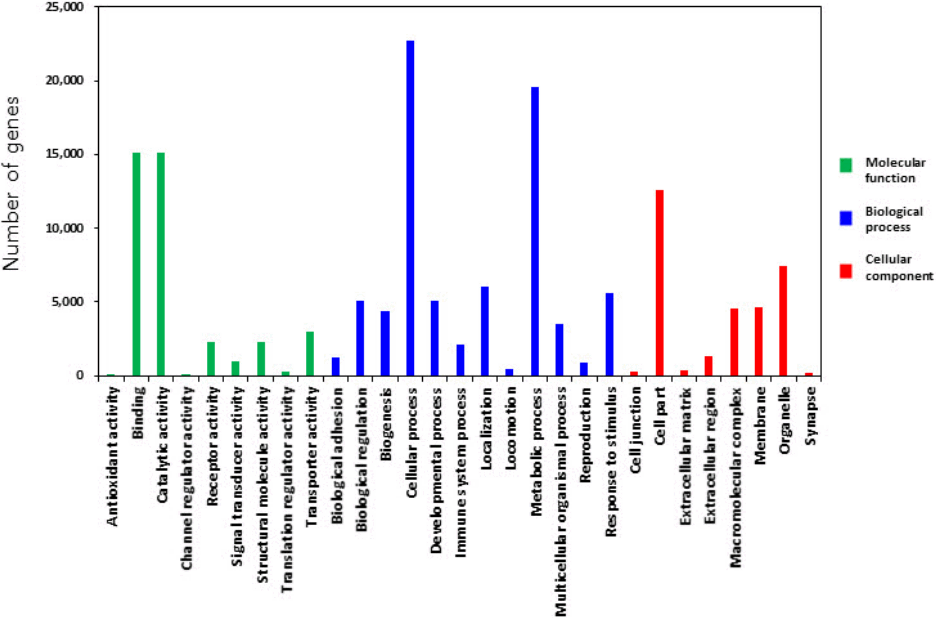
All target genes were analyzed using GO by PANTHER Gene List Analysis system. One of the three categories BP associated to cellular process and metabolic process functions. MF and CC revealed that multiple genes were related to binding activity, catalytic activity, cell part, and organelle component, respectively (Fig. 4). Binding sites (5┬┤-CGACUG-3┬┤) of target genes for the miR-21-3p were analyzed by Targetscan program, which mainly appeared in species-specific genes (Table 1). MFE score from hybridization of seed region and binding site was almost less than ŌĆÆ15 kcal/mol. The binding affinity between miRNA and 3ŌĆÖ UTR region of target genes seem to be strong in brown bat (KANK2), cat (SNAPC3), elephant (HN1), lizard (AIFM1), opossum (RELA), and rabbit (PPIL2) species as the average value of MFE was below ŌĆÆ25 kcal/mol. Target genes generate stem-loop complexes with their respective miRNA at the seed region of miR-21-3p and the binding site of target gene (Fig. 5).
PPIL2 is one of the target genes that have the highest MFE level and it was chosen to study the interaction with miR-21-3p due to its ŌĆÆ30.3 kcal/mol for MFE score. GGI network was used to identify functional roles of target genes, where several genes such as PPM1F, DGCR2, ASCC2, LZTR1, and MVD were found to be co-expressed with PPIL2. The physical interaction function was associated with PRCC, PIM2, BSG, ZNF830, CRNKL1, and KANSL2. CWF19L1, a member of the CWF19 protein family, which controls the cell cycle was predicted to have a correlation with PPIL2. PPIL3, MED15, and DGCR14 showed co-localization ability each other (Fig. 6A). To confirm previous data, PPI network was examined by STRING database, and numerous proteins involved with PPIL2 (Fig. 6B). To understand in Fig. 6B, each circle of proteins means structure decision status, where large sized circles indicate prediction of protein structure. Most proteins that were expected to have a correlation with PPIL2 co-expression were experimentally determined. Also, PPIL2 showed gene neighborhood relationship except PRCC, PRPF19, SNW1, XAB2, and BVD31. Although most of proteinsŌĆÖ function has not been yet identified, TOP2A and TOP2B were known as DNA topoisomerase 2, controlling of topological states of DNA by transient breakage and subsequent rejoining of DNA strands. Proteins related to PPIL2 showed occurrence profile that have two features: similarity scale and clade coverage. The similarity scale in these presence/absence profile could predict protein interaction. Clade coverage means genome group were separated in the phylogenetic tree and two distinct colors indicate that the lowest and highest similarity observed within the clade. Most of proteins were conserved especially in primates compared with other populations (Fig. 7).
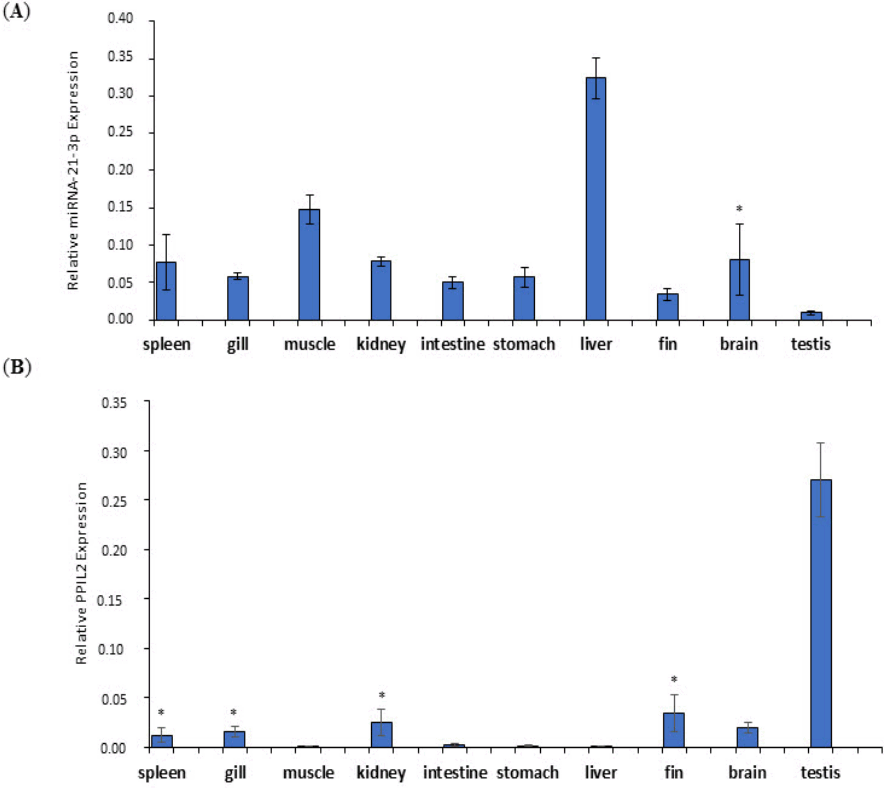
To evaluate the relevance of the expression levels of miR-21-3p and PPIL2, the expression patterns were examined in various olive flounder tissues including spleen, gill, muscle, kidney, intestine, stomach, liver, fin, brain, and testis. The expression pattern of miR-21-3p in multiple tissues was determined by quantitative real-time RT-PCR with miRNA U6 as a reference. The results displayed that miR-21-3p was up-regulated in most of tissues, except for testis. The expression level of miR-21-3p was highest in liver, followed by muscle. Testis expression level was relatively lower than other tissues except liver and muscle tissues (Fig. 8A).
The expression degree for PPIL2 in the numerous tissues were compared with the GAPDH as reference gene. Overall, most of the tissues were down-regulated compared with expression of miR-21-3p. Especially, testis showed the highest expression level of PPIL2 but PPIL2 was hardly expressed in the muscle, intestine, stomach, and liver (Fig. 8B). To sum up, the expression levels of miR-21-3p and PPIL2 mRNA were conversely related to most of tissues.
The seed region usually has six nucleotides which affects the most important elements for recognizing and combining 3┬┤ UTR regions [25]. To observe the relationship of evolutionary conservation about these miRNAs, we analyzed those sequences using ECR browser system and genomic approach, indicating that seed region was highly conserved from fish to primates (Figs. 1 and 2). These data allow us to understanding miRNA functional research among those species [26]. In the previously study, miR-21-3p sequence (5┬┤-CAACACCAGUCGAUGGGCUGU-3┬┤) was predicted seed region as 5┬┤-AACACCA-3┬┤ and matched with 7mer of target mRNA 3┬┤ UTR region. Also, miR-21-3p has the potential target gene, FZD4 and it is positively correlated to synergetic reaction about target mRNA silencing activity [27]. In the present study, we found seed region as 6mer 5┬┤-CAGUCG-3┬┤ via miRbase and evolutionary conservation related programs. Then, the sequences were confirmed by using mfold web server (Fig. 3). All target mRNAs of the miR-21-3p by PANTHER program allow us to understand their biological functions. Therefore, we examined GO analysis, showing that most of the target mRNAs seem to be associated with cellular process, cellular metabolic process, catalytic/binding activity, and cell part component (Fig. 4). In the previous study, GO enrichment in the genes noted serious enhancement for target mRNAs. These targets were related to the defense response, inflammatory response, and immunological reactions, which the result revealed nuclear factor-kB signaling pathway by using Kyoto Encyclopedia of Genes and Genomes (KEGG) pathway program [28]. Also, the possible regulatory pathways for the miR-21-3p at major target genes were analyzed by KEGG terms. GO categories were related to metabolic process, cell growth, cell cycle process, cell division, and signal transmission [29]. In order to understand the relationship between target gene and miRNAs, target genes were predicted from miRNA target prediction programs [30] and then selected 3┬┤ UTR of the genes which have binding site to seed region of miR-21-3p (Table 1). Since one miRNA can regulate different target genes [25], miR-21-3p can target diverse genes in various species. Among various categories from Table 1, this study focused on MFE score that indicates the degree of affinity between miRNA and its 3┬┤ UTR target region. Within the genes with high MFE score, six genes were selected KANK2, SNAPC3, HN1, AIFM1, RELA, and PPIL2. These candidates for the target gene of miR-21-3p were indicated by multiple bioinformatic analysis. Of these, six target genes were selected and the hybridization between 3┬┤ UTR of the target genes and the seed region of miR-21-3p was demonstrated using the RNA hybrid tool (Fig. 5). One of the highest MFE scores was PPIL2, peptidylprolyl isomerase-like 2 acts as a chaperone with putative ubiquitin ligase activity [31, 32]. Until now, there have been few studies about the function of miR-21-3p, but there are several studies about PPIL2 functions in other fields. PPIL2 related target genes are preserved in primates such as gorilla and gibbon (Fig. 7). Likewise, PRCC encodes proline-rich protein PRCCŌĆÆPPIL2 complex, which acts as protein folding, transport and degradation in the brain of AlzheimerŌĆÖs disease patients in previous study [33]. Other studies have also shown that PPIL2 interacts with intronic-miRNAs such as miR-130b in host genomes [34, 35].
Quantitative expression pattern for the miR-21-3p and PPIL2 genes was examined in various olive flounder tissues in the present study. The miR-21-3p expression level was up-expressed except for testis tissue as shown in Fig. 8A. The expression of miR-21-3p in liver of olive flounder significantly increased compared to the other tissues. This result was previously reported up-regulation for liver tissue of Japanese flounder in miR-17 that involved in Japanese flounder metamorphic developmental stages [16]. As PPIL2 was found to be a target gene of miR-21-3p, this study performed qRT-PCR to confirm the expression patterns of various tissues in olive flounder. The expression levels of PPIL2 gene was highest in the testis, followed by the fin, kidney and brain. This result proposed that PPIL2 has an enzyme activity for peptidyl prolyl isomerase (PPIases), related to function of posttranslational modification that accumulate the isomerization of peptidyl prolyl bonds in peptides and proteins [36]. PPIases can be classified into three families; cyclophilin, FKBP, and parvulins. Among these families, Pin1 belongs to the parvulin family that regulates the function of phosphorylated protein like the cell cycle regulatory molecules [37]. These three families of PPIases activity was up-expressed in wild-type mice testis lysate both mRNA and protein levels [38]. Taken together, our data indicated that PPIL2 gene expression showed complementary results with those of miR-21-3p expression in various tissues of olive flounder.
In summary, genomic and bioinformatics analyses of miR-21-3p allow us to speculate the biological function in relation to the target genes of the miR-21-3p in olive flounder. In various target genes, 3┬┤ UTR region of PPIL2 gene showed the highest binding affinity with miR-21-3p based on the MFE value. Therefore, we examined the expression pattern in both miR-21-3p and PPIL2 gene, indicating that the miR-21-3p seems to repress the expression of PPIL2 gene. Our bioinformatics data could be of great use as further studies in relation to the biological roles of miR-21-3p in various species.
Acknowledgments
This research was provided for a grant the Marine Biotechnology Program (PJT200620, Genome Analysis of Marine Organisms and Development of Functional Application) funded by the Ministry of Oceans and Fisheries, Korea.
Fig.┬Ā1.
Comparative analysis of miR- 21-3p in various species. The 5ŌĆÖ-CAGUCG-3ŌĆÖ sequences were highly conserved. It was indicated by shaded rectangle and marked as asterisk.

Fig.┬Ā5.
(AŌĆōF) The hybridization analyses between miR-21-3p and 3┬┤ untranslated region (3┬┤ UTR) of target genes. They show high level minimum free energy (MFE) score. Seed regions of miR-21-3p and binding sites of 3ŌĆÖ UTR region are indicated by shaded rectangles.
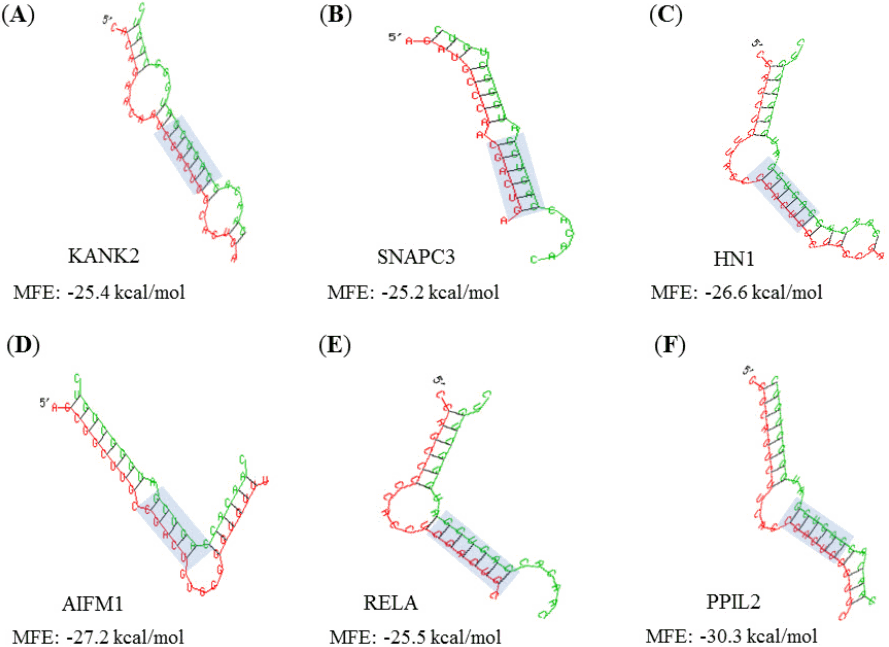
Fig.┬Ā6.
Gene-gene interaction by Gene MANIA (A) and protein-protein interaction by STRING program (B) for the target gene (PPIL2) of the miR-21-3p.

Fig.┬Ā7.
Phylogenetic relationship among PPIL2 gene family in various species by co-occurrence program.
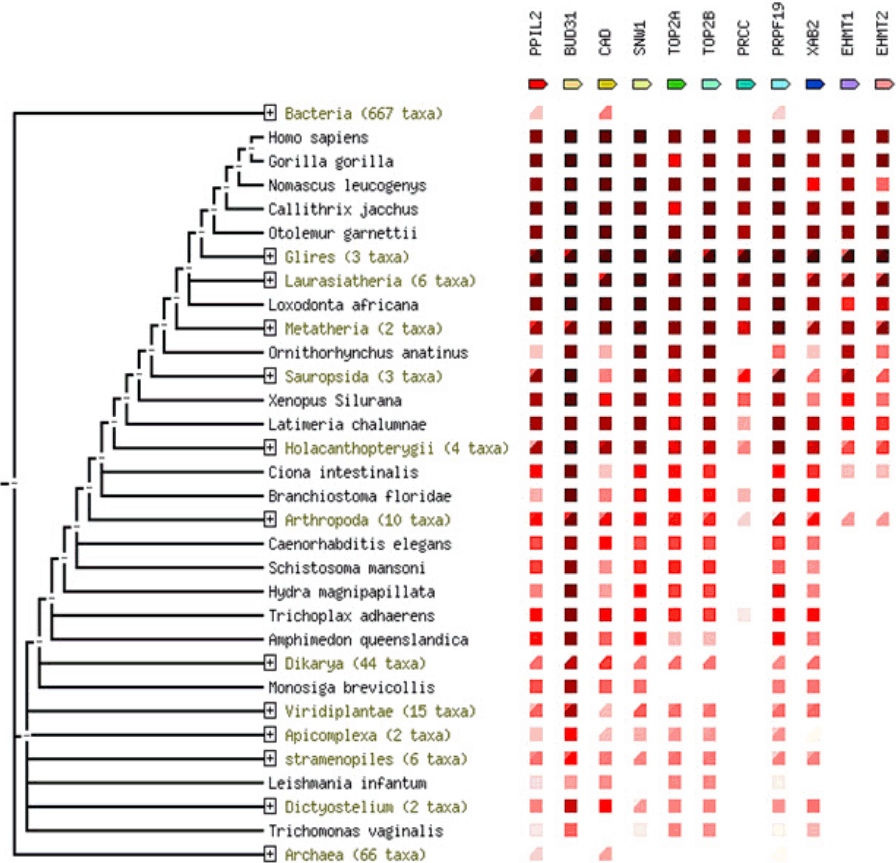
Fig.┬Ā8.
Relative expression patterns of miR-21-3p (A) and PPIL2 (B) in various tissues of olive flounder. Data are normalized to U6 and glyceraldehyde 3-phosphate dehydrogenase in miR-21-3p and PPIL2, respectively. This results are presented as mean ┬▒ standard deviation. A paired t-test was indicated to gain p-values and to check statistically important differences in expression levels of miR- 21-3p and PPIL2 (*p Ōēź 0.15).
Table┬Ā1.
Target genes and their binding site for the miR-21-3p examined by Targetscan and minimum free energy (MFE) value
References
1. Mui├▒os-Gimeno M, Guidi M, Kagerbauer B, Mart├Łn-Santos R, Navin├®s R, Alonso P, et al. Allele variants in functional MicroRNA target sites of the neurotrophin-3 receptor gene (NTRK3) as susceptibility factors for anxiety disorders. Hum Mutat 2009;30:1062ŌĆō1071.


2. Yang P, Tang R, Zhu J, Zou L, Wu R, Zhou H, et al. A functional variant at miR-24 binding site in B7-H2 alters susceptibility to gastric cancer in a Chinese Han population. Mol Immunol 2013;56:98ŌĆō103.


3. Minguzzi S, Selcuklu SD, Spillane C, Parle-McDermott A. An NTD-associated polymorphism in the 3' UTR of MTHFD1L can affect disease risk by altering miRNA binding. Hum Mutat 2014;35:96ŌĆō104.


4. Maxwell EK, Campbell JD, Spira A, Baxevanis AD. SubmiRine: assessing variants in microRNA targets using clinical genomic data sets. Nucleic Acids Res 2015;43:3886ŌĆō3898.


5. OŌĆÖCarroll D, Schaefer A. General principals of miRNA biogenesis and regulation in the brain. Neuropsychopharmacology 2013;38:39ŌĆō54.


6. Lee SY, Choi JE, Jeon HS, Hong MJ, Choi YY, Kang HG, et al. A genetic variation in microRNA target site of KRT81 gene is associated with survival in early-stage non-small-cell lung cancer. Ann Oncol 2015;26:1142ŌĆō1148.


7. Schoof CR, Botelho EL, Izzotti A, Vasques Ldos R. MicroRNAs in cancer treatment and prognosis. Am J Cancer Res 2012;2:414ŌĆō433.


8. Gawantka V, Pollet N, Delius H, Vingron M, Pfister R, Nitsch R, et al. Gene expression screening in Xenopus identifies molecular pathways, predicts gene function and provides a global view of embryonic patterning. Mech Dev 1998;77:95ŌĆō141.


9. Han HJ, Kim DH, Lee DC, Kim SM, Park SI. Pathogenicity of Edwardsiella tarda to olive flounder, Paralichthys olivaceus (Temminck & Schlegel). J Fish Dis 2006;29:601ŌĆō609.


10. Wang HR, Hu YH, Zhang WW, Sun L. Construction of an attenuated Pseudomonas fluorescens strain and evaluation of its potential as a cross-protective vaccine. Vaccine 2009;27:4047ŌĆō4055.


11. Nho SW, Shin GW, Park SB, Jang HB, Cha IS, Ha MA, et al. Phenotypic characteristics of Streptococcus iniae and Streptococcus parauberis isolated from olive flounder (Paralichthys olivaceus). FEMS Microbiol Lett 2009;293:20ŌĆō27.


12. Dunham RA. Aquaculture and Fisheries Biotechnology: Genetic Approaches. Wallingford: CABI Publishing, 2004.
13. Kim WJ, Kim KK, Han HS, Nam BH, Kim YO, Kong HJ, et al. Population structure of the olive flounder (Paralichthys olivaceus) in Korea inferred from microsatellite marker analysis. J Fish Biol 2010;76:1958ŌĆō1971.


14. Slatkin M. Gene flow and the geographic structure of natural populations. Science 1987;236:787ŌĆō792.


16. Zhang H, Fu Y, Shi Z, Su Y, Zhang J. miR-17 is involved in Japanese Flounder (Paralichthys olivaceus) development by targeting the Cdc42 mRNA. Comp Biochem Physiol B Biochem Mol Biol 2016;191:163ŌĆō170.


17. Fu Y, Shi Z, Wang G, Zhang J, Li W, Jia L. Expression of let-7 microRNAs that are involved in Japanese flounder (Paralichthys olivaceus) metamorphosis. Comp Biochem Physiol B Biochem Mol Biol 2013;165:106ŌĆō113.


18. Petrocca F, Visone R, Onelli MR, Shah MH, Nicoloso MS, de Martino I, et al. E2F1-regulated microRNAs impair TGF╬▓-dependent cell-cycle arrest and apoptosis in gastric cancer. Cancer Cell 2008;13:272ŌĆō286.


19. Volinia S, Calin GA, Liu CG, Ambs S, Cimmino A, Petrocca F, et al. A microRNA expression signature of human solid tumors defines cancer gene targets. Proc Natl Acad Sci U S A 2006;103:2257ŌĆō2261.


20. Zhang L, Volinia S, Bonome T, Calin GA, Greshock J, Yang N, et al. Genomic and epigenetic alterations deregulate micro-RNA expression in human epithelial ovarian cancer. Proc Natl Acad Sci U S A 2008;105:7004ŌĆō7009.


21. Mascellani N, Tagliavini L, Gamberoni G, Rossi S, Marchesini J, Taccioli C, et al. Using miRNA expression data for the study of human cancer. Minerva Biotechnol 2008;20:23ŌĆō30.
22. Rath SN, Das D, Konkimalla VB, Pradhan SK. In silico study of miRNA based gene regulation, involved in solid cancer, by the assistance of argonaute protein. Genomics Inform 2016;14:112ŌĆō124.


23. Maffioletti E, Cattaneo A, Rosso G, Maina G, Maj C, Gennarelli M, et al. Peripheral whole blood microRNA alterations in major depression and bipolar disorder. J Affect Disord 2016;200:250ŌĆō258.


24. Jo A, Im J, Lee HE, Jang D, Nam GH, Mishra A, et al. Evolutionary conservation and expression of miR-10a-3p in olive flounder and rock bream. Gene 2017;628:16ŌĆō23.


25. Wang H, Bei Y, Shen S, Huang P, Shi J, Zhang J, et al. miR-21-3p controls sepsis-associated cardiac dysfunction via regulating SORBS2. J Mol Cell Cardiol 2016;94:43ŌĆō53.


26. Kiriakidou M, Nelson PT, Kouranov A, Fitziev P, Bouyioukos C, Mourelatos Z, et al. A combined computational-experimental approach predicts human microRNA targets. Genes Dev 2004;18:1165ŌĆō1178.


27. Cybula M, Wieteska ┼ü, J├│zefowicz-Korczy┼äska M, Karbownik MS, Grzelczyk WL, Szemraj J. New miRNA expression abnormalities in laryngeal squamous cell carcinoma. Cancer Biomark 2016;16:559ŌĆō568.


28. Romay MC, Che N, Becker SN, Pouldar D, Hagopian R, Xiao X, et al. Regulation of NF-╬║B signaling by oxidized glycerophospholipid and IL-1╬▓ induced miRs-21-3p and -27a-5p in human aortic endothelial cells. J Lipid Res 2015;56:38ŌĆō50.


29. Zhou XH, Ren YM, Wei ZJ, Lin W, Fan BY, Liu S, et al. Differential expression of miRNAs in OsborneŌĆÖs ligament of cubital tunnel syndrome. Mol Med Rep 2017;16:687ŌĆō695.


30. Lewis BP, Shih IH, Jones-Rhoades MW, Bartel DP, Burge CB. Prediction of mammalian microRNA targets. Cell 2003;115:787ŌĆō798.


31. Hatakeyama S, Yada M, Matsumoto M, Ishida N, Nakayama KI. U box proteins as a new family of ubiquitin-protein ligases. J Biol Chem 2001;276:33111ŌĆō33120.


32. Pushkarsky T, Yurchenko V, Vanpouille C, Brichacek B, Vaisman I, Hatakeyama S, et al. Cell surface expression of CD147/EMMPRIN is regulated by cyclophilin 60. J Biol Chem 2005;280:27866ŌĆō27871.


33. Belfiori-Carrasco LF, Marcora MS, Bocai NI, Ceriani MF, Morelli L, Casta├▒o EM. A novel genetic screen identifies modifiers of age-dependent amyloid beta toxicity in the Drosophila brain. Front Aging Neurosci 2017;9:61.


34. Radfar MH, Wong W, Morris Q. Computational prediction of intronic microRNA targets using host gene expression reveals novel regulatory mechanisms. PLoS One 2011;6:e19312.


35. Chang YY, Kuo WH, Hung JH, Lee CY, Lee YH, Chang YC, et al. Deregulated microRNAs in triple-negative breast cancer revealed by deep sequencing. Mol Cancer 2015;14:36.


36. Yaffe MB, Schutkowski M, Shen M, Zhou XZ, Stukenberg PT, Rahfeld JU, et al. Sequence-specific and phosphorylation-dependent proline isomerization: a potential mitotic regulatory mechanism. Science 1997;278:1957ŌĆō1960.


- TOOLS
-
METRICS

-
- 5 Crossref
- 0 Scopus
- 8,866 View
- 172 Download
- Related articles in GNI
-
Comparative Analysis of Predicted Gene Expression among Crenarchaeal Genomes2017 March;15(1)


