Introduction
Gene set analysis (GSA) is useful in understanding the biological mechanisms underneath a phenotype by assessing the overall evidence of association of variations in an entire set of genes with a disease or a quantitative trait. GSA has recently been used to investigate many common diseases as an approach for the secondary analysis of a genome-wide association study (GWAS) result [1-3]. Currently, several software tools for GSA are available: GSA-SNP [4], i-GSEA4GWAS [5], GSEA-SNP [6], GeSBAP [7], and so on.
GSA-SNP is useful only when p-values of the single nucleotide polymorphism (SNP) markers are available. While GSA-SNP has implemented several options for estimating the significance of a gene set, its implementation of Z-statistics may be the most convenient. Other methods require permuted p-values that are obtained from sample permutation trials; this requires lengthy computation runs. The Z-statistics method accepts only one set of unpermuted original p-values and compares the score of a gene set against the background distribution made by all the genes; these p-values should be readily available for a typical GWAS. Similarly, i-GSEA4GWAS also uses only the original set of p-values and thus is as convenient as GSA-SNP. Instead of sample permutation, it estimates the significance of a gene set via SNP permutation [8]. One of its unique features is a scaling step that emphasizes the gene sets that are enriched with strongly associated genes.
Often, these approaches give different results in terms of the number of gene set hits. Hence, we compared these two methods using the same dataset while controlling the input parameters as much as possible. Here, we reanalyzed the type 2 diabetes mellitus (T2DM) GWAS results for the Korean population against the Gene Ontology (GO) and Kyoto Encyclopedia of Genes and Genomes (KEGG) pathway databases. The GWAS has been done with both the original unimputed and imputed genotypes. A large discrepancy in the number of significant gene set hits was observed between the two programs as well as the gene set databases. We also observed that the results were strongly affected by imputation.
Methods
Genotyping, imputation, and GWAS
Korean samples used in the East Asian T2DM meta-analysis have been described by Cho et al. [9]. The samples included 1,042 cases with T2DM and 2,943 controls from the Korea Association Resource (KARE) project that were recruited from Ansan and Ansung population-based cohorts, aged 40 to 69. We used the p-values of both the original unimputed (259,188 SNPs) and imputed (1,152,947 SNPs) genotypes, based on Affymetrix Genome-Wide Human SNP array 5.0 (Affymetrix, Santa Clara, CA, USA), that were made by removing samples and markers that failed a quality control test [10]. SNP imputation has been described by Cho et al. [9]. Briefly, IMPUTE, MACH, and BEAGLE were used, together with haplotype reference panels from the Japanese (JPT) and Han Chinese (CHB) samples that are available in the HapMap database on the basis of HapMap build 36.
GSA-SNP and i-GSEA4GWAS
The GO database was downloaded from the Gene Ontology Consortium (12,902 terms) [11], and the KEGG pathway database was downloaded from the KEGG (311 terms) [12].
For both databases, only the gene sets having 10-200 member genes were used (3534 GO and 211 KEGG terms). For both GSA-SNP and i-GSEA4GWAS, 20-kb padding was added to both ends of each gene. Usually, these methods, like i-GSEA4GWAS, pick up the best p-value and assign it to the encompassing gene. On the contrary, GSA-SNP allows one to choose different schemes for assigning the SNP p-values to each gene: either the best or the second best p-value within the gene boundary. Choosing the second best p-value has been recommended, as it may reduce the false positive associations with little loss of sensitivity [4].
For GSA-SNP, we downloaded the standalone program (as of Jan. 2011) and executed it locally. For i-GSEA4GWAS, we used the web server version by uploading the SNP p-values. GSA-SNP allows several approaches of evaluating gene set significance. While other approaches require p-values from permutation tests, Z-standardization requires no permuted p-values. The score of a gene is defined as -log of the p-value assigned to the gene. For each gene set, the scores of its member genes are averaged, and the Z-statistics of these scores are used to estimate the significance under the assumption of a normal distribution. The effect of multiple testing is corrected by the false discovery rate (FDR) method [13]. On the other hand, i-GSEA4GWAS compares the distribution of the member gene scores of a gene set to all the genes using K-S statistics and corrects the multiple testing effect using FDR that is based on SNP permutation tests. Variation in the number of member genes among gene sets is taken care of by multiplying a ratio of 'highly significant' genes in a gene set relative to those among all genes. Here, the 'highly significant' genes are defined as the genes that map with at least one of the top 5% of all SNPs in the dataset.
Results
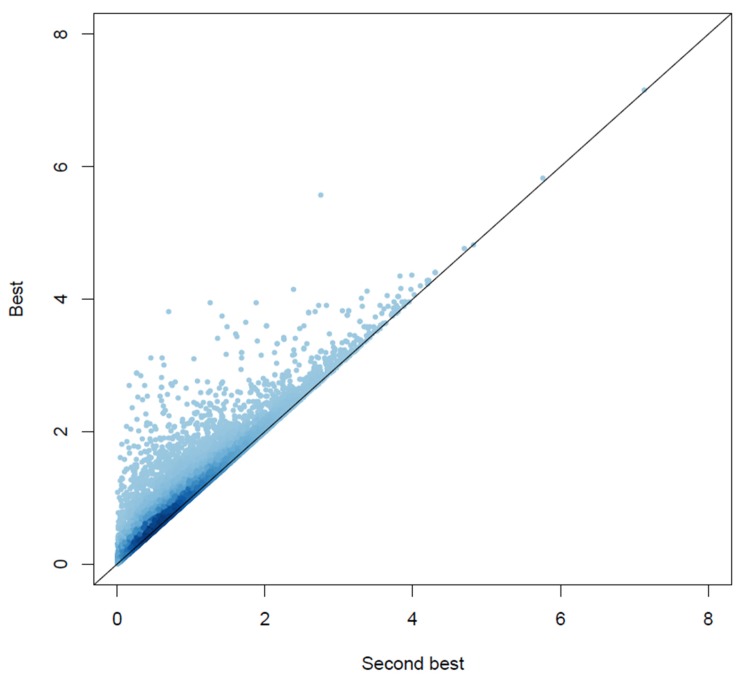
The performance of GSA-SNP and i-GSEA4GWAS looked quite different in terms of the number of hits (Table 1). GSA-SNP detected 27-94 hits for either the imputed or unimputed genotype dataset with GO gene sets, while 9-20 hits were detected with KEGG gene sets. Consistently, more gene sets were hit with the scheme of using the second-best p-value of a gene than the best one. Previously, it has been recommended that one assign the second-best, not the best, p-value to a gene due to a concern that the use of the best p-values of a gene may produce more false positives than the second-best one [4]. We compared the distribution of gene scores that were calculated based on the best and the second-best p-values using a high-volume scatter plot that represented the local density of points by a false color representation (Fig. 1). One may notice the densely populated points along the diagonal axis, meaning that the differences in gene scores were small for the majority of genes. Nevertheless, there were many genes off-diagonal; for these genes, the gene scores that were calculated with the best p-values were larger than those calculated with the second-best p-values. While this effect was negligible for the genes having high scores (p < 10-4), many genes having low scores displayed large differences. The latter were genes that had only one SNP within its boundary plus 20 kb of padding standing out in terms of significance and the rest falling short. If the best SNP of a gene had been located within a strong linkage disequilibrium (LD) block, the second-best SNP would have been chosen from this block with a p-value close to the best one. On the other hand, if the best SNP is in weak LD with the second-best one, they would differ from each other considerably. Considering that Fig. 1 was based on the highly densely imputed genotypes, those genes that showed a large difference may have been located within narrow LD blocks or recombination hot spots where imputation may be invalid. Indeed, the genes that were not located within haplotype blocks showed larger differences in gene scores than those located within haplotype blocks (Supplementary Fig. 1). For those genes located within haplotype blocks, there were inverse relationships between the block size and the difference in gene scores (Supplementary Fig. 2). It is also possible that the apparent associations seen with the best p-values may have been due to random errors; assigning the second-best p-value to a gene may then reduce false associations. One may argue that the large difference between the best and second-best scores for some genes may be due to the small number of SNPs for those genes. If this is the case, there should be an inverse relationship between these two quantities. As shown in Supplementary Fig. 3, there is no such evidence.
Here is the rationale for the more hits made by GSA-SNP with the use of the second-best p-values than the best p-values in assigning them to a gene. GSA-SNP assigns a score to a gene set by averaging gene scores (-logP) of its member genes and calculates Z-statistic by subtracting the mean of all gene scores from the gene set score. Assigning the second-best p-value to a gene produces lower gene scores than assigning the best one. While this effect is more pronounced with low-scoring genes, the high-scoring genes suffer little. Since the mean of all gene scores would also decrease by using the second-best p-values compared to the use of the best p-values, the resulting Z-statistic for a gene set that is composed of high-scoring genes would then increase, yielding more hits.
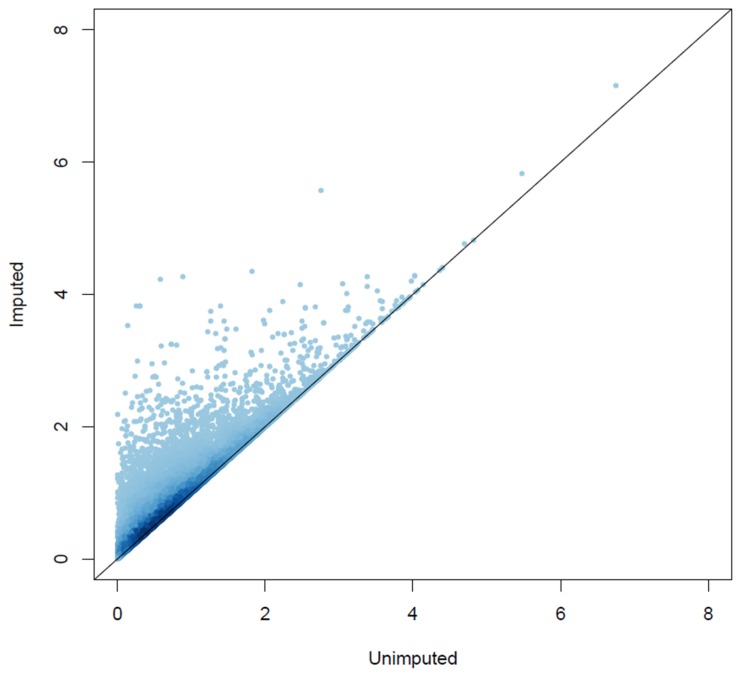
The GSA-SNP runs with p-values of the imputed genotypes consistently produced fewer hits than with those of the unimputed genotypes. Imputation guesses the genotype of an untyped marker and fills it in. The GWAS p-value of an imputed SNP can be either larger or smaller than those of the neighboring genotyped, unimputed ones. For the former cases, it would not change the best p-value that is assigned to a gene. On the other hand, for the latter cases, the best p-value that is assigned to a gene can get smaller. As shown in Fig. 2, the imputation increased the significance of many genes. This has the effect of reducing the number of hits for the GSA-SNP runs with the imputed dataset compared with the unimputed one, similar to the argument given above for the schemes of assigning the best or second-best p-values to a gene.
With the p-values of the imputed SNPs, i-GSEA4GWAS claimed 1,070 GO terms as significant, almost 40-fold more than GSA-SNP, which yielded only 27 terms. Even with the p-values of the original unimputed SNPs, i-GSEA4GWAS produced about 4.6 times more terms than GSA-SNP (283 vs. 61). It appears that i-GSEA4GWAS unrealistically produced too many hits (about 1/3 of the input GO terms), hampered by the high proportion of false positives. This trend was much more pronounced with GO than KEGG, probably due to the more redundant nature of GO than KEGG.
Unlike GSA-SNP, which reported fewer hits with the imputed dataset than the unimputed one, i-GSEA4GWAS produced about 5 times more hits with the former than the latter. Why did i-GSEA4GWAS perform even more poorly with the imputed dataset that should be more ideal in terms of marker density than the unimputed one? i-GSEA4GWAS assigns the best p-value to a gene and evaluates the gene set score by comparing the distribution of gene scores (-logP) of a gene set to that of all gene scores. The significance of the gene set score is estimated by the FDR, which compares the unpermuted distribution of the gene set scores with that of the gene set scores generated from a number of SNPpermuted datasets. The gene set score is multiplied by a factor, k/K, where k represents the proportion of so-called 'significant' genes within the gene set and K represents the proportion of 'significant' genes of all genes. i-GSEA4GWAS defines the 'significant' genes as those that are mapped with at least one 'top 5%' SNP. This step is a unique feature of i-GSEA4GWAS, which has the prefix 'i' in its name. Generally, an imputed dataset has much higher marker density than the corresponding unimputed one (4.45-fold difference in our case). The so-called 'top 5%' SNPs will be more with the imputed dataset than the unimputed one (again, a 4.45-fold difference in our case). This corresponded to p-value cutoff of 0.047 in our case. The number of so-called 'significant' genes does not increase as much as the increase in the marker density: from 2,967 genes for the unimputed dataset to 4,156 genes for the imputed one in our case. The concept of augmenting gene set scores by the proportion of 'significant' genes may be useful, as demonstrated previously in comparison with GSEA [5, 14]. However, the 'top 5%' threshold used by i-GSEA4GWAS may be too high, inflating the false positive rates. This inflation may be more pronounced with an imputed dataset - 1,000 more genes were treated as 'significant' with our imputed dataset than with the unimputed one. Probably, this is one of the main reasons for the particularly poor performance of i-GSEA4GWAS with the imputed dataset.
Discussion
GSA is useful method in interpreting the result from a GWAS. A systematic evaluation of its performance is of paramount interest to the GWAS community, as the method is getting popular. Here, we compared the performance of two such methods using the common datasets and gene set databases. While GSA-SNP behaved predictably, i-GSEA4GWAS produced too many hits for most of the test settings. For example, i-GSEA4GWAS reported 3.8- and 6.5-fold more hits, respectively, for GO and KEGG, with the imputed dataset than with the unimputed one. Imputation is such a useful practice that augments the power of a genotype dataset, and ideally, gene set analyses can benefit from it. Our study warns that one must be cautious in applying i-GSEA4GWAS to an imputed dataset. As we pinpointed above concerning the 'top 5%' threshold as the potential cause of the high hit rates of i-GSEA4GWAS, it would be interesting to re-evaluate its performance with lower thresholds. Currently, the threshold is not available for the users to change it. It would have been better if the user could choose it at will. For GSA-SNP, we recommend using an imputed dataset if at all possible. GSA-SNP allows the user to choose k in assigning the k-th best p-value to a gene. We recommend using k = 2 instead of k = 1, as the latter inflates the scores for some genes, diminishing the power of GSA.