Genomics Inform Search

CLOSE


Genomics Inform > Volume 10(1); 2012 > Article
Kim and Cha: Possibility of the Use of Public Microarray Database for Identifying Significant Genes Associated with Oral Squamous Cell Carcinoma

Abstract

There are lots of studies attempting to identify the expression changes in oral squamous cell carcinoma. Most studies include insufficient samples to apply statistical methods for detecting significant gene sets. This study combined two small microarray datasets from a public database and identified significant genes associated with the progress of oral squamous cell carcinoma. There were different expression scales between the two datasets, even though these datasets were generated under the same platforms - Affymetrix U133A gene chips. We discretized gene expressions of the two datasets by adjusting the differences between the datasets for detecting the more reliable information. From the combination of the two datasets, we detected 51 significant genes that were upregulated in oral squamous cell carcinoma. Most of them were published in previous studies as cancer-related genes. From these selected genes, significant genetic pathways associated with expression changes were identified. By combining several datasets from the public database, sufficient samples can be obtained for detecting reliable information. Most of the selected genes were known as cancer-related genes, including oral squamous cell carcinoma. Several unknown genes can be biologically evaluated in further studies.

Introduction

Despite recent advances in surgical, radiation, and chemotherapeutic treatment protocols, the prognosis of oral squamous cell carcinoma (OSCC) remains mournful, with an approximate 50% 5-year mortality rate from disease or associated complications [1]. Therefore, the identification of biological markers is essential to make progress in detecting malignancy at an early stage and developing novel therapies [2].
Microarray datasets that are created for the same research purposes in different laboratories have accumulated rapidly. The results from different datasets are often inconsistent due to the utilization of different platforms, sample preparations, or various technical variations. If we could combine such datasets by adjusting for systematic biases that exist among different datasets derived from different experimental conditions, the power of statistical tests would be improved by the increase in sample size [3].
In OSCC, although lots of microarray-based studies have been conducted to provide insights into gene expression changes, most of these studies have contained insufficient samples for detecting reliable information using statistical analysis [4, 5]. Therefore, this study attempted to combine several datasets in the public database for detecting significant genes.
We used two small microarray datasets of OSCC for this study, which were based on the same platform but had different expression scales. These two datasets were combined after discretization, because a previous study showed that classification could be improved using combined datasets after discretization [3]. After combining datasets, we used chi-square test for identifying the significant genes. Chi-square test has been used commonly to detect differentially expressed genes after discretization of expression intensities in the microarray experiment.
In this study, gene expression ratios of two datasets were transformed with their ranks for each dataset. Next, the transformed datasets were combined, and a nonparametric statistical method was applied to the combined dataset to detect informative genes. Finally, we showed that most of the selected genes were known to be involved in various cancers, including OSCC.

Methods

Dataset

Two microarray datasets were used for this study. We acquired these datasets from a public database (Gene Expression Omnibus, GEO). One was the expression dataset of 16 tumors and 4 normal tissues from 16 patients, using Affymetrix U133A gene chips (Affymetrix, Santa Clara, CA, USA). The other microarray dataset consisted of expression profiles of 22 tumors and 5 normal tissues. These two datasets were experimented on under the same platform, Affymetrix U133A. The datasets are summarized in Table 1.

Process for combining datasets

For combining datasets, gene expression ratios are rearranged in order of expression ratios by each gene in each dataset, and the ranks are matched with the corresponding experimental group. If the experimental groups are homogenous, the ranks within the same experimental group would be neighboring. The process of discretization of gene expressions is summarized in the following steps [3]:
  1. Rank the gene expression ratios within a gene for each dataset.

  2. List in order of the ranks, and assign the order of gene expressions to the corresponding experimental groups.

  3. Summarize the result of (2) in the form of a contingency table for each gene.

  4. Combine the contingency tables that have been summarized for each dataset.

When there are three datasets to be combined, the datasets can be added as a single entry, as shown in Table 2, after the transformation of each dataset by rank.

Identification of significant genes from a combined dataset

After the summarization of gene expression ratios in the form of a contingency table for each gene, as shown in Table 3, a nonparametric statistical method was applied to the datasets for independence testing between gene expression patterns and experimental groups. The test statistics are calculated as follows for each gene:
gni-10-23-e001.jpg
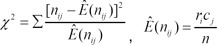
When the sample size is small - generally Ê(nij) less than 5 - Fisher's exact test is recommended rather than chi-square test.
The significant genes can be selected by an independence test between the phenotypes and gene expressions using this type of summarized dataset. ci and ri represent the marginal sums of the ith column and row, respectively. nij is the number of experiments belonging to Ei and Pj, and n represents the total number of experiments.

Results

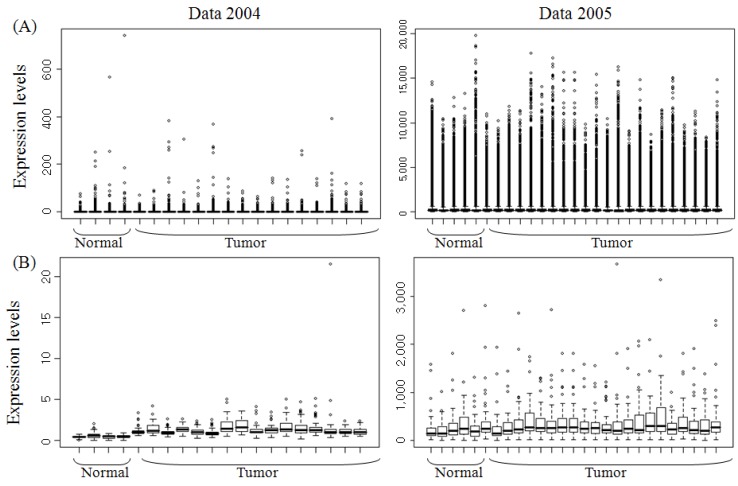
The clinical information and expression levels of two datasets are summarized in Table 4 and Fig. 1. Subgroup and sex were similarly distributed in the two datasets. The distributions of other factors were not included.
The scale of expression levels in the two datasets was different; the expression values of Data 2004 ranged from 0.01 to 740, and those of Data 2005 were from 0.1 to 19,773. The expression patterns of the two datasets can be explored in Fig. 1.
Lots of outliers are shown in Fig. 1A in the two datasets containing whole gene sets. However, in subsets of significant genes, the expression ranges got narrow, and the outliers were decreased (Fig. 1B). The expressions of tumor tissues in Data 2004 were upregulated and varied compared with normal tissues. If there was no outlier with a maximum value in the 14th tumor tissue in Data 2004, the expressions of the two different groups would be clearly distinguished. Any clear differences in expression were not shown between the two groups in Data 2005.

Upregulated 51 genes in oral squamous cell carcinoma

To identify differently expressed genes between normal and tumor tissues, we performed chi-square test using a combined microarray dataset. Fifty-one significant genes were selected from a combined dataset with p-value less than 0.005, which were upregulated in OSCC tissues. The significance level can be controlled, and more genes can be selected with a lower significance level. These selected genes are summarized in Table 5.
Many genes among the selected genes were known as cancer-related genes. STAT1 [6], SKP2 [7], IFI16 [8], RHEB [9], FIF44 [10], SOD2 [11, 12], and GREM1 [11] are related to OSCC. Table 6 [13-56] summarizes the previous studies that have published the relations of selected genes with cancer.

Expression pattern of the identified genes

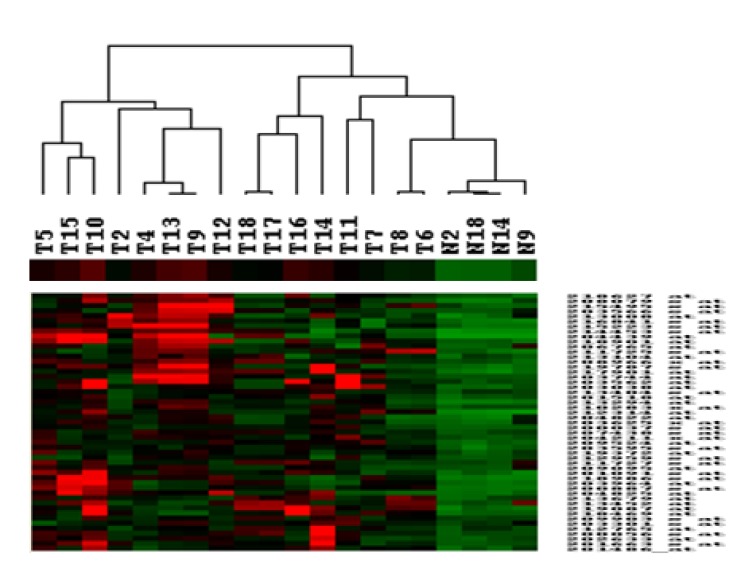
To investigate whether the different experimental groups could be classified with significant genes, an unsupervised hierarchical clustering method was applied to the significant gene set (Fig. 2).
The normal group consisted of 4 tissues and showed significantly lower expression levels when compared with the tumor group. In Fig. 2, we investigated the classification availability of the identified genes in Data 2004, not in a combined dataset, because the two datasets have different expression scales.

Network analysis

Based on all identified genes, new and expanded pathway maps and connections and specific gene-gene interactions were inferred, functionally analyzed, and used to build on the existing pathway using the Ingenuity Pathway Analysis (IPA) knowledge base [57].
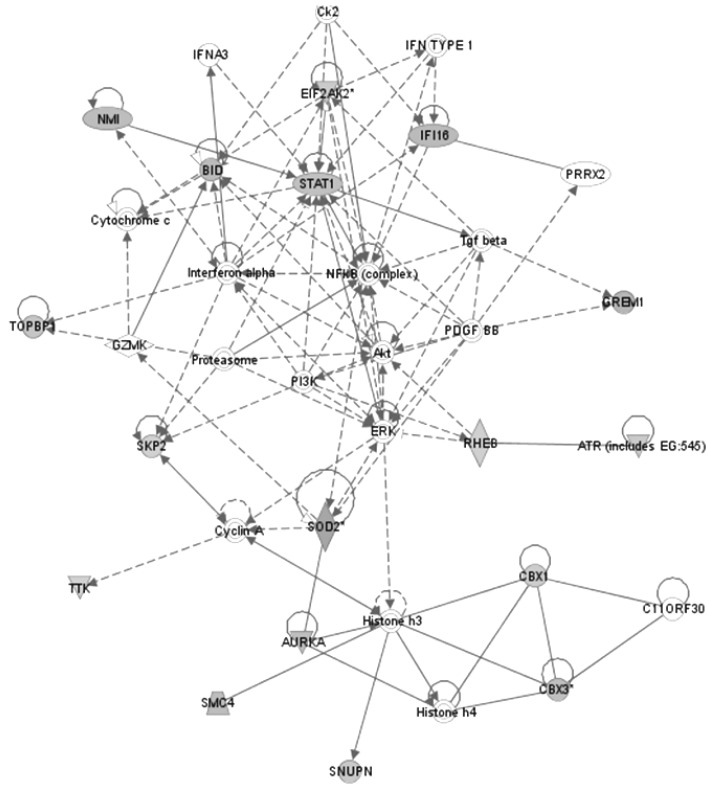
To generate networks in this work, the knowledge base was queried for interactions between the identified genes and all other genes stored in the database. Four networks were found to be significant in OSCC. The network with the highest score (Network 1, score = 36) was generated, with 17 identified genes (Table 7, Fig. 3).
In the network diagram, STAT1 and SOD2 neighbored with NMI and AURKA, respectively. The expression levels of STAT1 and SOD2 could be expected to be related with those of NMI and SOD2. Actually, the expressions of STAT1 and SOD2 were strongly positively correlated with NMI (r = 0.95) and AURKA (r = 0.87), respectively.

Discussion

OSCC is associated with substantial mortality and morbidity [58]. To identify potential biomarkers for early detection of invasive OSCC, microarray experiments have been conducted, and these kinds of microarray datasets have accumulated rapidly in the public database. However, there are many datasets that include insufficient sample sizes for detecting significant genes by statistical analysis. Therefore, this study attempted to combine several microarray datasets from a public database to identify significant candidates as biomarkers.
In a microarray data analysis, the information from different datasets obtained under different experimental conditions may be inconsistent even though they are performed with the same research objectives. Moreover, even when the datasets are generated by the same platform, the data agreement may be affected by technical variations between laboratories. In such cases, it could be necessary to use a combined dataset after adjusting for the differences between such datasets for detecting the more reliable information. Combining datasets is especially useful in OSCC microarray datasets, because there are many datasets with insufficient sample sizes for analysis [4, 5, 59, 60].
For identifying significant genes classifying tumor and normal groups, we achieved two microarray datasets from a public database, GEO. They included 20 and 27 samples, and each sample size was unbalanced between the different groups. By combining these two datasets, the sample size was increased, and we had a sufficient sample size for statistical analysis, even though it was still unbalanced. When these datasets were combined, we used the rank of gene expression, because the scale of gene expression was different. In this study, we identified 51 significant genes from a combined dataset, and this number could be increased or decreased by the significance level (we used 0.005). The selected 51 genes were upregulated in tumor tissues. Many of the selected genes were proven to be cancer-related genes by previous studies.
SOD2 is associated with lymph node metastasis in OSCC and may provide predictive values for the diagnosis of metastasis [10]. Metastasis is a critical event in OSCC progression. An SOD2 variant has also been associated with increased breast cancer and ovarian cancer risk in previous studies [47, 61]. TopBP1 included eight BRCT domains (originally identified in BRCA1), and it was proposed as a breast cancer susceptibility gene [18, 62].
By semiquantitative reverse transcription PCR analysis, RHEB was shown to be upregulated in OSCC [9]. In salivary cancer, survival probability rates dropped when Skp2 was overexpressed [7]. Overexpression of Skp2 is associated with the reduction of p27 (KIP1) expression and may have a role in the progression of OSCC [25].
The expression of RCN2 was linearly related to the tumor mass increase, and its expression was increased in breast cancer [16]. PTPRK was proven as a candidate gene of colorectal cancer [19], and it is a functional tumor suppressor in Hodgkin lymphoma cells [20]. DMTF1 was shown to be amplified in adenocarcinoma of the gastroesophageal junction, residing at 7q21 by aCGH experiments [21]. FEZ1 was involved in ovarian carcinogenesis, and its reduction or loss could be an aid to the clinical management of patients affected by ovarian carcinoma [22]. It is also a known tumor suppressor gene in breast cancer and gastric cancer [23, 63].
Other ovarian cancer-related genes were NMI [27, 28] and FANCI [44]; breast cancer-related genes were COX11 [42], MELK [33], and FANCI [44] among the selected genes. MELK was known to be associated with shorter survival in glioblastoma [34].
TTK was associated with progression and metastasis of advanced cervical cancers after radiotherapy [29, 30]. It might also be a relevant candidate as a new target in cancer therapy, since it plays relevant roles in mitotic progression and the spindle checkpoint [31, 32]. Aurora kinase A (AURKA) was associated with skin tumors [36] and colorectal cancer [37, 38].
In previous studies, OSCC-related genes among the selected genes were STAT1 [14], SKP2 [7, 25], IFI16 [8], RHEB [9], IFI44 [64], SOD2 [10-12], and GREM1 [11]. The gene set, which has not been proven as OSCC-related genes until now, could be expected to be possibly proven as OSCC-related genes by biological evaluation.
In this study, we identified significant genes related with OSCC from two microarray datasets in a public database. For this, we transformed microarray datasets using ranks of gene expressions with different expression scales, even though they were constructed under the same experimental conditions. This method could be useful when using multiple datasets that are created for the same research purpose, By combining these accumulated datasets, we can detect more reliable information due to the increased sample size. It saves time and money and avoids repeating experiments.

Acknowledgments

This work was supported by the Priority Research Centers Program through the National Research Foundation of Korea (NRF), funded by the Ministry of Education, Science and Technology (2011-0031396).

References

1. Sparano A, Quesnelle KM, Kumar MS, Wang Y, Sylvester AJ, Feldman M, et al. Genome-wide profiling of oral squamous cell carcinoma by array-based comparative genomic hybridization. Laryngoscope 2006;116:735–741. PMID: 16652080.
crossref pmid
2. Smeets SJ, Brakenhoff RH, Ylstra B, van Wieringen WN, van de Wiel MA, Leemans CR, et al. Genetic classification of oral and oropharyngeal carcinomas identifies subgroups with a different prognosis. Cell Oncol 2009;31:291–300. PMID: 19633365.
crossref pmid pmc pdf
3. Kim KY, Ki DH, Jeung HC, Chung HC, Rha SY. Improving the prediction accuracy in classification using the combined data sets by ranks of gene expressions. BMC Bioinformatics 2008;9:283. PMID: 18554423.
crossref pmid pmc
4. Toruner GA, Ulger C, Alkan M, Galante AT, Rinaggio J, Wilk R, et al. Association between gene expression profile and tumor invasion in oral squamous cell carcinoma. Cancer Genet Cytogenet 2004;154:27–35. PMID: 15381369.
crossref pmid
5. O'Donnell RK, Kupferman M, Wei SJ, Singhal S, Weber R, O'Malley B, et al. Gene expression signature predicts lymphatic metastasis in squamous cell carcinoma of the oral cavity. Oncogene 2005;24:1244–1251. PMID: 15558013.
crossref pmid
6. Hiroi M, Mori K, Sakaeda Y, Shimada J, Ohmori Y. STAT1 represses hypoxia-inducible factor-1-mediated transcription. Biochem Biophys Res Commun 2009;387:806–810. PMID: 19646959.
crossref pmid
7. Ben-Izhak O, Akrish S, Gan S, Nagler RM. Skp2 and salivary cancer. Cancer Biol Ther 2009;8:153–158. PMID: 19029817.
crossref pmid
8. De Andrea M, Gioia D, Mondini M, Azzimonti B, Renò F, Pecorari G, et al. Effects of IFI16 overexpression on the growth and doxorubicin sensitivity of head and neck squamous cell carcinoma-derived cell lines. Head Neck 2007;29:835–844. PMID: 17510972.
crossref pmid
9. Chakraborty S, Mohiyuddin SM, Gopinath KS, Kumar A. Involvement of TSC genes and differential expression of other members of the mTOR signaling pathway in oral squamous cell carcinoma. BMC Cancer 2008;8:163. PMID: 18538015.
crossref pmid pmc pdf
10. Ye H, Wang A, Lee BS, Yu T, Sheng S, Peng T, et al. Proteomic based identification of manganese superoxide dismutase 2 (SOD2) as a metastasis marker for oral squamous cell carcinoma. Cancer Genomics Proteomics 2008;5:85–94. PMID: 18460737.
pmid pmc
11. Ye H, Yu T, Temam S, Ziober BL, Wang J, Schwartz JL, et al. Transcriptomic dissection of tongue squamous cell carcinoma. BMC Genomics 2008;9:69. PMID: 18254958.
crossref pmid pmc
12. Liu X, Yu J, Jiang L, Wang A, Shi F, Ye H, et al. MicroRNA-222 regulates cell invasion by targeting matrix metalloproteinase 1 (MMP1) and manganese superoxide dismutase 2 (SOD2) in tongue squamous cell carcinoma cell lines. Cancer Genomics Proteomics 2009;6:131–139. PMID: 19487542.
pmid pmc
13. Yang ZJ, Yang G, Jiang YM, Ran YL, Yang ZH, Zhang W, et al. Screening and sero-immunoscreening of ovarian epithelial cancer associative antigens. Zhonghua Fu Chan Ke Za Zhi 2007;42:834–839. PMID: 18476518.
pmid
14. Hiroi M, Mori K, Sekine K, Sakaeda Y, Shimada J, Ohmori Y. Mechanisms of resistance to interferon-gamma-mediated cell growth arrest in human oral squamous carcinoma cells. J Biol Chem 2009;284:24869–24880. PMID: 19596857.
crossref pmid pmc
15. Laimer K, Spizzo G, Obrist P, Gastl G, Brunhuber T, Schäfer G, et al. STAT1 activation in squamous cell cancer of the oral cavity: a potential predictive marker of response to adjuvant chemotherapy. Cancer 2007;110:326–333. PMID: 17559122.
crossref pmid
16. Cavallo F, Astolfi A, Iezzi M, Cordero F, Lollini PL, Forni G, et al. An integrated approach of immunogenomics and bioinformatics to identify new Tumor Associated Antigens (TAA) for mammary cancer immunological prevention. BMC Bioinformatics 2005;6(Suppl 4):S7. PMID: 16351756.
crossref pmid pmc
17. Luo B, Cheung HW, Subramanian A, Sharifnia T, Okamoto M, Yang X, et al. Highly parallel identification of essential genes in cancer cells. Proc Natl Acad Sci U S A 2008;105:20380–20385. PMID: 19091943.
crossref pmid pmc
18. Going JJ, Nixon C, Dornan ES, Boner W, Donaldson MM, Morgan IM. Aberrant expression of TopBP1 in breast cancer. Histopathology 2007;50:418–424. PMID: 17448016.
crossref pmid
19. Starr TK, Allaei R, Silverstein KA, Staggs RA, Sarver AL, Bergemann TL, et al. A transposon-based genetic screen in mice identifies genes altered in colorectal cancer. Science 2009;323:1747–1750. PMID: 19251594.
crossref pmid pmc
20. Flavell JR, Baumforth KR, Wood VH, Davies GL, Wei W, Reynolds GM, et al. Down-regulation of the TGF-beta target gene, PTPRK, by the Epstein-Barr virus encoded EBNA1 contributes to the growth and survival of Hodgkin lymphoma cells. Blood 2008;111:292–301. PMID: 17720884.
crossref pmid
21. van Dekken H, Vissers K, Tilanus HW, Kuo WL, Tanke HJ, Rosenberg C, et al. Genomic array and expression analysis of frequent high-level amplifications in adenocarcinomas of the gastro-esophageal junction. Cancer Genet Cytogenet 2006;166:157–162. PMID: 16631473.
crossref pmid
22. Califano D, Pignata S, Pisano C, Greggi S, Laurelli G, Losito NS, et al. FEZ1/LZTS1 protein expression in ovarian cancer. J Cell Physiol 2010;222:382–386. PMID: 19885841.
crossref pmid
23. Chen L, Zhu Z, Sun X, Dong XY, Wei J, Gu F, et al. Down-regulation of tumor suppressor gene FEZ1/LZTS1 in breast carcinoma involves promoter methylation and associates with metastasis. Breast Cancer Res Treat 2009;116:471–478. PMID: 18686028.
crossref pmid pmc
24. Fabris C, Basso D, Del Favero G, Meggiato T, Piccoli A, Angonese C, et al. Renal handling of amylase and immunoreactive trypsin in pancreatic cancer and chronic pancreatitis. Clin Physiol Biochem 1990;8:30–37. PMID: 1691065.
pmid
25. Shintani S, Li C, Mihara M, Hino S, Nakashiro K, Hamakawa H. Skp2 and Jab1 expression are associated with inverse expression of p27(KIP1) and poor prognosis in oral squamous cell carcinomas. Oncology 2003;65:355–362. PMID: 14707456.
crossref pmid
26. Hayes DC, Secrist H, Bangur CS, Wang T, Zhang X, Harlan D, et al. Multigene real-time PCR detection of circulating tumor cells in peripheral blood of lung cancer patients. Anticancer Res 2006;26:1567–1575. PMID: 16619573.
pmid
27. Fillmore RA, Mitra A, Xi Y, Ju J, Scammell J, Shevde LA, et al. Nmi (N-Myc interactor) inhibits Wnt/beta-catenin signaling and retards tumor growth. Int J Cancer 2009;125:556–564. PMID: 19358268.
crossref pmid
28. Quaye L, Song H, Ramus SJ, Gentry-Maharaj A, Høgdall E, DiCioccio RA, et al. Tagging single-nucleotide polymorphisms in candidate oncogenes and susceptibility to ovarian cancer. Br J Cancer 2009;100:993–1001. PMID: 19240718.
crossref pmid pmc
29. Harima Y, Ikeda K, Utsunomiya K, Shiga T, Komemushi A, Kojima H, et al. Identification of genes associated with progression and metastasis of advanced cervical cancers after radiotherapy by cDNA microarray analysis. Int J Radiat Oncol Biol Phys 2009;75:1232–1239. PMID: 19857786.
crossref pmid
30. Kono K, Mizukami Y, Daigo Y, Takano A, Masuda K, Yoshida K, et al. Vaccination with multiple peptides derived from novel cancer-testis antigens can induce specific T-cell responses and clinical responses in advanced esophageal cancer. Cancer Sci 2009;100:1502–1509. PMID: 19459850.
crossref pmid
31. de Cárcer G, Pérez de Castro I, Malumbres M. Targeting cell cycle kinases for cancer therapy. Curr Med Chem 2007;14:969–985. PMID: 17439397.
crossref pmid
32. Suda T, Tsunoda T, Daigo Y, Nakamura Y, Tahara H. Identification of human leukocyte antigen-A24-restricted epitope peptides derived from gene products upregulated in lung and esophageal cancers as novel targets for immunotherapy. Cancer Sci 2007 9 02 [Epub]. http://dx.doi.org/10.1111/j.1349-7006.2007.00603.x.
crossref
33. Pickard MR, Green AR, Ellis IO, Caldas C, Hedge VL, Mourtada-Maarabouni M, et al. Dysregulated expression of Fau and MELK is associated with poor prognosis in breast cancer. Breast Cancer Res 2009;11:R60. PMID: 19671159.
crossref pmid pmc pdf
34. Kappadakunnel M, Eskin A, Dong J, Nelson SF, Mischel PS, Liau LM, et al. Stem cell associated gene expression in glioblastoma multiforme: relationship to survival and the subventricular zone. J Neurooncol 2010;96:359–367. PMID: 19655089.
crossref pmid pmc
35. Gałeza-Kulik M, Zebracka J, Szpak-Ulczok S, Czarniecka AK, Kukulska A, Gubala E, et al. Expression of selected genes involved in transport of ions in papillary thyroid carcinoma. Endokrynol Pol 2006;57(Suppl A):26–31. PMID: 17091453.
pmid
36. Torchia EC, Chen Y, Sheng H, Katayama H, Fitzpatrick J, Brinkley WR, et al. A genetic variant of Aurora kinase A promotes genomic instability leading to highly malignant skin tumors. Cancer Res 2009;69:7207–7215. PMID: 19738056.
crossref pmid pmc
37. Chen J, Etzel CJ, Amos CI, Zhang Q, Viscofsky N, Lindor NM, et al. Genetic variants in the cell cycle control pathways contribute to early onset colorectal cancer in Lynch syndrome. Cancer Causes Control 2009;20:1769–1777. PMID: 19690970.
crossref pmid pmc
38. Kaestner P, Stolz A, Bastians H. Determinants for the efficiency of anticancer drugs targeting either Aurora-A or Aurora-B kinases in human colon carcinoma cells. Mol Cancer Ther 2009;8:2046–2056. PMID: 19584233.
crossref pmid
39. Alimirah F, Chen J, Davis FJ, Choubey D. IFI16 in human prostate cancer. Mol Cancer Res 2007;5:251–259. PMID: 17339605.
crossref pmid
40. Zhang Y, Howell RD, Alfonso DT, Yu J, Kong L, Wittig JC, et al. IFI16 inhibits tumorigenicity and cell proliferation of bone and cartilage tumor cells. Front Biosci 2007;12:4855–4863. PMID: 17569615.
crossref pmid
41. Ortega-Paino E, Fransson J, Ek S, Borrebaeck CA. Functionally associated targets in mantle cell lymphoma as defined by DNA microarrays and RNA interference. Blood 2008;111:1617–1624. PMID: 18024791.
crossref pmid
42. Ahmed S, Thomas G, Ghoussaini M, Healey CS, Humphreys MK, Platte R, et al. Newly discovered breast cancer susceptibility loci on 3p24 and 17q23.2. Nat Genet 2009;41:585–590. PMID: 19330027.
crossref pmid pmc
43. Zhi G, Wilson JB, Chen X, Krause DS, Xiao Y, Jones NJ, et al. Fanconi anemia complementation group FANCD2 protein serine 331 phosphorylation is important for fanconi anemia pathway function and BRCA2 interaction. Cancer Res 2009;69:8775–8783. PMID: 19861535.
crossref pmid pmc
44. Barroso E, Pita G, Arias JI, Menendez P, Zamora P, Blanco M, et al. The Fanconi anemia family of genes and its correlation with breast cancer susceptibility and breast cancer features. Breast Cancer Res Treat 2009;118:655–660. PMID: 19536649.
crossref pmid
45. Lee ES, Son DS, Kim SH, Lee J, Jo J, Han J, et al. Prediction of recurrence-free survival in postoperative non-small cell lung cancer patients by using an integrated model of clinical information and gene expression. Clin Cancer Res 2008;14:7397–7404. PMID: 19010856.
crossref pmid
46. Skrzycki M, Majewska M, Podsiad M, Czeczot H. Expression and activity of superoxide dismutase isoenzymes in colorectal cancer. Acta Biochim Pol 2009;56:663–670. PMID: 19902052.
crossref pmid
47. Olson SH, Carlson MD, Ostrer H, Harlap S, Stone A, Winters M, et al. Genetic variants in SOD2, MPO, and NQO1, and risk of ovarian cancer. Gynecol Oncol 2004;93:615–620. PMID: 15196853.
crossref pmid
48. Lorch JH, Thomas TO, Schmoll HJ. Bortezomib inhibits cell-cell adhesion and cell migration and enhances epidermal growth factor receptor inhibitor-induced cell death in squamous cell cancer. Cancer Res 2007;67:727–734. PMID: 17234784.
crossref pmid
49. Lorch JH, Klessner J, Park JK, Getsios S, Wu YL, Stack MS, et al. Epidermal growth factor receptor inhibition promotes desmosome assembly and strengthens intercellular adhesion in squamous cell carcinoma cells. J Biol Chem 2004;279:37191–37200. PMID: 15205458.
crossref pmid
50. Crighton D, Wilkinson S, Ryan KM. DRAM links autophagy to p53 and programmed cell death. Autophagy 2007;3:72–74. PMID: 17102582.
crossref pmid
51. Crighton D, Wilkinson S, O'Prey J, Syed N, Smith P, Harrison PR, et al. DRAM, a p53-induced modulator of autophagy, is critical for apoptosis. Cell 2006;126:121–134. PMID: 16839881.
crossref pmid
52. Mackay A, Urruticoechea A, Dixon JM, Dexter T, Fenwick K, Ashworth A, et al. Molecular response to aromatase inhibitor treatment in primary breast cancer. Breast Cancer Res 2007;9:R37. PMID: 17555561.
crossref pmid pmc pdf
53. Turashvili G, Bouchal J, Baumforth K, Wei W, Dziechciarkova M, Ehrmann J, et al. Novel markers for differentiation of lobular and ductal invasive breast carcinomas by laser microdissection and microarray analysis. BMC Cancer 2007;7:55. PMID: 17389037.
crossref pmid pmc pdf
54. Fields AP, Justilien V. The guanine nucleotide exchange factor (GEF) Ect2 is an oncogene in human cancer. Adv Enzyme Regul 2010;50:190–200. PMID: 19896966.
crossref pmid pmc
55. Boelens MC, Kok K, van der Vlies P, van der Vries G, Sietsma H, Timens W, et al. Genomic aberrations in squamous cell lung carcinoma related to lymph node or distant metastasis. Lung Cancer 2009;66:372–378. PMID: 19324446.
crossref pmid
56. Hirata D, Yamabuki T, Miki D, Ito T, Tsuchiya E, Fujita M, et al. Involvement of epithelial cell transforming sequence-2 oncoantigen in lung and esophageal cancer progression. Clin Cancer Res 2009;15:256–266. PMID: 19118053.
crossref pmid
57. Ingenuity Systems Accessed, 2011 Oct 3. Avaiable from: http://www.injenuity.com.

58. Chen C, Méndez E, Houck J, Fan W, Lohavanichbutr P, Doody D, et al. Gene expression profiling identifies genes predictive of oral squamous cell carcinoma. Cancer Epidemiol Biomarkers Prev 2008;17:2152–2162. PMID: 18669583.
crossref pmid pmc
59. Severino P, Alvares AM, Michaluart P Jr, Okamoto OK, Nunes FD, Moreira-Filho CA, et al. Global gene expression profiling of oral cavity cancers suggests molecular heterogeneity within anatomic subsites. BMC Res Notes 2008;1:113. PMID: 19014556.
crossref pmid pmc
60. Gemenetzidis E, Bose A, Riaz AM, Chaplin T, Young BD, Ali M, et al. FOXM1 upregulation is an early event in human squamous cell carcinoma and it is enhanced by nicotine during malignant transformation. PLoS One 2009;4:e4849. PMID: 19287496.
crossref pmid pmc
61. Knight JA, Onay UV, Wells S, Li H, Shi EJ, Andrulis IL, et al. Genetic variants of GPX1 and SOD2 and breast cancer risk at the Ontario site of the Breast Cancer Family Registry. Cancer Epidemiol Biomarkers Prev 2004;13:146–149. PMID: 14744747.
crossref pmid
62. Liu K, Bellam N, Lin HY, Wang B, Stockard CR, Grizzle WE, et al. Regulation of p53 by TopBP1: a potential mechanism for p53 inactivation in cancer. Mol Cell Biol 2009;29:2673–2693. PMID: 19289498.
crossref pmid pmc
63. Vecchione A, Ishii H, Shiao YH, Trapasso F, Rugge M, Tamburrino JF, et al. Fez1/lzts1 alterations in gastric carcinoma. Clin Cancer Res 2001;7:1546–1552. PMID: 11410489.
pmid
64. Serrano-Fernández P, Möller S, Goertsches R, Fiedler H, Koczan D, Thiesen HJ, et al. Time course transcriptomics of IFNB1b drug therapy in multiple sclerosis. Autoimmunity 2010;43:172–178. PMID: 19883335.
crossref pmid
Fig. 1
Comparison of expression levels of two datasets. (A) Whole gene set. (B) Selected gene set.
gni-10-23-g001.jpg
Fig. 2
Expression patterns of the selected 51 genes. These genes were upregulated in oral squamous cell carcinoma tissues, and normal and tumor groups were clearly classified with these genes.
gni-10-23-g002.jpg
Fig. 3
Network with the highest score (Network 1). Functional relationships between genes based on known interactions in Ingenuity Pathway Analysis (IPA) knowledge are described.
gni-10-23-g003.jpg
Table 1.
Summary of two microarray datasets from GEO and the combined dataset
Data name Experimental platform No. of genes No. of total samples Normal group Tumor group
Data 2004 [4] Affymetrix U133A 14,119 20 4 16
Data 2005 [5] Affymetrix U133A 22,283 27 5 22
Combined dataset 14,119 47 9 38

GEO, Gene Expression Omnibus.

Table 2.
Combination of contingency tables for three datasets (tij = aij + bij + cij)
Dataset A
Dataset B
Dataset C
Combined dataset
P1 P2 P3 P1 P2 P3 P1 P2 P3 P1 P2 P3
E1 a11 a12 a13 b11 b12 b13 c11 c12 c13 t11 t12 t13
E2 a21 a22 a23 + b21 b22 b23 + c21 c22 c23 = t21 t22 t23
E3 a31 a32 a33 b31 b32 b33 c31 c32 c33 t31 t32 t33

P1, P2, and P3 represent the three different phenotypes. E1, E2, and E3 represent three groups by rank of gene expressions. aij, bij, and cij are the numbers of experiments belonging to Pj and Ei at the same time in data A, data B, and data C, respectively.

Table 3.
Summary of discretized data using ranks of gene expressions
Experimental groups by phenotypes
P1 P2 P3 Marginal sum
Experimental group by rank of gene expression E1 n11 n12 n13 r1
E2 n21 n22 n23 r2
E3 n31 n32 n33 r3
Marginal sum c1 c2 c3 n
Table 4.
Summary of two microarray datasets
Data 2004 Data 2005
Subgroup
 Tumor 16 22
 Normal 4 5
Sex
 Male 15 21
 Female 5 6
Age (mean, standard deviation) 56.9 (10.22) 60.03 (14.16)
Primary site
 Tongue 7 16
 Floor of mouth 9 5
 Other 4 6
T stage
 T1 1 4
 T2 7 8
 T3 1 4
 T4 9 10
 Missing 2 1
Table 5.
Summary of selected 51 upregulated genes
Affymetrix No. Gene Description Fold change
200037_s_at CBX3 Chromobox homolog 3 (hp1 gamma homolog, drosophila) 2.219978
200056_s_at C1D Nuclear dna-binding protein 2.448721
200887_s_at STAT1 Signal transducer and activator of transcription 1, 91kda 4.307249
201091_s_at CBX3 Chromobox homolog 3 (hp1 gamma homolog, drosophila) 3.647541
201486_at RCN2 Reticulocalbin 2, ef-hand calcium binding domain 2.279745
201518_at CBX1 Chromobox homolog 1 (hp1 beta homolog drosophila) 2.132493
201663_s_at SMC4 Smc4 structural maintenance of chromosomes 4-like 1 (yeast) 2.434400
202633_at TOPBP1 Topoisomerase (dna) ii binding protein 1 2.189444
203038_at PTPRK Protein tyrosine phosphatase, receptor type, k 3.345238
203301_s_at DMTF1 Cyclin d binding myb-like transcription factor 1 1.378319
203562_at FEZ1 Fasciculation and elongation protein zeta 1 (zygin i) 2.853794
203566_s_at AGL Amylo-1, 6-glucosidase, 4-alpha-glucanotransferase 2.114894
203595_s_at IFIT5 Interferon-induced protein with tetratricopeptide repeats 5 2.664490
203625_x_at SKP2 S-phase kinase-associated protein 2 (p45) 2.007377
203744_at HMGB3 High-mobility group box 3 2.974931
203964_at NMI N-myc (and stat) interactor 3.840395
204211_x_at EIF2AK2 Eukaryotic translation initiation factor 2-alpha kinase 2 1.994068
204439_at IFI44L Interferon-induced protein 44-like 124.396853
204822_at TTK ttk protein kinase 2.414220
204825_at MELK Maternal embryonic leucine zipper kinase 3.755818
206765_at KCNJ2 Potassium inwardly-rectifying channel, subfamily j, member 2 1.810372
207438_s_at SNUPN rna, u transporter 1 1.913825
208079_s_at AURKA Aurora kinase a 3.848891
208966_x_at IFI16 Interferon, gamma-inducible protein 16 2.568727
209095_at DLD Dihydrolipoamide dehydrogenase 1.476130
209524_at HDGFRP3 Hepatoma-derived growth factor, related protein 3 2.724985
209903_s_at ATR Ataxia telangiectasia and rad3-related 1.635679
210283_x_at PAIP1 Poly(a) binding protein interacting protein 1 1.997611
211725_s_at BID bh3 interacting domain death agonist 3.476190
211727_s_at COX11 Cox11 homolog, cytochrome c oxidase assembly protein 1.419895
212314_at KIAA0746 kiaa0746 protein 10.323529
212765_at CAMSAP1L1 Calmodulin-regulated spectrin-associated protein 1-like 1 1.717589
212959_s_at GNPTAB Hypothetical protein dkfzp762b226 1.733743
213008_at FANCI kiaa1794 2.935005
213104_at C16ORF42 Hypothetical protein mgc24381 2.059115
213294_at CCDC75 Coiled-coil domain-containing 75 4.261916
213404_s_at RHEB ras homolog enriched in brain 1.536225
213452_at ZNF184 Zinc finger protein 184 (kruppel-like) 1.534287
213679_at TTC30A Hypothetical protein flj13946 2.374943
214453_s_at IFI44 Interferon-induced protein 44 11.920148
215223_s_at SOD2 Superoxide dismutase 2, mitochondrial 4.950142
215495_s_at SAMD4A Sterile alpha motif domain containing 4a 3.204074
216841_s_at SOD2 Superoxide dismutase 2, mitochondrial 4.790233
217901_at DSG2 Desmoglein 2 5.614525
218469_at GREM1 Gremlin 1, cysteine knot superfamily, homolog 3.366686
218627_at DRAM Damage-regulated autophagy modulator 2.780824
218901_at PLSCR4 Phospholipid scramblase 4 3.663654
218986_s_at FLJ20035 Hypothetical protein flj10787 6.364550
219087_at ASPN Asporin (lrr class 1) 7.895878
219372_at IFT81 Intraflagellar transport 81 homolog (chlamydomonas) 1.875798
219787_s_at ECT2 Epithelial cell transforming sequence 2 oncogene 4.242975
Table 6.
Association of the selected genes and cancer
Gene Cancer association References OSCC association References Fold change
CBX3 2.219978
C1D Yes Yang et al. [13] 2.448721
STAT1 Yes Hiroi et al. [6] Yes Hiroi et al. [14] 4.307249
Laimer et al. [15]
RCN2 Yes Cavallo et al. [16] 2.279745
CBX1 Yes Luo et al. [17] 2.132493
SMC4 2.434400
TOPBP1 Yes Going et al. [18] 2.189444
PTPRK Yes Starr et al. [19] 3.345238
Flavell et al. [20]
DMTF1 Yes van Dekken et al. [21] 1.378319
FEZ1 Yes Califano et al. [22] 2.853794
Chen et al. [23]
AGL Yes Fabris et al. [24] 2.114894
IFIT5 Ben-Izhak et al. [7] 2.664490
SKP2 Yes Shintani et al. [25] Yes 2.007377
HMGB3 Yes Hayes et al. [26] 2.974931
NMI Yes Fillmore et al. [27] 3.840395
Quaye et al. [28]
EIF2AK2 1.994068
IFI44L 124.396853
TTK Yes Harima et al. [29] 2.414220
Kono et al. [30]
de Cárcer et al. [31]
Suda et al. [32]
MELK Yes Pickard et al. [33] 3.755818
Kappadakunnel et al. [34]
KCNJ2 Yes Gałeza-Kulik et al. [35] 1.810372
SNUPN 1.913825
AURKA Yes Torchia et al. [36] 3.848891
Chen et al. [37] De Andrea et al. [8]
Kaestner et al. [38]
IFI16 Yes Alimirah et al. [39] Yes 2.568727
Zhang et al. [40]
DLD Ortega-Paino et al. [41] 1.476130
HDGFRP3 Yes 2.724985
ATR 1.635679
PAIP1 1.997611
BID Ahmed et al. [42] 3.476190
COX11 Yes 1.419895
KIAA0746 10.323529
CAMSAP1L1 1.717589
GNPTAB Zhi et al. [43] 1.733743
FANCI Yes Barroso et al. [44] 2.935005
C16ORF42 2.059115
CCDC75 Chakraborty et al. [9] 4.261916
RHEB Yes 1.536225
ZNF184 1.534287
TTC30A Lee et al. [45] Ye et al. [11] 2.374943
IFI44 Yes Skrzycki et al. [46] Yes Liu et al. [12] 11.920148
SOD2 Yes Olson et al. [47] Yes Ye et al. [10] 4.950142
SAMD4A Lorch et al. [48] 4.790233
DSG2 Yes Lorch et al. [49] Ye et al. [11] 5.614525
GREM1 Crighton et al. [50] Yes 3.366686
DRAM Yes Crighton et al. [51] 2.780824
PLSCR4 3.663654
FLJ20035 Mackay et al. [52] 6.364550
ASPN Yes Turashvili et al. [53] 7.895878
IFT81 Fields and Justilien [54] 1.875798
ECT2 Yes Boelens et al. [55] 4.242975
Hirata et al. [56]

OSCC, oral squamous cell carcinoma.

Table 7.
Four networks generated by upregulated genes in OSCC
Network Genes Ingenuity networksa Function Scoreb
1 Akt, ATR (includes EG:545), AURKA, BID, C11ORF30, CBX1, CBX3, Ck2, Cyclin A, Cytochrome c, EIF2AK2, ERK, GREM1, GZMK, Histone h3, Histone h4, IFI16, IFN TYPE 1, IFNA3, Interferon alpha, NFkB (complex), NMI, PDGF BB, PI3K, PIF, Proteasome, RHEB, SKP2, SMC4, SNUPN, SOD2, STAT1, Tgf beta, TOPBP1, TTK Cancer, cellular response to therapeutics, cell cycle 36
2 AGL, ASPN, beta-estradiol, BTG1, C1D, COX11, DDX60, DNAJB4, DSC2, DSG2, ECT2, FGF13, GBP1 (includes EG:2633), HNF4A, IFI44, IFI44L, IFIT5, IFNA2, IFNA4, IFNA6, IFNA7, IFNA5 (includes EG:3442), KCNJ2, MAPK14, MST1, MYOG, NUP153, PARP9, PTPRK, RCN2, SMAD3, SSTR1, TGFB1, TGTP, TMF1 Cell-mediated immune response, embryonic development, antigen presentation 28
3 CAMSAP1L1, CDC25A, CDKN2A, DHFR, DISC1, DLD, DMTF1, DRAM (includes EG:55332), E2F4, FANCI, FEZ1, GNB2L1, GNPTAB, HMGB3, IFI202B, LBR, MCM3, MCM5, MELK, MKI67, MLC1, PABPC1, PAIP1, PDHB, Pias, PLSCR4, PRMT1, RUVBL2, SAMD4A, SLC2A4, TFDP1, TK1, TP53, TRA2B, YWHAG Cell cycle, connective tissue development and function, cell death 24
4 CAMSAP1L1, CDC25A, CDKN2A, DHFR, DISC1, DLAT, DLD, DMTF1, DRAM (includes EG:55332), E2F4, EIF4A, FANCI, FEZ1, GNPTAB, HMGB3, IFI202B, LBR, MCM3, MCM5, MELK, MKI67, MLC1, PABPC1, PAIP1, PDHB, Pias, PLSCR4, PRMT1, RUVBL2, SAMD4A, SLC2A4, TFDP1, TP53, TRA2B, YWHAG Cell cycle, connective tissue development and function, lipid metabolism 24

OSCC, oral squamous cell carcinoma.

a Genes in bold were identified in this study; other genes were neither on the expression array data used in this work nor changed significantly;

b A score > 3 was considered significant.

TOOLS
Share :
Facebook Twitter Linked In Google+
METRICS Graph View
  • 5 Crossref
  •    
  • 4,832 View
  • 71 Download
Related articles in GNI


ABOUT
ARTICLE CATEGORY

Browse all articles >

BROWSE ARTICLES
FOR CONTRIBUTORS
Editorial Office
Room No. 806, 193 Mallijae-ro, Jung-gu, Seoul 04501, Korea
Tel: +82-2-558-9394    Fax: +82-2-558-9434    E-mail: kogo3@kogo.or.kr                

Copyright © 2024 by Korea Genome Organization.

Developed in M2PI

Close layer
prev next