Network Graph Analysis of Gene-Gene Interactions in Genome-Wide Association Study Data
Article information
Abstract
Most common complex traits, such as obesity, hypertension, diabetes, and cancers, are known to be associated with multiple genes, environmental factors, and their epistasis. Recently, the development of advanced genotyping technologies has allowed us to perform genome-wide association studies (GWASs). For detecting the effects of multiple genes on complex traits, many approaches have been proposed for GWASs. Multifactor dimensionality reduction (MDR) is one of the powerful and efficient methods for detecting high-order gene-gene (GxG) interactions. However, the biological interpretation of GxG interactions identified by MDR analysis is not easy. In order to aid the interpretation of MDR results, we propose a network graph analysis to elucidate the meaning of identified GxG interactions. The proposed network graph analysis consists of three steps. The first step is for performing GxG interaction analysis using MDR analysis. The second step is to draw the network graph using the MDR result. The third step is to provide biological evidence of the identified GxG interaction using external biological databases. The proposed method was applied to Korean Association Resource (KARE) data, containing 8838 individuals with 327,632 single-nucleotide polymorphisms, in order to perform GxG interaction analysis of body mass index (BMI). Our network graph analysis successfully showed that many identified GxG interactions have known biological evidence related to BMI. We expect that our network graph analysis will be helpful to interpret the biological meaning of GxG interactions.
Introduction
In recent years, a significant advance of technology has been achieved in both genotyping and computing fields, which has enabled us to perform large-scale genome-wide association studies (GWASs) [1, 2]. GWASs have provided enormous potential in identifying genetic variants for common complex diseases. By GWASs, researchers have discovered many genetic variants that affect common complex traits, such as height, type 2 diabetes, and blood pressure [3-5].
In particular, the nature of obesity is related with many chronic diseases, such as type 2 diabetes, cardiovascular disease, and cancers [6-8]. In addition, it has been found that obesity may be caused by multiple genes, environmental factors, and those interactions [9-11].
In order to identify the genes associated with obesity, body mass index (BMI) has been commonly used as an obesity-related phenotype or trait in GWASs. Many studies have reported that the genetic variants in FTO are associated with BMI [12, 13]. Most of these studies have used the single single-nucleotide polymorphism (SNP) approach, in which each single susceptible locus is searched in association with obesity. The single SNP approach has long been used in detecting genetic traits, and it is especially optimal for Mendelian traits. However, complex traits are well known to be caused by multiple genetic factors as well as several environmental factors and their interactions. Thus, the single SNP approach is not appropriate for detecting multiple genetic factors affecting common complex polygenic traits.
For the identification of multiple and joint genetic factors associated with complex traits, the multifactor dimensionality reduction (MDR) method has been proposed by Ritchie et al. [14] and applied in detecting gene-gene (GxG) interactions [15, 16]. However, their approach can be applied only to binary traits, and the covariates that may affect the phenotype can not be adjusted. In order to overcome these drawbacks, generalized MDR (GMDR) analysis was proposed by Lou et al. [17], in which both binary and quantitative traits can be considered phenotypes while adjusting for covariates.
Although MDR and GMDR have been widely used to detect GxG interactions in genetic association studies, their applications have been mainly involved in dealing with candidate genes or a small set of genes. Since enormous computational complexity and high-speed computing resources are required in GWASs, neither MDR nor GMDR has been successfully applied to GWASs. In order to overcome these computational limitations, we previously proposed an efficient stepwise approach to identify GxG interactions for GWAS data [18] using cuGWAM, a graphic processing units (GPU)-based MDR program [19].
However, it still remains a challenge to have a biological interpretation of the identified GxG interactions. In order to elucidate the identified GxG interactions, we propose a network graph analysis. Our network analysis method focuses not only on the biological meaning but also on the strength of interaction.
We applied our network graph approach to Korean Association Resource (KARE) data for GxG interactions and its interpretation. We first performed GMDR analysis for BMI. Using our network graph analysis, we then identified several GxG interactions having reasonable biological interpretation from the network graph using public biological resources.
Methods
The KARE data
The KARE project, established as part of the Korean Genome Epidemiology Study (KoGES) in 2001, has started to undertake a large-scale genome-wide association analysis in Korean population-based cohort. These cohorts consist of 10,038 participants in the urban Ansan (n = 5,020) and rural Ansung (n = 5,018) communities. The objective of the KARE project is to identify genetic factors of several clinical traits and lifestyle-related diseases by GWAS, based on population-based cohorts. In this analysis, we focused on BMI, one of more than 260 lifestyle-related traits.
DNA samples were isolated from the peripheral blood of all participants and were genotyped with Affymetrix Genome-Wide Human SNP array 5.0 (Affymetrix, Rockville, MD, USA). Genotypes were called using Bayesian Robust Linear Modeling using the Mahalanobis distance (BRLMM) algorithm [20]. We performed a quality control process for the sample and genotype as previously described in Cho et al. [2]. In order to increase the coverage of common variants and capture additional association signals, we performed SNP imputation with PLINK using the Japanese/Chinese (JPT/CHB) component of HapMap as the reference. After sample and genotype quality controls, 327,872 SNPs for 8,842 individuals were available in the KARE data. We applied our proposed regularization method to Korean genome-wide data.
Network graph analysis
GMDR analysis step
GWAS datasets usually have enormous number of markers, which causes a severe computational burden. In order to deal with this computation problem, the single SNP association test with covariate adjustment is performed to all SNPs in a dataset. This step can be achieved via several toolkits that support regression analysis, such as PLINK. Filtering by specific criteria, such as p-value, is subsequently performed in order to reduce the number of SNPs.
With the selected SNPs from the single SNP association analysis, exhaustive two-way GMDR analysis is then applied. However, general toolkits supporting GMDR analysis can only handle hundreds of SNPs. Although the number of SNPs in this step can be reduced by giving more stringent criteria, it may ignore the SNPs having marginally less significant effects. In addition, a scheme to reduce overfitting, such as cross-validation, requires increased linear computation time. In order to solve this problem, faster toolkits are recommended, such as GPU-based GMDR analysis toolkits like cuGWAM [19].
Since the number of combinations in GMDR analysis is usually very large, all results of GMDR can not be stored. Thus, a criterion is needed to store the specific interactions satisfying the criterion, such as balanced accuracy (BA).
Network graph construction
Network graph is often used to visualize multiple sets of interactions. It consists of nodes and edges connecting two nodes. For simplicity of representation, we focus on two-way interactions. Since the two-way interaction is for the relationship between two variables, it can be easily represented as a graph that contains two nodes representing two variables of interaction and an edge corresponding to the interaction. According to this scheme, all interactions identified by GMDR analysis can be visualized in the network graph.
However, this scheme can cause too complex a graph structure when the number of interactions is large. Thus, it is recommended to select a certain number of possible interactions in the network graph to reduce the complexity of the network graph. Alternatively, the complexity of the network graph can be reduced by gene mapping information. Since many SNPs are placed in a gene or adjacent to a gene, it is possible to annotate multiple SNPs into a single node of a gene according to their position. However, this approach requires a delicate mapping process.
In addition, the network graph can represent the strength of the interaction by the thickness of the edge-that is, the higher the number of interactions between two nodes, the thicker the edge becomes.
Network graph analysis
It is important to derive a reasonable biological interpretation of identified GxG interactions. Here, we propose a network graph analysis step to aid the biological interpretation of the identified GxG interaction by using existing biological resources. In other words, the goal of this step is to find known biological evidence that supports the identified GxG interactions.
Resources used in this step consist of either a pair of a marker and target or two related markers, where a marker corresponds to a gene or SNP and a target represents a biologically proven target related with a marker. From a resource with marker and target information, such as HuGENet [21], miRBase [22], and is-rSNP [23], we simply assume that there is biological evidence if two SNPs within an interaction share the same biological target defined in the biological resource. For resources, such as COXPRESdb [24], having information about the correlation among genes, we assume that all correlated genes in these resources have biological interactions. Although this is a naïve assumption, the use of these resources is mainly to support the interactions identified by GMDR analysis. Note that many known biological resources have their own unique data structures that differ from each other. Consequently, the integration of multiple resources is recommended in order to provide further biological evidence for a given GxG interaction.
Results
In our GMDR analysis using KARE data, we first performed the single SNP association test via PLINK (http://pngu.mgh.harvard.edu/~purcell/plink/) using a linear regression model with covariate adjustment of age, area, and sex. We used the p-value from linear regression as a criterion of screening and used a p-value threshold of 3 × 10⁻¹ for the screening process; 101,837 SNPs were carried out after the screening process, as a result of the single SNP association test. The top 10 SNPs with the smallest p-values are listed in Table 1. The GMDR analysis was then performed using our GPU-based software, cuGWAM [19], in order to evaluate all possible two-way interactions and used a 10-fold cross-validation scheme, with covariate adjustment of age, area, and sex. An exhaustive search for two-way interactions from the selected SNPs took 19 h on the GPU system with three GTX285 graphic cards. In this step, a total of 51,853,363,660 possible two-way interaction models were evaluated.

Top 10 SNPs from linear regression analysis
In GMDR analysis, 10-fold cross-validation was used. For each cross-validation set, the top 10,000 interactions with the highest test BAs were selected, where BA is defined as the arithmetic mean of sensitivity and specificity [25]. We then calculated cross-validation consistency (CVC), which represents how many times the same two-way interaction is selected out of 10 cross-validation sets. Finally, we performed a screening step for every pair of interactions achieved from GMDR analysis that satisfied the two criteria, CVC ≥ 9 and test BA ≥ 0.5.
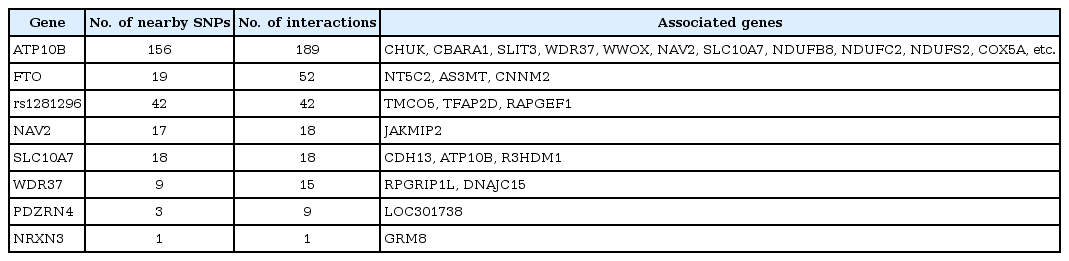
Finally, we found 524 two-way interactions under these screening criteria. Among these interactions, 127 are from genes that are known to be associated with obesity and are summarized in Table 2. Among these interactions, five genes-FTO, CBARA1, CHUK, SLIT3, and NRXN3-and 59 SNPs have been reported in previous studies [15, 16, 26-29]. Visualization of these 524 two-way interactions into a network graph was then made after annotating SNPs to the genes. We used Gephi (https://gephi.org) as a visualization tool. Gene annotation was performed according to the hg18 human genome reference and dbSNP 129. These 524 twoway interactions are displayed in the network graph (Fig. 1). Each node represents either an SNP or gene. If a SNP is annotated to a known gene, then it is denoted by the gene name. The number of interactions between nodes was represented as the thickness of the edge. For example, node FTO has a very thick edge with node NT5C2. Conversely, some nodes have a large number of nodes that are connected with it. We call these nodes hub nodes or hub SNPs. Hub nodes are represented by a gray background color.
Result of two-way interaction test
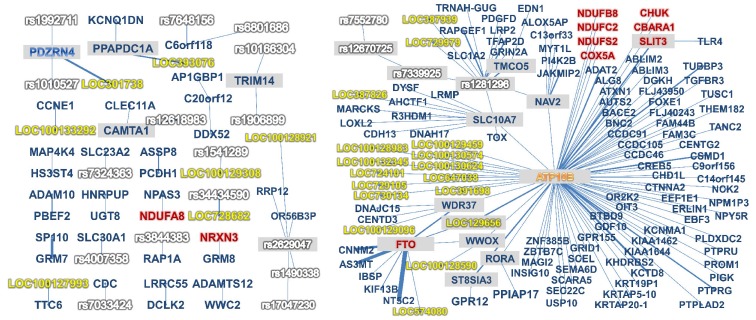
Visualized result of significant interactions that have their cross-validation consistency ≥9. Arranged for readability: gray background indicates hub node, and red, white, blue, and yellow names indicate that they are identified for their relation with obesity, single-nucleotide polymorphism, gene, and unidentified gene locus, respectively.
We investigated which SNPs that were included in the 524 two-way interactions are related with obesity using DAVID [30], a comprehensive set of functional annotation tools. As a result, we detected six genes-NDUFA8, NDUFB8, NDUFC2, NDUFS2, COX5A, and ATP6V1B2. The role of these genes in the metabolism pathway is related to oxidative phosphorylation, which plays an important role of hepatic mitochondrial function in the development of obesity [31].
Among the 524 two-way interactions, some SNPs might have weak main effects but have strong interactions with other SNPs. Table 3 shows the SNPs from hub genes that show significant two-way interactions with other SNPs but have weak marginal effects in the single SNP analysis.

Single nucleotide polymorphisms (SNPs) with weak marginal effect and strong interaction
For the network graph analysis, four public databases (HuGENet [21], COXPRESdb [24], miRBase [22], and isrSNP [23]) were collected and used to investigate the biological relationship between two SNPs with an interaction. A short summary of each database is given in Table 4. All databases used in this study were converted from the original bulk to a database table with automated script for the integrated investigation. The script for this conversion can be provided upon request.
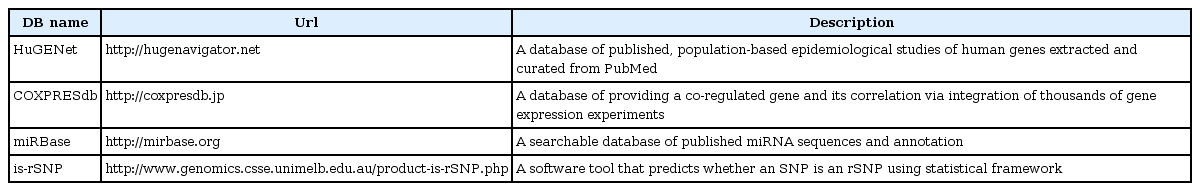
Short summary of biological knowledge used in this study
In order to improve the biological relevance of the interpretation, we excluded all interactions having linkage disequilibrium (LD) between two SNPs. One of the results of the network graph analysis is given in Fig. 2. We identified at least one line of biological evidence among 26% of the 524 GxG interactions.

A visualization of gene-gene interaction interpretation with biological knowledge. Two red circles denote two single-nucleotide polymorphisms (SNPs) within a two-way interaction, and purple circles denote corresponding genes against two SNPs. Gray circles denote diseases that are known to be related with both of the genes. Yellow and orange circles denote a disrupted transcriptional factor by both of the two SNPs and gene sets including genes from both SNPs, respectively.
In order to investigate the relationship between CVC and the rate of biological evidence, we performed an additional network analysis using 1,838 interactions (CVC ≥ 7) and found out that there was a strong relationship between CVC of the GMDR analysis and the presence of known biological evidence. As shown in Table 5, the proportion of interactions having a known biological interaction was significantly higher when CVC = 10 than when 7 ≤ CVC < 10 (39% vs. 17% on average). In addition, from the network analysis of 179 interactions having CVC = 10, 69 interactions showed biological evidence and 30 (43% of 69) shared a known relationship against BMI-related diseases, such as cardiovascular disease, body weight, hypertension.
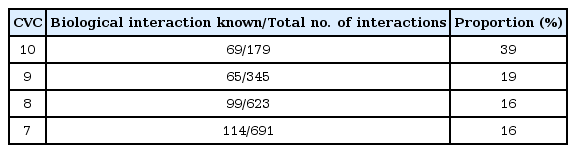
Proportion of known biological interactions by cross-validation consistency (CVC)
Discussion
The main purpose of a GWAS is to detect genetic variants represented by a single SNP or a set of SNPs that are associated with common complex polygenic traits of interest [2, 4, 5, 16, 17]. However, it is commonly known that multiple genetic factors as well as several environmental factors and their interactions are involved in causing complex diseases. Thus, the single SNP approach is not appropriate for detecting multiple genetic factors for common complex polygenic traits. Recently, many researchers have tried GxG interaction analysis in GWASs. However, they focused on rather restricted regions with a small number of SNPs due to computational complexity [32, 33].
In this paper, we have successfully performed two-way GxG interaction analysis of 8,838 individuals with the selected 101,837 SNPs, which cover most genomic regions. It became possible with the help of a GPU-based system with three GPU graphic cards. It took only 19 h to perform 51,853,363,660 possible two-way interaction analyses with 10-fold cross-validation.
Our results showed that the FTO, CBARA1, CHUK, SLIT3, and NRXN3 genes are strongly associated with obesity. In addition, our approach provided more information about possible GxG interactions. Note that some SNPs having weak main effects showed strong interactions with other SNPs (Table 3). It would have been very difficult to detect these SNPs through single SNP analysis, which demonstrates the usefulness of our approach in detecting GxG interactions.
In addition, our analysis provided some novel interactions that have not been reported in previous studies. For example, 9 SNPs from the FTO gene were found to have interactions with SNPs from CNNM2, AS3MT, and NT5C2. Similar interactions were found between LOC301738 and PDZRN4, as shown in Fig. 1.
Our network graph summarizes two-way interactions between SNPs very efficiently. We expect that this visualization tool could be helpful to researchers. It is also quite efficient to identify specific patterns and hub genes.
Through our network graph analysis, we also identified several pieces of evidence that supported the identified interactions with known biological information. From the investigation with four published databases, we found that 39% of a total of 179 interactions with CVC = 10 are known to have biological interactions from the four databases we collected. In addition, our network graph analysis showed a higher identification rate of shared biological relevance when the CVC was large than when the CVC was low, which suggests that interactions having a high value of CVC tend to share more known biological evidence that are actually related the phenotype.
In summary, our network graph analysis from GxG interaction analysis successfully identified the relationship between interactions from GMDR analysis and actual biological relevance. In addition, our strategy interpreted GxG interactions very effectively in finding known biological evidence using multiple public databases, especially in finding evidence that is actually related with the phenotype.
Acknowledgments
This work was supported by a National Research Foundation of Korea (NRF) grant, funded by the Korea government (MEST) (no. 2012R1A3A2026438).