 |
 |
- Search
| Genomics Inform > Volume 15(1); 2017 > Article |
Abstract
Understanding complex relationships among heterogeneous biological data is one of the fundamental goals in biology. In most cases, diverse biological data are stored in relational databases, such as MySQL and Oracle, which store data in multiple tables and then infer relationships by multiple-join statements. Recently, a new type of database, called the graph-based database, was developed to natively represent various kinds of complex relationships, and it is widely used among computer science communities and IT industries. Here, we demonstrate the feasibility of using a graph-based database for complex biological relationships by comparing the performance between MySQL and Neo4j, one of the most widely used graph databases. We collected various biological data (protein-protein interaction, drug-target, gene-disease, etc.) from several existing sources, removed duplicate and redundant data, and finally constructed a graph database containing 114,550 nodes and 82,674,321 relationships. When we tested the query execution performance of MySQL versus Neo4j, we found that Neo4j outperformed MySQL in all cases. While Neo4j exhibited a very fast response for various queries, MySQL exhibited latent or unfinished responses for complex queries with multiple-join statements. These results show that using graph-based databases, such as Neo4j, is an efficient way to store complex biological relationships. Moreover, querying a graph database in diverse ways has the potential to reveal novel relationships among heterogeneous biological data.
The rapid development of experimental and analytical techniques has provided various kinds of information on biological components (cell, tissue, disease, gene, protein, drug response, and pathway, etc.) and their functions. Although information on individual biological components has important meaning, biological characteristics result mainly from complex interactions among various biological components [1,2,3,4,5,6]. So, one of the fundamental aims in biology is to understand complex relationships among heterogeneous biological data that contribute to the functions of a living cell. However, finding these interactions among heterogeneous biological data is very difficult due to the complex relationships between them. For example, many disorders are caused by multiple genetic variants, which may affect pleiotropic genes, and are influenced by various environmental factors.
To overcome this hurdle, various approaches have been developed to reveal the fundamental mechanisms that control dynamic cell organization by analyzing biological networks [7,8,9]. However, for efficient biological network analyses, traditional relational database systems, such as MySQL and Oracle, may be limited, because traditional relational databases store data in multiple tables and then infer relationships by applying multiple-join statements. Although biological network data can be stored in a traditional relational database, join queries, which connect tables linked by various relationships, become too computationally expensive and complex to design as more complex join operations are performed [10].
A graph database is a database that uses a graph structure. This database uses nodes (biological entities) and edges (relationships) to represent and store data. Each node represents an entity (such as a biological entity), and each edge represents a connection or relationship between two nodes. The key concept of this system is a graph structure (organized by nodes and edges) for connections among the stored data. The graph database is more expressive and significantly simpler than traditional relational databases and other NoSQL databases and is very useful for situations with heavily interconnected data [11]. Especially, the graph database is specialized to represent all of the relationships among large-scale data and is useful for managing deeply linked data. Nowadays, graph databases are widely used in many fields, including computer science and social and technological network analyses.
In the biological community, several researchers have begun to adopt the graph database for biological network analyses. For example, Lysenko et al. [10] showed that the graph database can effectively store and represent disease networks and is a suitable structure to establish for various hypotheses. Henkel et al. [12] showed that the graph database is a useful tool for effectively storing heterogeneous data and establishing various models. Mullen et al. [13] showed that the graph database can find novel usage (that is, drug repositioning) through the traversing of various relationships between a gene and disease. Balaur et al. [14] showed that the graph database is effective in investigating correlation between genetic and epigenetic factors in genetic and epigenetic data of colon cancer.
In this work, we set up a graph database and tested its performance in storing and retrieving heterogeneous and complex biological networks. We used Neo4j (http://neo4j.com/), one of the most frequently used graph databases, and compared its performance with MySQL (https://www.mysql.com/) in diverse situations. We found that Neo4j is superior to MySQL in querying complex relationships among heterogeneous data.
Among the many graph databases available, we chose Neo4j, an open-source graph database based on Java, for our primary graph database, owing to several advantages. Its major advantages include (1) the use of a graph model of relationships for intuitive information searches; (2) stability by providing full ACID (Access, Create, Insert, Delete) transaction; (3) flexible extension above billions of nodes, relationships, and properties; (4) use of Java, which is easy to maintain and is applicable to diverse operating systems (OSs); and (5) easy-to-use API based on the REST interface and Java API [15].
We set up a high-performance computer server (80 CPUs and 1 TB RAM) for the graph database to support the storage and analysis of billions of different biological networks and relationships. Also, we optimized the server by performance tuning of the installed Neo4j (Table 1) following the Neo4j operations manual [16]. The performance tuning included the following three steps (Fig. 1).
The performance of Neo4j for a data search depends on the available memory to hold the entire graph database [17]. If less memory is used than what the constructed graph database requires, a swap between the memory and hard disk should occur, but frequent swaps between memory and hard disk inevitably slow down the search speed. Thus, large memory is needed and should also be set up for Neo4j for full usage of the system memory. The memory configuration includes three steps: (1) OS memory sizing, (2) page cache memory sizing, and (3) heap memory sizing.
The OS memory size is as follows:
OS memory = 1 GB + (Size of graph.db/index) + (Size of graph.db/schema).
Thus, we allocated 768 GB of memory to page cache memory and heap memory according to the DB file size. According to the Neo4j document:
Actual OS allocation = Available RAM − (Page cache + Heap size).
We allocated 100 GB for system memory and the rest to page cache and heap size.
Page cache is used when accessing Neo4j data stored on a hard disk. When the size of the entire data is larger than the page cache memory, a swap occurs, frequently resulting in high disk access cost and reduced performance. A basic option is to allocate 4 GB of memory based on the size of the graph DB data directory size (NEO4J_HOME/data/graph.db/neostore.\*.db). However, as our current data are larger than 10 GB, we resized the dbms.memory.pagecache.size parameter to above 200 GB.
Based on Java, Neo4j can use more memory as heap memory in a Java Virtual Machine (JVM) is increased. Because more heap memory increases the performance greatly, we allocated 300 GB of memory to heap sizing. Thus, we set the dbms.memory.heap.initial_size parameter from 8 GB to 300 GB and the dbms.memory.heap.max_size parameter from 8 GB to 300 GB.
Logical transaction logs can occur in system and data recovery after an unexpected system shutdown. They are also used for backup at online status. These transaction log files are renewed when their size exceeds a pre-defined size (default 25 MB). Because these processes also affect system performance, we optimized the parameters. The open file limit of most LINUX servers is 1,024. However, because Neo4j stores data as numerous index files, it frequently accesses many files. Thus, we changed the open file limit to 400,000.
We optimized the server through performance tuning of the installed MySQL following the MySQL operations manual. The performance tuning included the following two steps: (1) storage engine and (2) parameters of the MySQL environment.
MySQL has a variety of storage engines, each with its own characteristics. We chose InnoDB among them. MyISAM, a simple and fast feature, was a strong candidate, but MyISAM does not guarantee data integrity. In addition, table locking occurs frequently when more than 5 million data are processed in the indexed state, thereby deteriorating the retrieval performance. Although InnoDB is slightly slower than MyISAM, InnoDB guarantees data integrity by supporting transactions. InnoDB loads indexes and data into memory for retrieval processing, so allocating more memory improves performance.
Disk searching is a huge performance bottleneck. This problem becomes more apparent when the amount of data becomes too large to effectively cache it. To overcome this problem, use disks with low seek times. Table data are cached in the InnoDB buffer pool, and we optimized the innodb_buffer_pool_size parameter from default to 800 Gb (50% to 75% of system memory). To optimize the maximum size of internal in-memory temporary tables, we set the tmp_table_size and max_heap_table_size parameter from default to 64 Gb. To avoid degradation in the performance of InnoDB, use direct I/O for InnoDB-related files (innodb_flush_method = O_DIRECT). To optimize the log file I/O, we set the innodb_log_file_size parameter from default to 120 Gb (15% of innodb_b uffer_pool_size).
MySQL allocates buffers and cache to improve the performance of database operations. The default setting is designed to start the MySQL server on a virtual machine with approximately 512 MB of RAM. So, we improved the performance of MySQL by optimizing the values of certain cache- and buffer-related system variables. To optimize the size of the buffer used for index blocks, we set the key_buffer_size parameter from default to 250 Gb (25% of system memory). The table_open_cache parameter is the number of open tables for all threads. We set this parameter from default to 524,288 (maximum allowed value). The join_buffer_size and sort_buffer_size parameters were set from default to 4 Gb. The read_buffer_size, max_heap_table_size, and thread cache parameters were set from default to the maximum allowed value.
After data collection, we first classified each data into nodes (i.e., gene, protein, disease, drug, etc.) and relationships (i.e., gene-disease, disease-drug, or SNP-gene) and removed redundant and ambiguous nodes and relationships (Fig. 2). Then, we integrated and expanded all nodes and relationships (Fig. 3). Next, we created data models for each type of node and relationship (Figs. 4 and 5).
We tested how the optimization of the Neo4j system improved its performance. We compared two servers: optimized versus non-optimized servers. The non-optimized servers had default settings for OS memory and environment. The optimized server had several modified settings in (1) page cache sizing, (2) OS memory, (3) heap memory of the JVM, and (4) the number of open file limits.
We performed the same query on each server to compare the query performance of non-optimized and optimized servers. We measured the time to return results by performing a query to retrieve all data that traverse the relationships among genes, drugs, and diseases that increased the expression of the BRCA1 gene (Supplementary Fig. 1). When the two servers were queried using the same search term, the optimized server returned results in 138 ms, while the non-optimized server returned results in 316 ms for the same query (Fig. 6).
Traditionally, most biological data have been stored in relational database systems. While relational database systems are useful for hierarchical and structural storage and search of various data, they may be less well suited for the storage and search of data with heavy relationships. While relational database systems can use multiple ‘joins’ to infer relationships among different tables, multiple-join operations lead to significant execution times for a query. When we compared MySQL, one of the most famous relational database systems, with Neo4j for the same kinds of data, we found that Neo4j outperformed MySQL in all tested cases. We performed a query in MySQL and Neo4j to retrieve all data belonging to a particular gene-related path in a gene, disease, and drug relationship through a 3-layer search. For the same task, we performed a MySQL query to search for the relationship between proteins that are homologous to a particular protein in a gene, protein, drug, and pathway relationship and the various nodes that traverse that protein (Supplementary Fig. 2). When the two databases (MySQL and Neo4j) were queried using the same search term, Neo4j took 2.128 s, while MySQL took 58.325 sec for a 3-layer search. For the 4-layer search, Neo4j took 20.128 s, while MySQL was unable to return a result (Fig. 7).
The graph database provides a flexible search for complex relationships, as well as a fast search for relationships among multiple nodes. We show here two examples of using a graph database. The first is a search for the shortest paths traversing various relationships among connected nodes. For example, exploring the relationship between biological entities that are involved in two biological mechanisms can identify new potential targets for disease treatment and provide better insights into drug administration. The first example is a graph that identifies the shortest path among protein interactions or homologous proteins within three levels of the protein subsets associated with a nuclear receptor (Fig. 8A). It can be seen that the two distinct subsets of proteins belong to a common pathway.
The second example includes flexible extensions and searches of the constructed graph database. When adding a new relationship in the constructed graph database, it is possible to flexibly define and add the relationship, regardless of the structure of the existing graph database. Fig. 8B shows an example of adding a result of a new genetic analysis to the existing graph database and using it for a search. The added information can be easily defined and added without restrictions from the existing graph database structure. In this example, the added information is a node, named ‘classifier,’ which is related to the existing graph database. In contrast, the relational database system is quite inflexible in adding new types of information, because it sometimes requires the redesign of existing tables.
Most biological databases have used relational database systems for data storage, retrieval, and searches. The relational database system is a useful system for the storage of well-structured data with pre-defined columns. However, even though it is termed relational, the relational database system does not store relationships among heterogeneous data by themselves. Rather, it infers relationships among different data during a query by using the ‘join’ operation. Thus, paradoxically, the relational database system itself is not relational and is inefficient in the storage and retrieval of diverse relationships among data. As more and more biological data accumulate, it is becoming evident that the relational database system is limited in dealing with multitudes of complex networks and relationships among various kinds of biological data.
To overcome the current limits of the relational database system in dealing with complex biological networks and relationships, we employed and tested the graph database system, one of the NoSQL databases that are actively being developed to deal with various kinds of large data. We used Neo4j, one of the most actively developed, open-source graph databases with property graph models. We first optimized various parameters of a graph database server for maximum performance, as suggested by the Neo4j community, and achieved more than 40% improvement in performance. During the optimization, we found that Neo4j creates many index files for the storage of many relationships and depends heavily on system memory to read and write those index files. Thus, as the size of data increases and as more complex queries are executed, the performance of a graph database depends more on memory than the CPU. Thus, to achieve better performance from a given hardware system, the system memory should first be optimized.
When we compared the performance of Neo4j with MySQL for several queries on diverse relationships, we found that Neo4j always outperformed MySQL in terms of execution time-the more complex the relationships that were queried, the larger the difference in time between the two systems. For very complex relationships-for example, tens of millions of relationships or relationships with more than five steps (or five join operations)-MySQL was unable to finish the query. In this regard, we found that for the study of complex relationships among heterogeneous biological data, the graph database is more promising than the relational database system.
In real life, various kinds of graph databases have changed our lives in many ways. Facebook, LinkedIn, and online airplane booking service companies are examples of companies that utilize graph databases extensively. In the field of biological research, the graph database also has enough potential to find various unknown novel relationships among various heterogeneous biological data.
Acknowledgments
This work was supported by grants from the genomics (NRF-2012M3A9D1054670 and NRF-2014M3C9A3068554) programs of the National Research Foundation of Korea, which is funded by the Ministry of Science, ICT, and Future Planning and the KRIBB Research Initiative.
Supplementary materials
Supplementary data including two figures can be found with this article online at http://www.genominfo.org/src/sm/gni-15-19-s001.pdf.
Supplementary Figure 1
Cypher query to retrieve the relationships among genes, drugs, and diseases that increased the expression of the BRCA1 gene.
Supplementary Figure 2
Cypher queries and MySQL queries to compare the search speed of Graph database and MySQL database.
References
1. Hartwell LH, Hopfield JJ, Leibler S, Murray AW. From molecular to modular cell biology. Nature 1999;402(6761):Suppl. C47–C52. PMID: 10591225.


3. Koonin EV, Wolf YI, Karev GP. The structure of the protein universe and genome evolution. Nature 2002;420:218–223. PMID: 12432406.


4. Alon U. Biological networks: the tinkerer as an engineer. Science 2003;301:1866–1867. PMID: 14512615.


6. Barabási AL, Oltvai ZN. Network biology: understanding the cell's functional organization. Nat Rev Genet 2004;5:101–113. PMID: 14735121.


7. Li J, Zhao PX. Mining functional modules in heterogeneous biological networks using multiplex PageRank approach. Front Plant Sci 2016;7:903. PMID: 27446133.


8. Pavlopoulos GA, Secrier M, Moschopoulos CN, Soldatos TG, Kossida S, Aerts J, et al. Using graph theory to analyze biological networks. BioData Min 2011;4:10. PMID: 21527005.


9. Sharan R, Ideker T. Modeling cellular machinery through biological network comparison. Nat Biotechnol 2006;24:427–433. PMID: 16601728.


10. Lysenko A, Roznovăţ IA, Saqi M, Mazein A, Rawlings CJ, Auffray C. Representing and querying disease networks using graph databases. BioData Min 2016;9:23. PMID: 27462371.


12. Henkel R, Wolkenhauer O, Waltemath D. Combining computational models, semantic annotations and simulation experiments in a graph database. Database (Oxford) 2015;2015:bau130. PMID: 25754863.


13. Mullen J, Cockell SJ, Woollard P, Wipat A. An integrated data driven approach to drug repositioning using gene-disease associations. PLoS One 2016;11:e0155811. PMID: 27196054.


14. Balaur I, Saqi M, Barat A, Lysenko A, Mazein A, Rawlings CJ, et al. EpiGeNet: a graph database of interdependencies between genetic and epigenetic events in colorectal cancer. J Comput Biol 2016 9 14 [Epub]. PMID: 10.1089/cmb.2016.0095.

15. Robinson I, Webber J, Eifrem E. Graph Databases: New Opportunities for Connected Data. 2nd ed. Sebastopol: O'Reilly Media, Inc., 2015.
16. Neo Technology Inc. The Neo4j Operations Manual v3.0, Performance [Internet]. Baltimore: Neo Technology, Inc., 2016. cited 2016 Jan 10. Available from: https://neo4j.com/docs/operations-manual/current.
17. Van Bruggen R. Learning Neo4j. Birmingham: Packt Publishing Ltd., 2014.
18. Bravo À, Cases M, Queralt-Rosinach N, Sanz F, Furlong LI. A knowledge-driven approach to extract disease-related biomarkers from the literature. Biomed Res Int 2014;2014:253128. PMID: 24839601.


19. Stark C, Breitkreutz BJ, Reguly T, Boucher L, Breitkreutz A, Tyers M. BioGRID: a general repository for interaction datasets. Nucleic Acids Res 2006;34:D535–D539. PMID: 16381927.


20. Solomon BD, Nguyen AD, Bear KA, Wolfsberg TG. Clinical genomic database. Proc Natl Acad Sci U S A 2013;110:9851–9855. PMID: 23696674.


21. Gaulton A, Bellis LJ, Bento AP, Chambers J, Davies M, Hersey A, et al. ChEMBL: a large-scale bioactivity database for drug discovery. Nucleic Acids Res 2012;40:D1100–D1107. PMID: 21948594.


22. Mattingly CJ, Colby GT, Forrest JN, Boyer JL. The Comparative Toxicogenomics Database (CTD). Environ Health Perspect 2003;111:793–795. PMID: 12760826.


23. Liu CC, Tseng YT, Li W, Wu CY, Mayzus I, Rzhetsky A, et al. DiseaseConnect: a comprehensive web server for mechanism-based disease-disease connections. Nucleic Acids Res 2014;42:W137–W146. PMID: 24895436.


24. Wishart DS, Knox C, Guo AC, Shrivastava S, Hassanali M, Stothard P, et al. DrugBank: a comprehensive resource for in silico drug discovery and exploration. Nucleic Acids Res 2006;34:D668–D672. PMID: 16381955.


25. Welter D, MacArthur J, Morales J, Burdett T, Hall P, Junkins H, et al. The NHGRI GWAS Catalog, a curated resource of SNP-trait associations. Nucleic Acids Res 2014;42:D1001–D1006. PMID: 24316577.


26. Lipscomb CE. Medical Subject Headings (MeSH). Bull Med Libr Assoc 2000;88:265–266. PMID: 10928714.


27. Bult CJ, Eppig JT, Kadin JA, Richardson JE, Blake JA. Mouse Genome Database Group. The Mouse Genome Database (MGD): mouse biology and model systems. Nucleic Acids Res 2008;36:D724–D728. PMID: 18158299.


28. Chatr-aryamontri A, Ceol A, Palazzi LM, Nardelli G, Schneider MV, Castagnoli L, et al. MINT: the Molecular INTeraction database. Nucleic Acids Res 2007;35:D572–D574. PMID: 17135203.


29. Peters LB, Bahr N, Bodenreider O. Evaluating drug-drug interaction information in NDF-RT and DrugBank. J Biomed Semantics 2015;6:19. PMID: 25964850.


30. Hamosh A, Scott AF, Amberger JS, Bocchini CA, McKusick VA. Online Mendelian Inheritance in Man (OMIM), a knowl-edgebase of human genes and genetic disorders. Nucleic Acids Res 2005;33:D514–D517. PMID: 15608251.


31. Schriml LM, Arze C, Nadendla S, Chang YW, Mazaitis M, Felix V, et al. Disease Ontology: a backbone for disease semantic integration. Nucleic Acids Res 2012;40:D940–D946. PMID: 22080554.


32. Rohde DD. The Orphan Drug Act: an engine of innovation? At what cost? Food Drug Law J 2000;55:125–143. PMID: 12322720.

33. Gottlieb A, Stein GY, Ruppin E, Sharan R. PREDICT: a method for inferring novel drug indications with application to personalized medicine. Mol Syst Biol 2011;7:496. PMID: 21654673.


34. Twigger SN, Shimoyama M, Bromberg S, Kwitek AE, Jacob HJ. RGD Team. The Rat Genome Database, update 2007: easing the path from disease to data and back again. Nucleic Acids Res 2007;35:D658–D662. PMID: 17151068.


35. Krallinger M, Valencia A, Hirschman L. Linking genes to literature: text mining, information extraction, and retrieval applications for biology. Genome Biol 2008;9(Suppl 2):S8.


36. Kuhn M, Campillos M, Letunic I, Jensen LJ, Bork P. A side effect resource to capture phenotypic effects of drugs. Mol Syst Biol 2010;6:343. PMID: 20087340.


37. Chen X, Ji ZL, Chen YZ. TTD: Therapeutic Target Database. Nucleic Acids Res 2002;30:412–415. PMID: 11752352.


38. UniProt Consortium. Activities at the Universal Protein Resource (UniProt). Nucleic Acids Res 2014;42:D191–D198. PMID: 24253303.


Fig. 1
Diagram for optimization of the performance of the Neo4j graph database. Bottom layer: file open limit optimization; Neo4j often produces many small and random reads when querying data. Middle layer: page cache sizing; if all, or at least most, of the graph data files from a hard disk are cached into memory, it will reduce disk access and result in optimal performance. Top layer: heap sizing; it is beneficial to set a large heap space to support various query operations. OS, operating system; JVM, Java Virtual Machine.
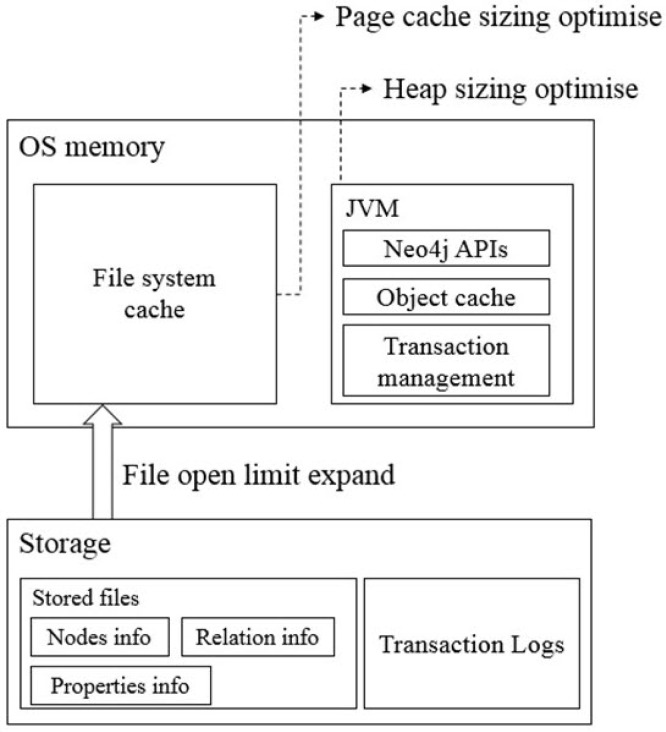
Fig. 2
Preprocessing for data structure modeling of graph database: (1) data set download using CSV or TSV format; (2) standardized representation of each node: gene, protein, disease, etc; (3) integration of node-node (e.g., gene-protein, gene-disease, drug-disease, etc.) associations from multiple data sources; and (4) filtering of unconnected and redundant entities. The final graph database contains 114,550 nodes and 82,674,321 relationships.

Fig. 3
Construction of graph model of biological relationships. Each node represents a biological element, and nodes are connected by various types of relationships. Each node can define various properties. Relationships can be defined by various types, and each relationship has various properties. This allows a detailed search through the property when retrieving nodes and relationships.
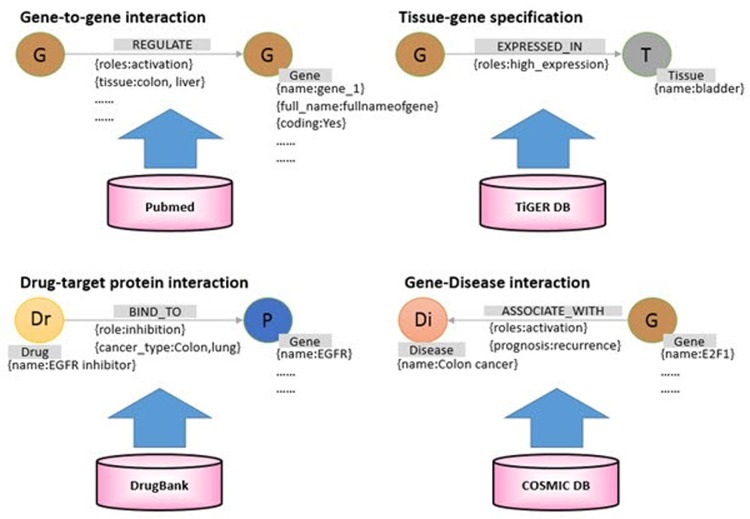
Fig. 4
Schematic of an integrated graph model, showing the node types and the relationship types used in the integrated biological dataset and how nodes interact with one another. GO, gene ontology; SNP, single nucleotide polymorphism; CNV, copy number variant.
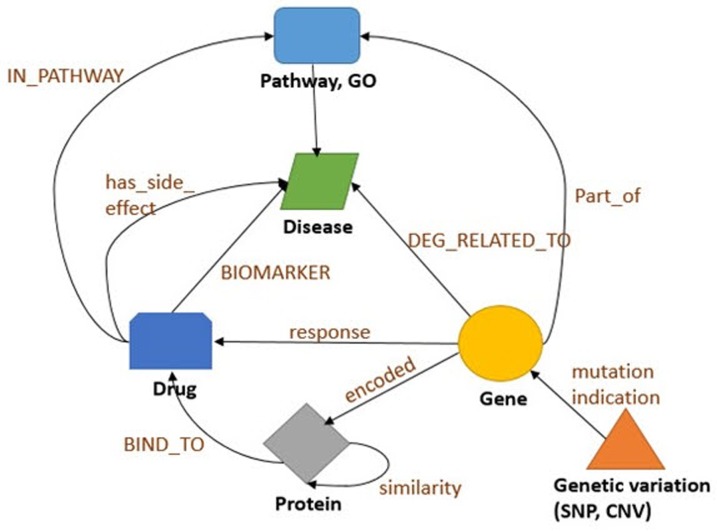
Fig. 5
Procedure for importing integrated relationship data into a graph database. ‘ DataManager.java’ defines the relationship between each raw data to be input and performs preprocessing steps, such as removing duplicates. ‘ Parsers.java’ reads raw data from a text file and stores them in the graph database. ‘ Mapping.java’ classifies nodes and relationships from the parsed raw data. ‘ Filter.java’ removes duplicate or ambiguous nodes and relationships among created nodes and relationships. ‘ BuildManager.java’ structures the filtered nodes and relationships information according to the previously defined graph database model structure. ‘ DataStructure. java’ and ‘ Integrate.java’ build a graph database by allocating nodes and relationships according to the modeled database structure.

Fig. 6
Comparison of the performance of query execution between optimized and non-optimized servers. Two servers were queried using the same search operation; the optimized server took 138 ms, whereas the non-optimized server took 316 ms.
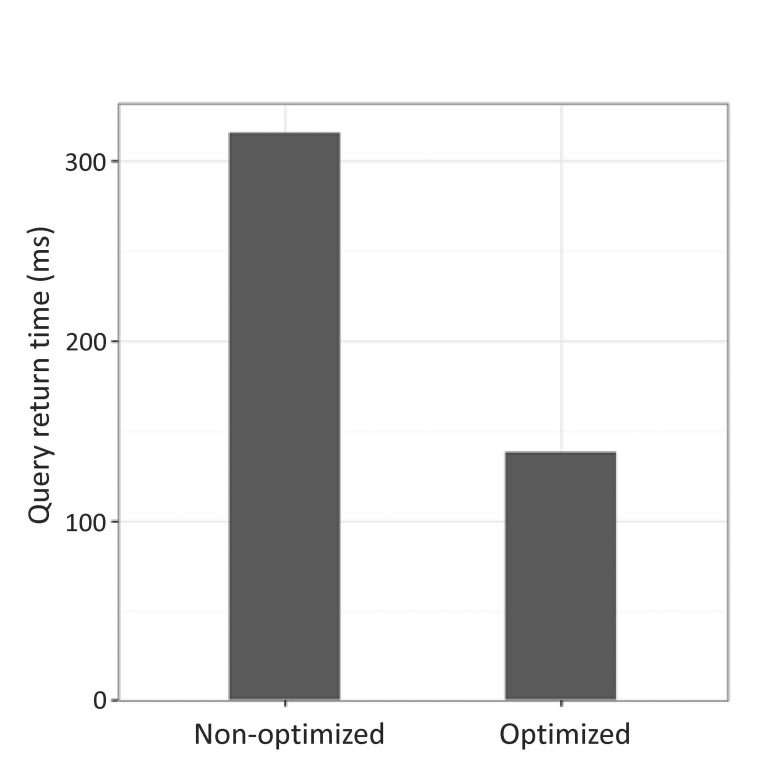
Fig. 7
Comparison of the performance of query execution between relational and graph databases. MySQL and Neo4j were compared by searching relationships on 3 and 4 layers. The search for 3 layers is a search for gene-disease-drugs associated with a particular disease. The search for 4 layers is a search for gene-protein-drugpathway associated with a particular protein.
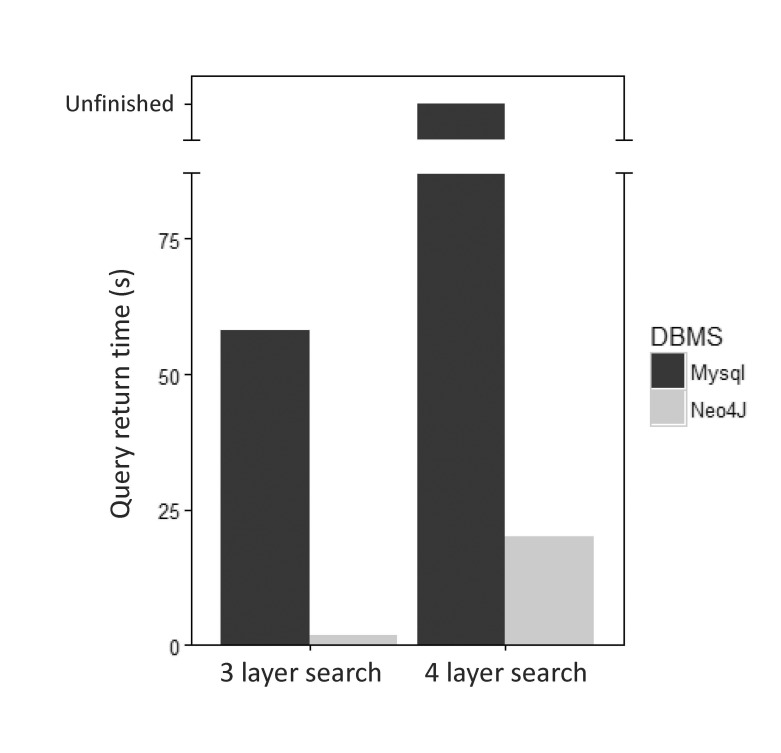
Fig. 8
Examples of using a graph database to find biologically meaningful information. Comparison of the nodes in the shortest path and the nodes in the other path (A) and flexible extension of the existing graph database with a new type of information (B).
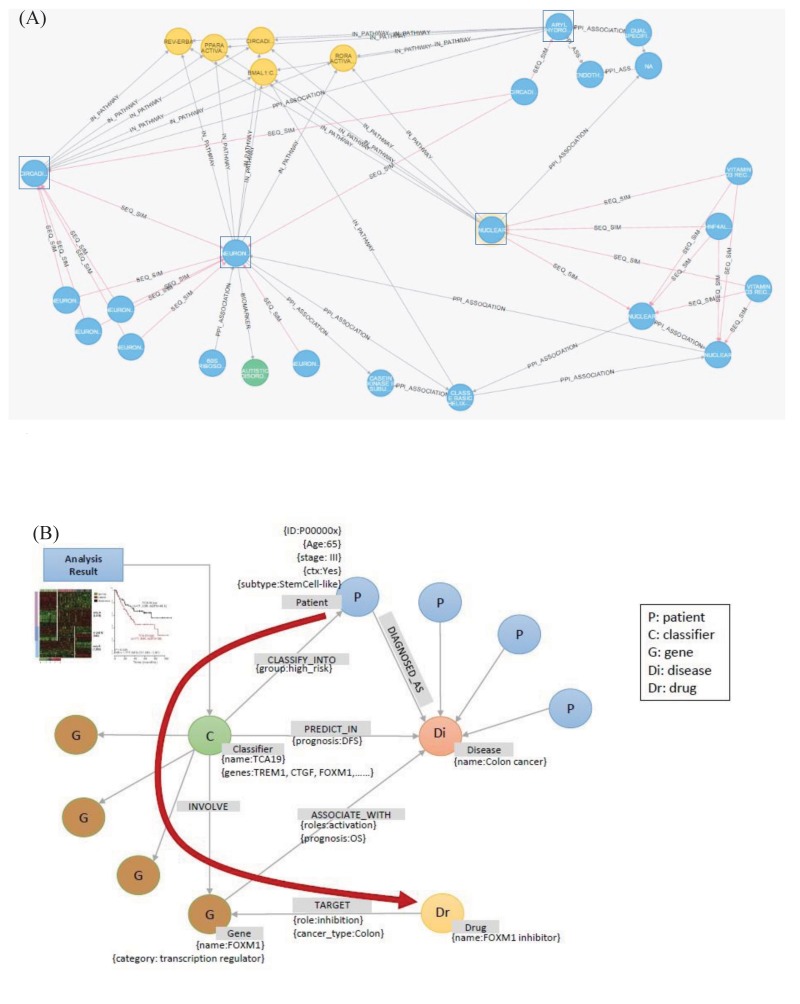
Table 1.
List of parameters for optimization [16]
Table 2.
A list of collected public databases for building graph databases
| Name | Description | URL | Reference |
|---|---|---|---|
| BeFree | Relations between genes and diseases from text and large-scale data analysis | http://ibi.imim.es/befree | [18] |
| BioGRID | An interaction repository with data compiled through comprehensive curation efforts | https://thebiogrid.org/ | [19] |
| CGD | Clinical-genomic database | https://research.nhgri.nih.gov/CGD/ | [20] |
| ChEMBL | Drug-protein interaction database | https://www.ebi.ac.uk/chembl/ | [21] |
| CTD | Comparative Toxico-Genomics Database, drug-disease, drug-gene interactions | http://ctdbase.org/ | [22] |
| Disease Connect | Disease-disease connections | http://disease-connect.org/ | [23] |
| DrugBank | Drug-protein interaction database | https://www.drugbank.ca | [24] |
| GWAS Catalogue | A curated collection of published genomewide association studies | https://www.ebi.ac.uk/gwas/ | [25] |
| MeSH | Medical Subject Headings | https://www.nlm.nih.gov/mesh | [26] |
| MGD | The Mouse Genomics Database | http://www.informatics.jax.org/ | [27] |
| MINT | The Molecular Interaction Database | http://mint.bio.uniroma2.it/ | [28] |
| NDFRT | Drug interactions | https://rxnav.nlm.nih.gov/NdfrtAPIs.html# | [29] |
| OMIM | Online Mendelian Inheritance in Man | https://www.omim.org/ | [30] |
| ORDO | Orphanet Rare Disease Ontology | http://www.orphadata.org/cgi-bin/inc/ordo_orp hanet.inc.php | [31] |
| Orphanet | Focuses primarily on rare diseases and orphan drugs | http://www.orpha.net/consor/cgi-bin/index.php | [32] |
| PREDICT | A method for inferring novel drug interactions with applications to personalized medicine | - | [33] |
| RGD | The Rat Genomics Database | http://rgd.mcw.edu/ | [34] |
| SemRep | Associations extracted directly from the literature, using text-mining approaches | https://semrep.nlm.nih.gov/ | [35] |
| SIDER | A side effect resource to capture phenotypic effects of drugs | http://sideeffects.embl.de/about/ | [36] |
| TTD | Drug target database | http://bidd.nus.edu.sg/group/cjttd/ | [37] |
| UniProtKB | Collection of functional information on proteins | http://www.uniprot.org/ | [38] |
Table 3.
A layer to distinguish the relationships among various biological data
- TOOLS
-
METRICS

-
- 45 Crossref
- 0 Scopus
- 16,775 View
- 279 Download


