Introduction
The availability of genome wide single nucleotide polymorphism (SNP) chips has made it possible to study the linkage disequilibrium (LD) patterns, effective population size (Ne), genome wide associations, etc. easily and effectively. Whole genome SNP panels are widely being used to study the genetic diversity in different livestock breeds [1,2,3]. LD and Ne form an important part in understanding the genetic diversity of any breed. Present day breeds are a result of adaptation and extensive selection for favorable traits. So, studying effective population size of breeds over several generations helps in understanding the genetic history and selection pressures that the population might have undergone in the history. Effective population size is particularly important in population and quantitative genetics and in evolutionary and conservation biology as it determines the rate at which genetic variation is lost [4].
Korean cattle are taurine type cattle available across the mainland and nearby islands. There are three main cattle breeds in Korea viz., Brown Hanwoo (BH), Brindle Hanwoo (BNH), and Jeju Black (JB). BH is the main cattle breed of Korea and has an established breeding and selection program. The number of BH runs in millions whereas the other two breeds have few thousand animals only. A close relative of BH called Yanbian (YB) also exists close to the Korea and China border [5]. So, we included the YB breed in the study as it is the unselected breed and would provide a direct comparison between the selected Korean breeds and unselected breeds. Korean cattle are known to have migrated from North China and Mongolia and from Korea to Japan. Considering this fact we conducted this study to understand the LD patterns and the effective population size of the Korean breeds along with Chinese, Mongolian (MG), and Japanese breeds. It is already known that due to various reasons about 16% of the cattle breeds are already extinct and 30% face the risk of extinction. Understanding the LD and Ne in Korean cattle population will allow the researchers to make better strategies for conservation and breeding of these cattle.
Methods
Ethics statement
No ethics statement was required for the collection of DNA samples. DNA was extracted from blood samples obtained from different veterinary practitioners across the country with the permission of the owners. The blood samples were collected for routine veterinary procedures and not explicitly for the purpose of this study.
Animals, genotyping, quality control, and LD and Ne estimation
Blood samples were collected from BH, BNH, and JB. Twenty (n = 20) animals were sampled from each Korean breed. Genotype data of Korean cattle was merged with genotype data from six other Asian breeds that included YB, Luxi (LX), Hainan (HN), Qinchuan (QC), Wagyu (WAG), and MG cattle. The data for these six Asian breeds was downloaded from dryad.org [6]. There were a total of 129 samples from the 9 Asian breeds in the study (Table 1).
Genomic DNA for genotyping assays was extracted from the blood sample using DNeasy 96 Blood and Tissue Kit (Qiagen, Valencia, CA, USA). DNA quantification was performed using a NanoDrop 1000 (Thermo Fisher Scientific Inc., Wilmington, DE, USA). DNA samples were submitted for genotyping with total DNA of 900 ng, 260/280 ratio >1.8, and DNA concentration of 20 ng/µL. The genotyping for animals was done by the Animal Genome & Bioinformatics Division of the National Institute of Animal Science, Rural Development Administration (RDA), Korea, using a Bovine-SNP50 BeadChip ver. 1 (Illumina, San Diego, CA, USA).
Plink ver. 1.07 (http://pngu.mgh.harvard.edu/~purcell/plink/) [7] was used for the quality control of the raw genotype data. Quality control was performed for minor allele frequency, missingness, Hardy-Weinberg equilibrium (HWE), and genotyping quality. Beagle program [8] was used for imputation of the missing genotypes. Five thousand sixty-seven markers were excluded based on HWE test (p ≤ 0.0001) and further 1,825 SNPs were excluded based on frequency test (minor allele frequency < 0.01). Final dataset consisted of a total of 28,708 SNPs. A total of 129 samples were analyzed in the study. SNeP program [9] was used to calculate pairwise LD and Ne. LD based Ne was calculated according to Sved [10] as below, where r2 is the LD, c is the recombination rate and Ne is the effective population size.
Results and Discussion
In the present study, we observed a clear separation of Korean cattle breeds from other breeds. Based on WC84 genetic distances, Korean breeds were found to be closer to YB and WAG cattle breeds (Supplementary Fig. 1). Among all the breeds in the study, heterozygosity (Hs) was highest in YB (0.44) and lowest in HN (0.16). Amongst the Korean cattle BH (0.40) had the highest heterozygosity compared to JB (0.39) and BNH (0.38). The difference in heterozygosity amongst the Korean breeds was very small which suggests the genetic closeness of these populations. The heterozygosity in our study was higher than that reported by Strucken et al. [13] which could be because of different SNPs used in the final dataset.
Population differentiation and structure were studied using Fst and PCA. Highest Fst values were seen for HN which is azebu cattle from China. The lowest Fst value was observed for YB followed by the Korean breeds BH, BNH, and JB (Supplementary Fig. 2). Low Fst values in Korean populations suggest lack of population differentiation. This also suggests that these breeds could be interbreeding freely in the past. In PCA, WAG formed a separate cluster while Korean cattle still formed a close cluster along with YB (Supplementary Fig. 3). Both Fst based analysis and PCA showed that Korean breeds have yet not differentiated enough from one another.
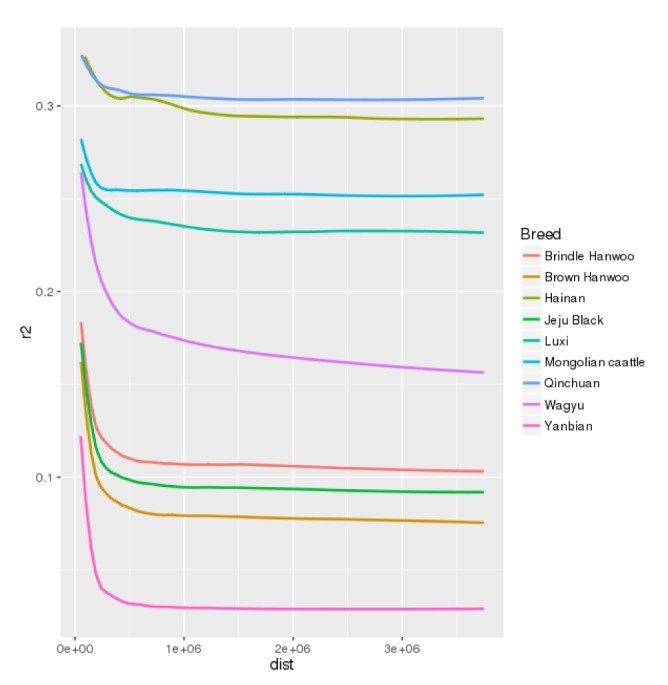
LD patterns in the 9 Asian cattle breeds were compared as it could help us understand the forces that structured the present day populations and will also reflect the past evolutionary and demographic events. LD across the genome gives an insight into the population history, the breeding system and the pattern of geographic subdivision [14]. In our study, the average distance between SNP pairs was 1.14 Mb across all breeds. The LD decreased with increasing physical distance between the markers (Fig. 1). Estimates of LD based on average r2 values varied from 0.1 for YB to 0.31 for QC (Table 1). Lowest level of LD in YB could be because it didn't undergo any artificial selection. Other cattle breeds in the study undergo moderate to intensive selection regimes. Among the Korean breeds, BH (0.1) had the lowest value of LD while BNH had the highest LD value of 0.13. BH is the only Korean breed that has a dedicated breeding and selection program which could be the reason for low LD in this breed. Twenty BH Korea proven bulls (called KPN) are used throughout the country for artificial insemination of cows, thus leading to low LD. Similar pattern was observed by Edea et al. [15] in Korean cattle. Average LD in Japanese cattle, WAG, for all SNP pairs was found to be 0.31 which was less than the Chinese (with an exception of YB) and MG cattle but more than the Korean cattle breeds. WAG, which is a premium beef breed of Japan, has been maintained as a closed breed since ~100 years which could be one of the reasons for higher LD. LX, HN, QC and also MG breeds had higher LD than the other breeds which indicate their long history of domestication. The improvement of MG cattle began in 1949 by crossbreeding with shorthorn cattle (http://www.thecattlesite.com/breeds/beef/28/mong olian/). In contrast to Chinese and MG cattle, a dedicated breeding program for Korean cattle was started only in 1979 [16].
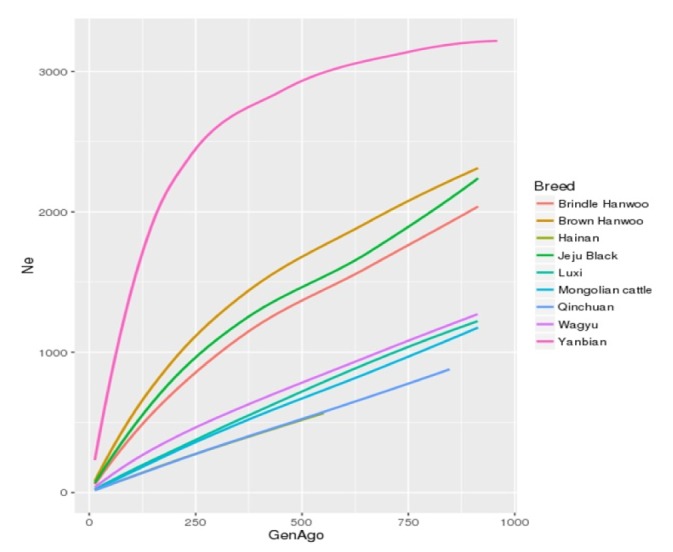
Effective population size is strongly associated with genetic variability and adaptation. So to better understand the size and structure of these cattle populations, effective population size was calculated using the LD estimates (r2). All the cattle populations showed a declining trend in their effective population size (Fig. 2). Amongst all the breeds under study YB had the highest Ne = 226 until 13 generations ago while Chinese HN and QC had the lowest Ne of 16. According to a Food and Agriculture Organization of the United Nations (FAO) report (ftp://ftp.fao.org/docrep/fao/012/v6950t/v6950t02.pdf), HN cattle of china which is of indicine origin is categorized as an endangered breed and the total number of animals in the Hainan island has dropped considerably owing to economic reasons and lack of an organized effort. HN and QC were followed by MG, LX, and WAG in which Ne was 20, 23 and 37, respectively. Among the Korean cattle BNH had the smallest Ne = 59 until 13 generations ago and JB and BH had a Ne of 67 and 83 respectively. This is however considerably less than that reported by Lee et al. [17] and Li and Kim [18]. Lee et al. [17] reported Ne in BH to be 352 until 10 generations ago whereas Li and Kim [18] reported Ne to be 630 around 11 generations ago. Dang et al. [19] estimated Ne to be 47, 5 years ago from 2011. The trend of LD and Ne is the same as reported by Li and Kim [18] and Lee et al. [17] however the difference in estimated number could be attributed to number of samples used in the study and SNP quality control measures. The results might also differ because of the model used to study LD and Ne. In our study sample size was the limiting factor. Increase in sample size will further validate the results of the study.
The pattern of LD and Ne is considerably affected by the past historic events of the population. In this study we observed a sharp decline in the effective population size of all the cattle breeds. We observed a consistent decline in the size of cattle populations throughout all the generations however a sharp plunge in effective population size was observed at ~50–100 generations ago. This was the time of formation of the current breeds. Further decline in Ne was observed at ~50 generations ago in Korean cattle. This was the time when selection and development of breeding programs had just begun. The modern day cattle genetic structure, LD and Ne is a result of the various historic events and extensive artificial and natural selection.
In our study we found a steep decline in the effective population size of cattle populations. Effective population size has been decreasing at an alarmingly high rate in Korean cattle population especially BNH and JB. We suggest strict actions and strategies to be adopted to increase the effective population size while maintaining the genetic diversity of the breeds.