Genetic Association Analysis of Fasting and 1- and 2-Hour Glucose Tolerance Test Data Using a Generalized Index of Dissimilarity Measure for the Korean Population
Article information
Abstract
Glucose tolerance tests have been devised to determine the speed of blood glucose clearance. Diabetes is often tested with the standard oral glucose tolerance test (OGTT), along with fasting glucose level. However, no single test may be sufficient for the diagnosis, and the World Health Organization (WHO)/International Diabetes Federation (IDF) has suggested composite criteria. Accordingly, a single multi-class trait was constructed with three of the fasting phenotypes and 1- and 2-hour OGTT phenotypes from the Korean Association Resource (KARE) project, and the genetic association was investigated. All of the 18 possible combinations made out of the 3 sets of classification for the individual phenotypes were taken into our analysis. These were possible due to a method that was recently developed by us for estimating genomic associations using a generalized index of dissimilarity. Eight single-nucleotide polymorphisms (SNPs) that were found to have the strongest main effect are reported with the corresponding genes. Four of them conform to previous reports, located in the CDKAL1 gene, while the other 4 SNPs are new findings. Two-order interacting SNP pairs of are also presented. One pair (rs2328549 and rs6486740) has a prominent association, where the two single-nucleotide polymorphism locations are CDKAL1 and GLT1D1. The latter has not been found to have a strong main effect. New findings may result from the proper construction and analysis of a composite trait.
Introduction
Genome-wide association studies have been aiming to find the association between a single-nucleotide polymorphism (SNP) and complex traits. It started as a single-locus approach that tested a single SNP at a time and selected the top SNPs. However, it has become clearer that most complex diseases are associated with multiple genes and their interactions. Therefore, a multi-locus approach is now regarded as a necessity [12]. Multifactor dimensionality reduction is one of the widely accepted methods for addressing this issue [3]. Meanwhile, it has been customary to categorize a phenotype into a binary trait to divide the observed outcomes into either a case or control (affected-unaffected). However, some diseases, such as obesity, are to be classified with several levels of affectedness [4]. In that case, it would be appropriate to perform a multi-class phenotype analysis. A disease, such as hypertension, may not be fully characterized by a single phenotype but by 2 or more observed phenotypes [5]. Then, a composite phenotype should be constructed and analyzed with genomic data to estimate the genome-wide association of the particular disease. Because the individual observables should have 2 or more classes, a composite phenotype would be a multi-class trait, with an indefinite number of classes. Combining the 2 aspects above, a genomic association study needs a method that is able to take gene-gene interactions and multi-class and multivariate traits into consideration simultaneously.
In this paper, we will apply a recently introduced generalized index of dissimilarity (GIDS) [5] to demonstrate a multivariate multi-class trait genomic association study with diabetes. A composite phenotype with the complete set of classes, which was constructed with 3 individual phenotypes obtained by measuring the blood glucose levels using different protocols [67], was analyzed with genomic data to estimate the genome-wide association. Gene-gene interactions and the main effect were investigated. Among the strongly associated SNPs, some were found to be consistent with previous results, while the rest of them were new findings. SNP pairs that were found to have a strong association are also presented.
Methods
Index of dissimilarity as a measure of association
Introduced originally as a segregation measure [8], the index of dissimilarity (IDS) has been shown to be effective in measuring genomic associations, as well [5]. A generalized version of the IDS (GIDS) has been reported to be able to yield the association strength with a phenotype having an arbitrary number of classes [5]. Fig. 1 has the schematics for the association of 2-order gene-gene interactions with a J-class phenotype. GIDS is defined as below following the notation in Fig. 1.
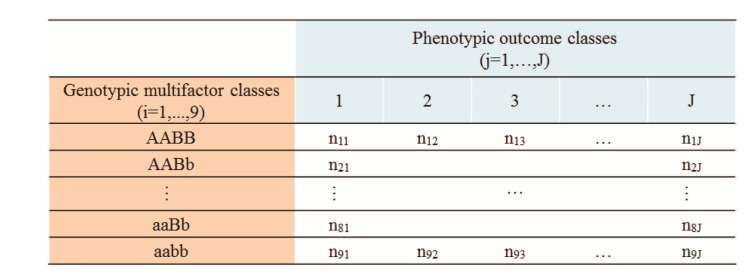
Schematics for the 2-order genegene interaction and multi-class phenotype. The number of samples, nij, for a genotypic class i and phenotypic class j. When J = 2, it represents the common binary, or case-control trait.
 (1)
(1)Indices i and j represent the ith multi-locus genotype and the jth multi-class phenotype, respectively. The numerator of this equation measures the extent of uneven distributions by each phenotype class, where the denominator indicates the maximum possible unevenness [8]. To visualize this concept, let us reduce GIDS to a binary—i.e., J = 2, class—as shown in Eq. (2).
 (2)
(2)When there is little association between the genotype and phenotype, there would be a minimal difference between the 2 fractional terms for each i. Maximum association occurs when the differences for each i in this equation add up to the maximum.
Estimation of the association strength
To estimate the association strength, GIDS is calculated using Eq. (1). The number of samples, nij, that goe into the formula for GIDS is counted using a 2-way contingency table, constructed for the k-locus interactive genotype and J-class phenotype, as diagrammed in Fig. 1. The number of elements of this table will be 3k × J. GIDS would be calculated exhaustively for every SNP or combination of SNPs associated with a multi-class categorical phenotype. Any order of a gene-gene interaction associated with a phenotype of an arbitrary number of categories can be estimated in theory, limited only by computing time. GIDS spans from 0 to 1, representing null and maximum association at either of the extremes. p-values that account for multiple comparisons can be obtained by constructing a null distribution common to all of the GIDS values [9]. Permutation of the dataset is performed to provide a non-associated dataset. A single GIDS that has the maximum value among all GIDS values obtained with a permuted dataset is collected. Repeated permutation and collection make the null distribution of GIDS. Now, a p-value should be the probability that the null distribution exceeds a particular GIDS value. Using this null distribution, GIDS can be standardized as follows, where  and SGIDS represent the mean and standard deviation of the null distribution, respectively.
 (3)
(3)Association strengths from different orders of gene-gene interactions may be compared using the standardized GIDS (sGIDS), defined above [10].
Analysis
Construction of multi-class phenotype
Among the procedures to measure blood glucose levels, fasting and the oral glucose tolerance test (OGTT) are commonly conducted [1112]. Standard time intervals between the intake and measurement are 1 h and 2 h, denoted as OGTT-1h and OGTT-2h [7]. Diagnostic criteria are recommended as a combination of the measurements [6]. Listed in Table 1, the diagnosis is determined by considering fasting and OGTT-2h simultaneously [7]. Each of them was categorized into 3 distinct ranges, resulting in 9 composite ranges, which gave the criteria for the 4 diagnostic categories. Genomic data from the Korean Association Resource (KARE) project [13] were analyzed with the phenotypes of fasting and OGTT-2h and -1h. With the number of valid samples (n = 8371), the proportions that fell into each of the 9 composite categories are shown in the fourth column of Table 1. Note that neither of fasting and OGTT-2h can determine the diagnostic result independently of each other. An additional diagnostic criterion may be given by OGTT-1h [7]. The last column of Table 1 shows the percentage of the samples that were found to be normal in OGTT-1h within each of the 9 composite categories. A need for additional categorization seems to be apparent, because most of the percentages are away from 0% or 100%. To make such a multi-class phenotype, 3 of the individual KARE phenotypes—fasting, OGTT-2h, and OGTT-1h—were first categorized into 3 classes for the first 2 phenotypes and into 2 classes for the third one, following the reference criteria [67]. A single composite phenotype of 3×3×2 classes was constructed as such. The resulting 18-class composite phenotype was analysed with the genotype part using GIDS to identify the most associated single- and two-locus models.

Single- and two-locus models
All of the available 327,872 SNPs in the KARE dataset were thoroughly examined for the association with the multi-class phenotype constructed above. Ranked by the sGIDS, the top 50 SNPs are plotted in Fig. 2, representing the main effects. Prominent SNPs may be seen in groups of 2, 2, and 4 showing the strongest association strengths. Those SNPs are listed in Table 2 with detailed information.
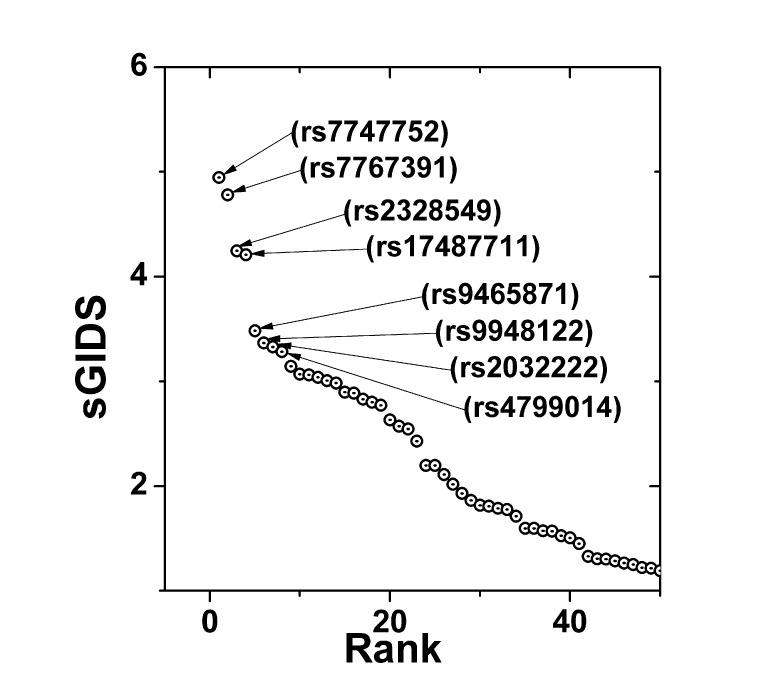
Most strongly associated single-nucleotide polymorphisms identified by sGIDS. sGIDS reveals strongly associated single loci with fasting, OGTT-1h, and OGTT-2h blood glucose values categorized as a single multi-class phenotype. sGIDS, standardized generalized index of dissimilarity; OGTT-1h, 1-hour oral glucose tolerance test; OGTT-2h, 2-hour oral glucose tolerance test.
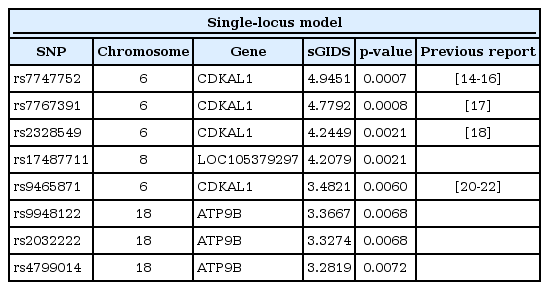
Top associated SNPs by sGIDS in the single-locus model
Using the calculations for the single-locus model, 1,000 SNPs were selected by sorting them with their respective GIDS values. Then, all of the possible pairs of those candidate SNPs were examined for their association strengths by evaluating sGIDS. The 50 most strongly associated pairs are plotted in Fig. 3, 5 of which are identified with their rs numbers.
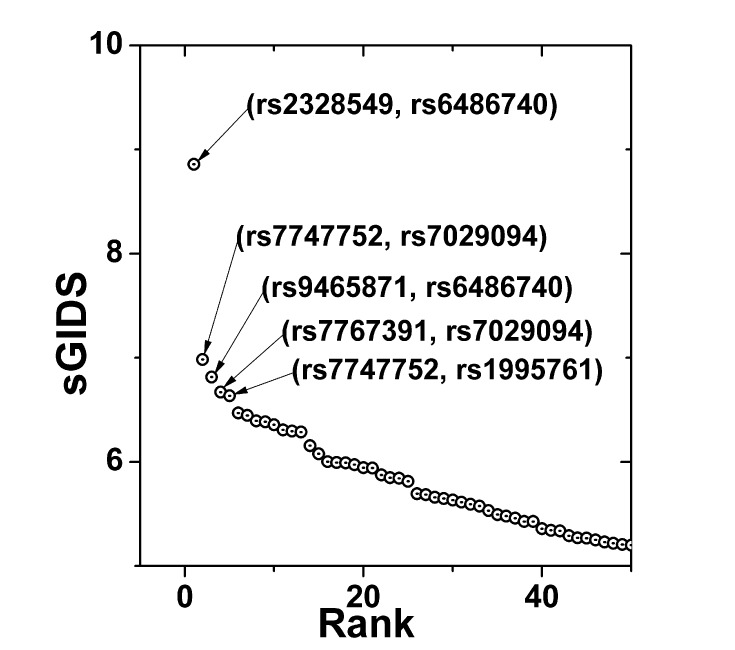
Most strongly associated single-nucleotide polymorphism pairs identified by sGIDS. sGIDS reveals strongly associated 2-order interactions between 2 loci with fasting, OGTT-1h, and OGTT-2h blood glucose values categorized as a single multi-class phenotype. sGIDS, standardized generalized index of dissimilarity; OGTT-1h, 1-hour oral glucose tolerance test; OGTT-2h, 2-hour oral glucose tolerance test.
Results
Two SNPs, rs7747752 and rs7767391, were found to have the strongest association. They are located in an intron of the cyclin-dependent-like kinase 5 (CDK5) regulatory subunit associated protein 1-like 1 (CDKAL1) gene located in chromosome 6. This gene has been reported to make contributions to type II diabetes. Both of the SNPs identified in this paper have been also reported to have susceptibility to type II diabetes [14151617]. Note that among the second-tier SNPs—rs2328549 and rs17487711—only the first one is in the intron of CDKAL1 [18]. rs17487711 has been newly identified to have strong association comparable with that of rs2328549, while it is located in the intron of LOC-105379297 in chromosome 8. The National Center for Biotechnology Information (NCBI) still describes this gene as uncharacterized. In Table 2, 3 out of 4 among third-tier SNPS have been listed to be in the intron of ATPase, class II, type 9B (ATP9B) located in chromosome 18 [19], whereas rs9465871 can be found in the intron of CDKAL1 [202122].
A single prominent pair (rs2328549, rs6486740) revealed itself. In Table 3, detailed information is provided for the top 5 pairs. One of the SNPs in the pair that showed the strongest association, rs6486740, is located in an intron of the glycosyltransferase 1 domain-containing 1 (GLT1D1) gene on chromosome 12, while the other SNP, rs2328549, is located in an intron of CDKAL1, which was mentioned in the previous subsection. GLT1D1 was reported to be related with renal sinus fat [23] and the transfers of glycosyl groups [24]. Among the second-tier SNP pairs, rs7029094 and rs1995761 are located on chromosome 9, but there exists little information about the gene in which they are located.

Top associated interacting SNP pairs by sGIDS in the 2-locus model
Discussion
A composite trait of 18 classes, constructed with 3 observables, each of which had 3 or 2 classes, was analyzed with genomic data to estimate the genome-wide association. Gene-gene interactions, as well as the main effect, were investigated. It may be essential to take a multi-class composite phenotype into consideration when performing a genomic association study for the susceptibility to a more complex disease, such as diabetes, as presented in this paper. OGTT-2h alone has 3 categories that exceed the commonly used dichotomous classes. However, the intrinsic need of a composite phenotype comes from the fact that diabetes may not be fully diagnosed with a single observable. If a disease may be diagnosed by multiple variables, it would be logical to analyze the susceptibility to it with multiple observables concurrently. A composite phenotype can be expected to have many classes, and the number of them could grow rapidly as the number of required variables increases. Therefore, it would be essential to have a methodology capable of analyzing the genomic association with a phenotype having an indefinite number of classes. GIDS has been demonstrated, in this paper, as a reliable candidate for this purpose. It showed consistency by identifying strongly associated SNPs, in chromosome 6, agreeing with previously reported ones in a single-locus model. The CDKAL1 gene, in which they are located, has been found to be responsible for the SNPs that cause the susceptibility to type II diabetes. Moreover, we found new SNPs that have not been reported to have a strong association. They were found in chromosomes 8 and 18. The gene-gene interaction result detected a single prominent SNP pair that was noticeably stronger than others. Although 1 of the 2 SNPs in that pair, rs6486740 in the GLT1D1 gene, was not found to have a strong main effect, it showed a very strong association when it interacted with the counterpart SNP, rs2328549.
In summary, we have confirmed previous results and at the same time found new strong genomic associations in both single- and 2-locus models by applying GIDS to a composite trait with 18 classes.
Acknowledgments
This research was supported by the Basic Science Research Program through the National Research Foundation of Korea (NRF), funded by the Ministry of Education, Science and Technology (NRF-2013R1A1A2062848). It was also supported by the Bio & Medical Technology Development Program of the NRF funded by the Korean government, MSIP (No. 2016M3A9B694241).