Introduction
The advances in genomics technologies and other molecular research, together with recent developments in information technologies, have generated a great quantity of data in the molecular biology domain [1]. For example, GenBank, as a comprehensive and well-known database of National Center for Biotechnology Information (NCBI, http://www.ncbi.nlm.nih.gov) online resources, holds nucleotide sequences for more than 280,000 species that are available to the public [2]. Another example of large biological datasets is the 2013 edition of the annual Nucleic Acids Research database issue, which currently lists 1,512 databases, organized into 14 categories and 41 subcategories, available at http://www.oxfordjournals.org/nar/database/a/ [3].
Among organisms, rumen microbes have not been an exception to these debates. But, much less attention has been paid to integrate and manage the genomic data related to these microorganisms. Molecular research on ruminal microbes has gained attention as more genomic sequences and related genomic data are becoming available to scientific communities. The primary focus of this study was to develop an application that allows users to interactively manage the genome-annotated data of rumen microbial consortia. The rumen environment is the main part of the digestive system and consists of a complex microbial community that makes the rumen microbial ecosystem [4]. This ecosystem is a natural habitat that houses a wide spectrum of bacteria, protozoa, anaerobic fungi, and bacteriophages [5]. By having a symbiotic mutualistic relationship with ruminants, the microbes are capable of converting feed components into a source of energy for the animals (i.e., volatile fatty acids). Ruminants are able to utilize a variety of feeds owing to an extremely diversified rumen microbial ecosystem [4]. According to previous molecular studies, it has been reported that the population of rumen bacteria accounts for at least 300 to 400 phylotypes [6,7,8].
There is no doubt that progress in biological research could not be achieved without equivalent efforts in informatics research. Since data management and analysis are facing new challenges in parallel with the age of big data, many research activities have been conducted for handling the biological data. There are several special issues that reflect the ever increasing importance of data management approaches in biology [9,10,11,12,13].
Geographic information system (GIS) is a computer-based system designed for displaying, storing, manipulating, and analyzing geographical data [14]. As an analytical system, GIS can serve biological systems by establishing biological databases, with the use of powerful representation and display tools, as well as providing query and analysis tools. An example of a GIS query is finding all hospitals that are equipped with an advanced technology, located in the city center, and with more than 500 beds. A number of GIS-based approaches have been used to handle biological information. A typical example in the biology domain is discussed by Kozak et al. [15], in which they applied GIS technologies and concepts for evolutionary biology. Their study uses the GIS to track macroevolutionary changes among species and the evolutionary process of geographic variation within species. In previous studies of GIS applications in genomics, a major effort was made by Dolan et al. [16]. They presented a GIS application, called Genome Spatial Information System (GenoSIS), to manage and represent genomic information.
Ontology is about terminology (domain vocabulary), all essential concepts in a domain, their classification, taxonomy, relations (including all important hierarchies and constraints), and domain axioms [17]. It represents the particular meanings of concepts by specifying the concepts and their relationships. The use of ontology enables one to structure biological data (genome/gene data) in a machine-understandable form by defining biological concepts, relationships, and instances in a semantic structure.
This paper presents an integrated GIS-ontology application for the management of microbial genome data. The main rationale behind integrating GIS and ontology is that these two distinct areas of research can complement each other for biological applications. While the GIS is commonly recognized as a powerful and integrated tool with unique capabilities for storing, manipulating, analyzing, and visualizing geographical information, ontology provides a rich collection of procedures and algorithms to meaningfully share and exchange data. Our application is implemented by using ArcGIS and Protégé to couple GIS-based biological applications with ontology. The genome-annotated data of rumen microbial flora were adopted to evaluate the performance of the application. The system can be extended and employed for handling other types of genomic data.
Methods
More specifically, this study adopts the functionality of linear referencing (LR) for representing genome-annotated data in a GIS environment. Our application uses ontology to semantically organize and reason the data in a semantic and machine-understandable framework. In this application, we defined a measurement unit for genomes, so that one meter was assigned per nucleotide. The users have the flexibility to interact with the genome as a layer or with different genomes as a collection of layers. The ArcGIS platform of the application supports users with interactive genomic maps and implementation of special queries.
Linear referencing
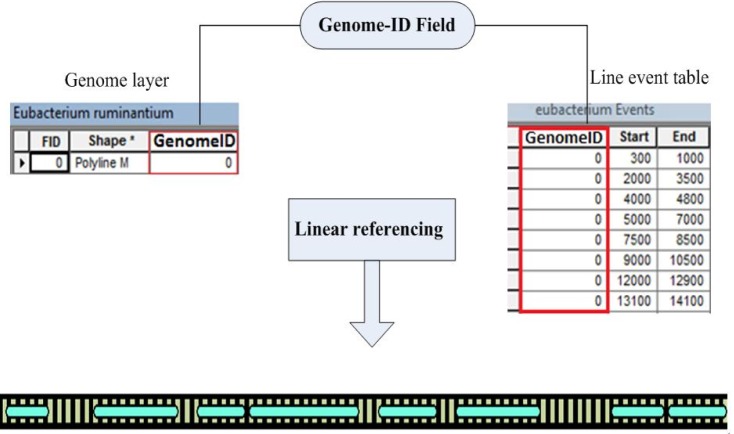
LR is one of the GIS tools representing geographic locations of linear events based on relative positions on linear features [18], where the beginning and end of the events are recorded as measurement values in event tables. Using LR, attributes are linearly referenced and linked dynamically to layers (e.g., the genome). This technique can be effectively used to represent genomes and genes as layers and linear events, respectively. By applying this technique, the genomic data initially stored in event tables can be visualized, displayed, queried, and analyzed on the genome network. The LR method provides flexibility to split a linear genome into new sets of gene segments (i.e., line events), without having to draw a new line layer for gene events. As presented in Fig. 1, the LR process includes the fields of location and attribute(s) associated with gene events. As shown, the line gene events are related to the genome layers through the values of the field "Genome-ID." The location of line events (genes) on a given genome layer is indicated in the fields "Start" and "End." In other words, a line event uses both "Start" and "End" measure values to describe a portion (i.e., a gene) of a genome.
Ontology
From a computer science perspective, ontology is defined as the structure representing a shared, formal, and explicit specification of knowledge in a particular domain (e.g., biology). Hendler [19] describes ontology as a set of knowledge terms, containing the terminology (domain vocabulary), all essential concepts in the domain, the semantic interconnections, and simple rules of logic and inference for some particular topics. A typical example of an ontology approach in biology is using standard concepts to classify microorganisms. There are a large number of identified microbes in nature, so that this amount has long stimulated interest to establish an anthological classification for them. Gene Ontology (GO) is another example of an ontology application in biology. GO is intended to formulize biological knowledge in orthogonal hierarchies [20]. It includes controlled vocabularies that are described for gene products with respect to their biological processes, cellular components, and molecular functions [21]. Ontology specification languages are knowledge representation languages used to encode ontologies in a formal (machine-readable and -processable) and standard format. The most common and popular ontology language is OWL from the World Wide Web Consortium (W3C). OWL concepts/classes (e.g., genome, gene, etc.) are created using formal specifications that an individual object/instance (e.g., genome and gene instances) needs to satisfy to belong to a particular class. The individuals that share similar characteristics would be members of the same concept.
Implementation
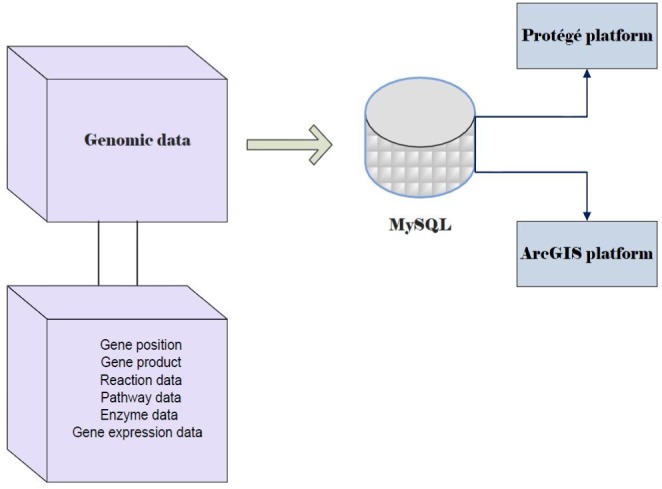
As depicted in Fig. 2, the ontology-based GIS application was implemented using a combination of the two platforms of ArcGIS [22] and Protégé [23] and MySQL as a database management system. ArcGIS is a commercial software package containing a set of integrated applications, such as ArcMap and ArcCatalog. ArcMap is the main mapping application allowing users to generate maps, query attributes, analyze spatial relationships, and lay out final projects. The ArcCatalog application allows users to manage geographic data [24].
Several programs have been developed to edit and view ontologies, such as Ontolingua and Protégé. Both Ontolingua and Protégé are capable of generating a separate frame for every knowledge item that covers the information, such as definitions, links, and relationships [20]. In the proposed application, we applied the Protégé software as an ontology-developing environment. Protégé is a free and open-source platform that provides a set of tools for constructing domain ontologies and knowledge-based applications. We constructed the rumen microbial genome ontology to organize genome-related data, including classes (e.g., microbial genomes found in rumen and their associated genes) and their relationships/properties (e.g., gene name, product, catalyzed reaction, and accession number of a gene). In order to implement the system, we applied the genome-annotated data of several ruminal microbes deposited in NCBI.
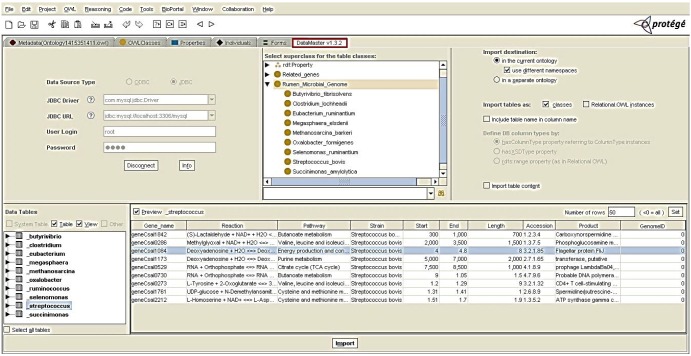
In the first phase of implementation, the genome-annotated data were stored in a MySQL database using Navicat software (Fig. 3). Navicat, as a powerful solution for MySQL administration, offers a graphical interface for managing databases (http://navicat.com/). The second phase involved the connection of the database to both ArcGIS and Protégé as the GIS engine and ontology platform, respectively. The database was connected to the ArcCatalog application of ArcGIS. The genome layers were created as shapefiles via ArcCatalog and displayed in an ArcMap environment (Fig. 4). As shown in Fig. 5, the DataMaster plugin of Protégé was integrated with a MySQL database through a JDBC driver. DataMaster is a plugin for Protégé editor that allows the conversion of a relational database into an RDF model (resource descriptive framework) that can be processed and understood by machines [25]. After integrating DataMaster with the MySQL database, each of the tables from the database was imported into Protégé as an OWL class, along with its instances and properties.
Results
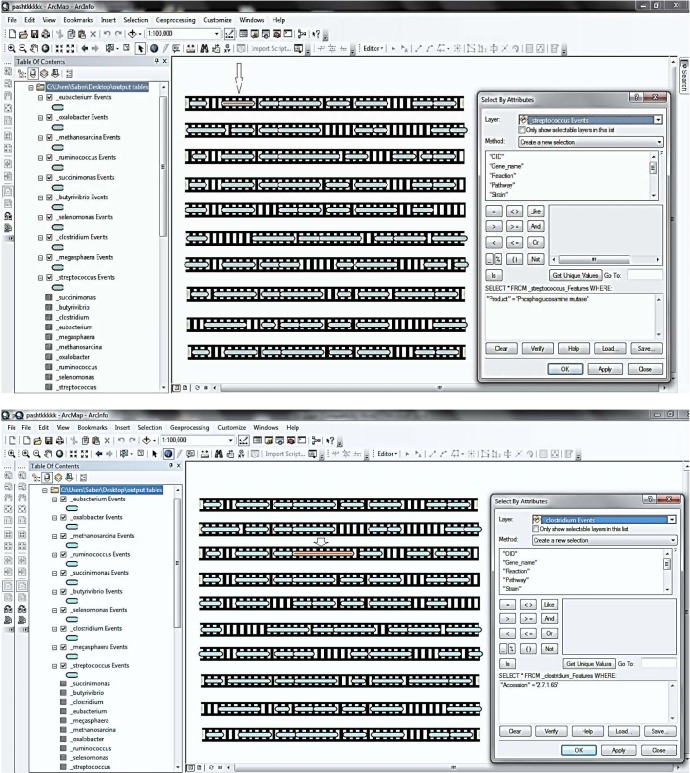
One of the advantages of a GIS application in the genomic area is that users can easily query and analyze genome-related data. In addition, the users are able to select locations on a genome map and display their records in the attribute table. GIS has a special functionality to support users with simple and complex queries for the data represented in each layer. As shown in Fig. 6, complicated queries were made based on the attributes of genomic data and a given gene location. Fig. 6 presents two query examples: one is for a special gene product (phosphoglucosamine mutase) in the annotated genome of Streptococcus bovis, and another is a query based on a specific accession number belonging to the gene (genes). The results of both query examples are presented on the genome, such that they are highlighted with a red rectangle on the genome layer. ArcGIS allows one to use "Identify tool." Applying this tool allows users to be able to have information about a gene displayed in ArcMap. It has been used as the fastest way to find out the characteristics of a location on a map. On the gene event layer, users are able to identify genes by clicking on a particular location (Fig. 7). This will present the attribute data of the selected location.
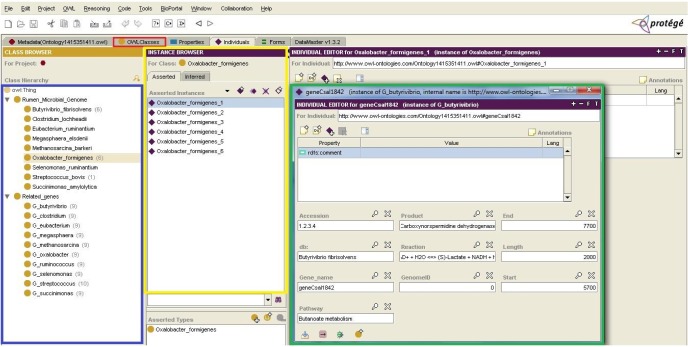
The genome ontology of ruminal microbes was developed using OWL/RDF language in the Protégé environment. Fig. 8 shows a screenshot of Protégé's class tab, indicated by a red rectangle. Via this tab, classes, along with their subclasses for the ontology, are displayed in the blue rectangle, and all instances and their attributes are shown in yellow and green rectangles, respectively. Additional tabs for object properties and data type properties are available in the editor, which has the same view as the class tab.
In conclusion, the proposed application provides users with the ability to manage genomic data related to the microbial community of the rumen. This application will be particularly helpful to researchers and experts who are working in fields, such as biology, animal sciences, and genomics. Two central aspects of designing and using such an interactive application are data querying and data sharing. The application allows users (1) to access, visualize, store, query, and analyze the genomic data and (2) to share such data among biology users and applications by providing a semantic structure of data. The data stored in the ontology is machine-processable and can be shared and reused by biology applications.
Discussion
With the emergence of large datasets in biology, life scientists are encountering bottlenecks in handling biological data. The increase of genomic data caused by next-generation sequencing technologies is leading to a continuous decrease in the effectiveness of conventional genomic browsers [26]. Most genomic browsers are principally used for visualizing the genomic features and a user's genomic data [26]. In order to visualize genomic features, different genomic browsers are available on the web, such as Ensembl [27] and University of California, Santa Cruz (UCSC) [28]. Some genomic browsers represent gene annotations as horizontal data tracks. For example, the UCSC genomic browser represents annotations as a series of horizontal tracks over the genomic sequence. In this browser, each track presents a specific type of annotation [28]. In comparison to the paradigm of horizontal data tracks applied by genomic browsers, the GIS application uses the concepts of a LR technique to present genomes in a dynamic manner, where users can define/change attributes of genes in a table and interactively see the gene events on genome layers. A previous study of a GIS application in genomic data management employed the concepts and tools that were defined for displaying the geographic data to develop GenoSIS. GenoSIS was proposed to spatially represent genomes and interact with genome-related attribute data [16]. However, this system is based on a fixed linear data model, which presents the genome as a linear feature with associated attributes. The system is fixed in the sense that defining new or changing gene attributes requires users to graphically draw new lines and change the GIS file (i.e., genome shapefile and geodatabase file). Moreover, this system lacks the ability to semantically represent genome-related information, where information can meaningfully be interpreted by software agents and can be shared between different biological applications. One of the most interesting capabilities of GIS compared to existing genomic browsers is its ability to make complex attribute and spatial queries. A GIS query is a user-defined request that examines genome/gene layer or tabular attributes based on user-selected criteria and displays only those features or records that satisfy the criteria. The proposed application has the potential to store, represent, visualize, and analyze genome-annotated data in a dynamic manner. In addition, our application adopted ontology to organize genomic data in a semantic framework, which facilitates data sharing among biology domains, applications, and experts. During recent years, there have been many web-based developments that use ontology as their knowledge base, such as GO [21], Plant Ontology [29], and Microbial Ontology [30], etc. Ontologies define domain concepts and the relationships between them and therefore provide a domain language that is meaningful to both machines and humans [30]. In the present study, we used Protégé, which contains a query interface known as the SPARQL query panel, through which users are able to query particular information from the ontology [30].
However, the proposed application in this study is subject to some limitations. One of the limitations is that the application is not able to represent all genomic data (e.g., sequences) and can not make a query on several genome event layers simultaneously. Another limitation is related to the lack of powerful inference engines to reason genomic data for the purpose of data sharing. Effective inference engines are required to semantically interpret data and exchange them with their intended meanings. One source of limitation is also related to the fact that the application is available on desktop; future research is required to develop an online version of the application and a data server consisting of microbial genome databases for browsing genome-annotated data.
Our work continues toward future plans, including the extension of this application to develop an ontology-based GIS interactive database for rumen microbial communities. Effort is already under way for developing such a comprehensive database to contain a wide spectrum of rumen microbial genomes.


