Introduction
Both eukaryotic and prokaryotic cells contain important gene-regulating elements, located within promoter regions [1,2]. It is known that promoter sequences possess special signatures to distinguish them from the rest of the genome sequences. A few core promoter elements have been detected, of which the most common elements are the CpG island, TATA box, initiator (Inr), downstream promoter element (DPE), and TFIIB recognition element (BRE) [2], but these promoter elements may not be universal.
Recently, a group from the Encyclopedia of DNA Elements (ENCODE) project published chromatic maps to mark histone modifications within nine cells of different types from the human genome, drawn from the results from chromatin immunoprecipitation sequencing (ChIP-seq) analyses of these same cells [1,2]. From each of these nine cells, Ernst et al. [3,4] published 15 chromatin states of the human genome. Among them, the first three states represent promoter regions: state 1 (Active_Promoter), state 2 (Weak_Promoter), and state 3 (Poised_Promoter). The information gained from the exploration of promoter elements and transcription starting sites will enable researchers to produce more accurate promoter prediction algorithms, which in turn will yield deeper insight into the process of transcription initiation and gene functions.
Here, we publish frequency profiles of the ChromHMM promoter states of the human genome, at 200bp intervals, paying particular attention to the existence of promoter elements, such as CpG islands, TATA boxes, Inr, DPE, and recognition elements from the transcription factors that bind with polymerase II (BRE) (signal features), together with transcription starting sites, in terms of size, overlapping patterns, and locations.
Results
Ernst et al. [4] applied unsupervised learning methods to convert the Broad Histone track's results from ChIP-seq analyses into specific points that indicate promoter regions on chromatin maps for 15 chromatin elements within the genome. These 15 chromatin states were chosen because of their rich biological content, as well their well-established presence in previous research [4]. The resulting files are hosted by the ENCODE Analysis Data Hub, which is available for public download under the ENCODE Data Release Policy (http://genome.ucsc.edu/ENCODE/downloads.html). We downloaded the BED files for the chromatin signal tracks of the nine ENCODE cell types. Within them, chromatin states 1, 2, and 3 represent Active, Weak, and Posed Promoters, respectively, which differ only in regard to the levels of expression in various biological assays. These states were defined, based purely on 9 chromatin marks, and their input controls across 9 cell types.
Depending upon the cell type, slight variances were found, as seen in Table 1. For example, the gm12878 cell line has an active promoter consisting of 14,674 blocks and occupies 0.80% of the whole genome, whereas k562 has 14,951 blocks and occupies 0.68% of the whole genome, for chromatin state 1. To overcome this slight variance in cell lines, we divided the promoter regions uniformly at 200-bp resolution, regardless of the 9 cell line block boundaries.
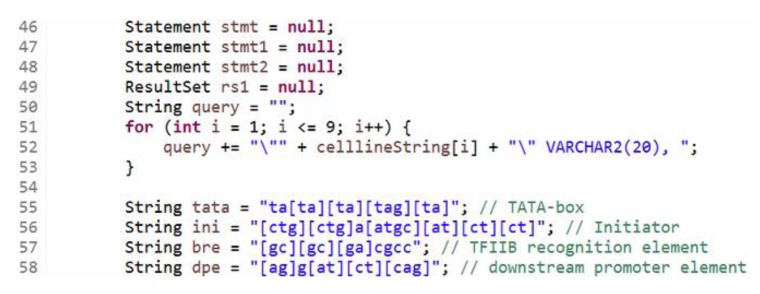
Fig. 1 shows our Java code, which relies on Java's Oracle interface (Oracle Database 12c Standard Edition) and implements regular expressions, based on predefined classes from the java.util.regex package, in order to pattern-match different promoter elements, such as CpG islands, TATA boxs, Inr, DPE, and BRE, for each 200-bp window. The code also builds upon formal grammar rules based on the structural properties seen in promoter sequences, though these patterns usually apply only to the core promoters [5,6]. Our Java code produces an output profile consisting of the 18 required fields as follows (Fig. 2).
The first three fields are: the name of the chromosome, the starting position of the feature in the chromosome, and the ending position. The next four fields represent the frequencies of the 4 promoter elements. For example, Fig. 2 shows that the nucleotide sequences starting from 28337 to 23537 (200 bp) in chromosome 1 contains 1 occurrence of a TATA box, 6 occurrences of Inr, 0 occurrences of BRE, and 6 occurrences of DPE. The next 9 fields indicate the ChromHMM annotation of 9 cell lines (K562, GM12878, H1HESC, HEPG2, HMEC, HSMM, HUVEC, NHEK, and NHLF). The last two fields indicate the existence of DataBase of Human Transcription Start Sites (dbTSS) data [7,8], and the GC ratio, respectively, where the hg19promoter file for dbTSS data was used for indexing (ftp://ftp.hgc.jp/pub/hgc/db/dbtss/dbtss_ver8/Sanger_data/).
Table 2 shows the summary of our promoter frequency profile. The data show significants difference from the known statistical factors of core promoters. It is due to the fact that we divided the regions into 200 bp lengths whereas the core promoter elements are known to exist typically within 50 bp (base pairs) upstream to 50 bp downstream of the TSS [2], and that we are including the Poised_Promoter state of the ChromHMM.
From the ChromHMM human promoter blocks, the results of our statistical survey on 176,579 units show that DPE sequences have the highest frequency among the four chosen motifs in promoter elements, appearing in about 97.1% of the ChromHMM promoter regions, meanwhile Inr is seen in 92% of promoter regions, and BRE is seen in only 17.3% of the promoters (It is known that Inr usually occurs only about half of the human promoters [3]). TATA boxes are found in 52.2% of the ChromHMM promoter blocks. Some contextual patterns have been recognized for certain promoter elements. For example, we can expect to find BREs within GC-rich areas, meanwhile areas with TATA boxes are typically GC-poor.
In total, there are 9,435 ChromHMM promoter blocks in the dbTSS locations (approximately 5.34%). The number of 200-bp blocks that contain all four promoter elements was 176,579. Among them, only 9,436 of the blocks contain dbTSS data [7,8]. Some of the blocks showed distinct associations with dbTSS data. For example, the promoter blocks that do not contain any of the promoter elements tend to have a higher GC ratio (0.68) where a dbTSS location exists.
Conclusion
One of the strengths of our work versus previous studies is that we profiled the core elements separately, based on the three classes of promoter states (Active_Promoter, Weak_Promoter, and Poised_Promoter of the ChromHMM). A more detailed analysis of frequency profiles in regard to these three states is beyond the scope of this paper. However, the complete frequency profiles and Java code are published through GitHub (https://github.com/KyungEunLee/motif). We believe that the frequency profiles presented of the three promoter states can be helpful for bioinformaticians to gain a deeper understanding of the characteristics of the various promoter regions and to improve upon old methods of core promoter analysis algorithms for their specific research needs.