 |
 |
- Search
| Genomics Inform > Volume 12(4); 2014 > Article |
Abstract
Hepatitis is a common and serious disease for the Korean population. It is caused by a virus, the A and B types of which are plentiful in Koreans. In this study, we tried to find genetic factors for hepatitis through genome-wide association studies. We took 368 cases and 1,500 controls from Anseong and Ansan cohort data. About 300,000 single-nucleotide polymorphisms and 20 epidemiological variables were analyzed. We did not find any meaningful significant single nucleotide polymorphisms, but we confirmed the influence of major epidemiological variables on hepatitis.
Hepatitis is inflammation of the liver, most commonly caused by a viral infection [1]. Five main hepatitis viruses are known, referred to as types A, B, C, D, and E. We are concerned with these main types because of the burden of illness and death; they also have the potential for outbreaks and epidemic spread. In particular, types B and C lead to chronic disease in hundreds of millions of people and together constitute the most common cause of liver cirrhosis and cancer [1]. The Korean Health Insurance Review and Assessment Service [2] reported on C type hepatitis patients in Korea, described in Table 1. Table 1 shows that the number of patients has been increased steadily. The prevalence rate of hepatitis type C in Koreans is 1%-1.5%. From the prevalence rate, 500,000-600,000 patients are estimated. Only 10% of them are treated. If we find risk factors for hepatitis, it is helpful for the prevention and treatment of hepatitis.
In this study, we performed a genome-wide association study of hepatitis in Korean populations. We tried to find significant single-nucleotide polymorphisms (SNPs) and epidemiological traits related to hepatitis.
The study subjects are based on the Anseong and Ansan cohort data, part of the Korea Association Resource (KARE) projects. The genotypes and phenotypes of the cohort population are described in Cho et al. [3]. Subjects with genotype accuracies below 98%, high missing genotype call rates (Ōēź4%), high heterozygosity (>30%), or inconsistency in sex were excluded from subsequent analyses. Individuals who had a tumor were excluded, as were related individuals whose estimated identity-by-state values were high (>0.80). After these quality control steps, 352,000 SNP genotypes for 8,842 individuals were selected [4]. The epidemiological trait data for these individuals were also from the KARE project. Among the total of 8,842 individual cases, 368 had hepatitis with age over 30, and 1,500 controls were randomly selected from non-hepatitis individuals with age over 30. Table 2 summarizes the clinical characteristics of the phenotypes in this study.
The chosen dataset was imbalanced; the number of cases was smaller than controls. A dataset is imbalanced if it contains many more samples from one class than from the rest of the classes [5]. In this case, the classification analysis showed good accuracy in the majority class but very poor accuracy in the minority class. Therefore, we needed to transform the imbalanced dataset to a balanced dataset. We applied an 'oversampling' scheme [5] to overcome the imbalance problem. The final dataset contained 1,500 controls and 1,500 cases.
To find significant SNPs, we used PLINK, version 1.07 [6]. Other statistical analyses were performed using R, version 3.1. We used logistic regression to find major factors related with hepatitis. Receiver operating characteristic (ROC)/area under the curve (AUC) analysis was performed to confirm the prediction power of the major factors that were found.
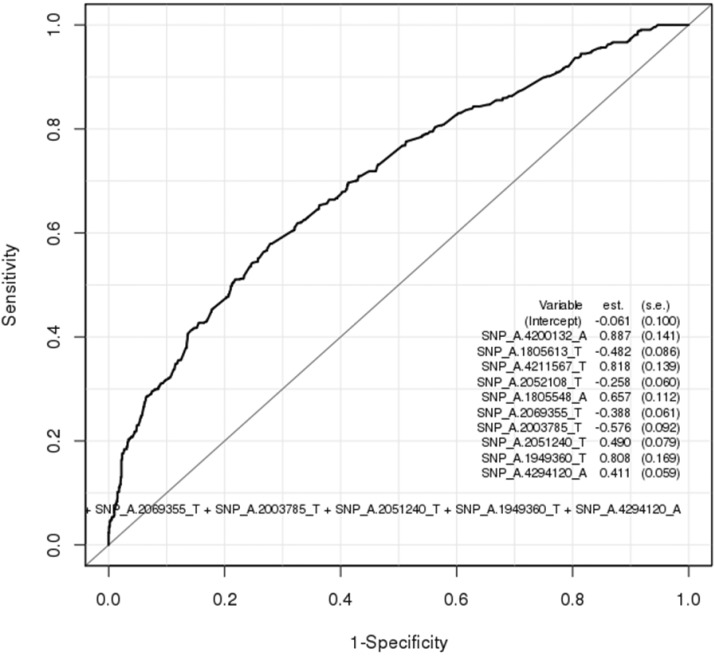
Table 3 summarizes 20 SNPs that were top-ranked by p-value in the genome-wide association analysis. Unfortunately, there were no significant SNPs that met p < 5 ├Ś 10-8. We performed logistic regression test on the top-ranked SNPs, and we took 10 SNPs in Table 4. Logistic regression measures the relationship between a categorical dependent variable (phenotype) and one or more independent variables (SNPs). Fig. 1 shows the ROC plot for the classification test using the 10 SNPs. The AUC value from the ROC plot is 0.700; it is not enough as a biomarker.
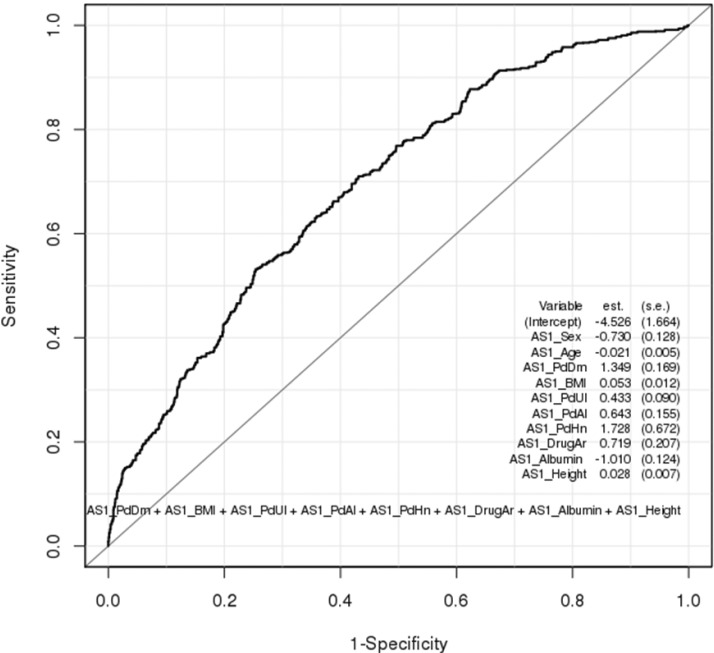
Using the traits in Table 2, we performed a logistic regression test. Table 5 summarizes the results. As we can see, diabetes, gastritis, allergy, external head injury, taking arthritis drug, and degree of albumin were highly correlated with hepatitis. In the case of diabetes, the probability that a diabetes patient had hepatitis was 4 times higher than a diabetes-free person. In general, the hepatitis C virus is often associated with diabetes, and some diabetics may even develop chronic hepatitis [7]. Gastritis is influenced by hepatitis. If we have hepatitis, the probability of getting gastritis is increased 1.5 times. Especially, chronic gastritis develops by chronic hepatitis [8]. Sometimes, allergy cahepatitis. It increases the probability of hepatitis by 1.8 times. Hepatitis virus can cause arthritis [9]; it increases the probability of arthritis by 1.9 times. The degree of albumin is inversely proportional to hepatitis (odds ratio [OR], 0.8), because the liver makes albumin, and hepatitis enervates the process. The OR between external head injury and hepatitis is very high (OR, 1.31). We cannot explain the medical relationship between them. It needs more analysis.
From the epidemiological analysis, we found relevant variables with hepatitis. We confirmed that hepatitis has a wide relation with other diseases. If we make a disease network in which the node is a disease and the edge is a correlation coefficient between two nodes, we can understand the relationship among diseases more clearly. Current known disease networks [10, 11] do not show detailed relationships between hepatitis and other diseases. This is a future research topic.
KARE data are the result of a cohort study. It contains a small number of samples for specific diseases, whereas the whole population is very big. It induces an imbalanced dataset for statistical analysis. Our study implies a basic limitation, even though we tried to complement the problem. We also did not find any significant SNPs related with hepatitis. If we combine the knowledge of other biological databases, we may get a more meaningful interpretation for the results of our experiment.
Acknowledgments
This work was supported by grants from the Korea Centers for Disease Control and Prevention, Republic of Korea (4845-301, 4851-302, 4851-307).
References
1. World Health Organization (WHO). What is hepatitis?. Geneva: World Health Organization, 2014. Accessed 2014 Nov 1. Available from: http://www.who.int/features/qa/76/en/.
2. Korean Health Insurance Review & Assessment Service. Seoul: Korean Health Insurance Review & Assessment Service, 2014. Accessed 2014 Nov 1. Available from: http://www.hira.or.kr/main.do.
3. Cho YS, Go MJ, Kim YJ, Heo JY, Oh JH, Ban HJ, et al. A large-scale genome-wide association study of Asian populations uncovers genetic factors influencing eight quantitative traits. Nat Genet 2009;41:527ŌĆō534. PMID: 19396169.


4. Hong KW, Kim SS, Kim Y. Genome-wide association study of orthostatic hypotension and supine-standing blood pressure changes in two korean populations. Genomics Inform 2013;11:129ŌĆō134. PMID: 24124408.


5. Ganganwar V. An overview of classification algorithms for imbalanced datasets. Int J Emerg Technol Adv Eng 2012;2:42ŌĆō47.
6. Purcell S, Neale B, Todd-Brown K, Thomas L, Ferreira MA, Bender D, et al. PLINK: a tool set for whole-genome association and population-based linkage analyses. Am J Hum Genet 2007;81:559ŌĆō575. PMID: 17701901.


7. Negro F, Alaei M. Hepatitis C virus and type 2 diabetes. World J Gastroenterol 2009;15:1537ŌĆō1547. PMID: 19340895.


8. The Free Dictionary. Gastritis. Huntingdon Valley: Farlex Inc., c2003-2014. Accessed 2014 Nov 1. Available from: http://encyclopedia2.thefreedictionary.com/.
9. American College of Rheumatology. HCV and Rheumatic Disease. Lake Boulevard: American College of Rheumatology, 2014. Accessed 2014 Nov 1. Available from: https://www.rheumatology.org/Practice/Clinical/Patients/.
10. Diseasome. Human disease network. Dieseasome, 2014. Accessed 2014 Nov 1. Available from: http://diseasome.eu/map.html.
11. HuDiNe. Human disease network. HuDiNe, 2014. Accessed 2014 Nov 1. Available from: http://hudine.neu.edu/.
Fig.┬Ā1
Receiver operating characteristic plot for 4 single nucleotide polymorphisms derived from logistic regression (area under the curve, 0.700).

Fig.┬Ā2
Receiver operating characteristic plot for 8 epidemiological variables derived from logistic regression (area under the curve, 0.693).

Table┬Ā1.
Statistics of hepatitis type C
| Year | No. of patients |
|---|---|
| 2008 | 40,683 |
| 2009 | 42,365 |
| 2010 | 41,525 |
| 2011 | 43,879 |
| 2012 | 45,890 |
Table┬Ā2.
Clinical characteristics of variables in this study
Table┬Ā3.
Top-ranked SNPs of genome-wide association analysis
Table┬Ā4.
Logistic regression test for SNP data
Table┬Ā5.
Logistic regression test for epidemiological data
Table┬Ā6.
Area under the curve (AUC) values
- TOOLS
-
METRICS

-
- 1 Crossref
- 5,444 View
- 55 Download
- Related articles in GNI


