Introduction
- Heatmaps are common graphical representations that are used to present genomics values as matrices of colors. Matrix heatmaps are typically represented as rectangles (such as cBio Cancer Genomics Portal [12] and Caleydo StratomeX [13]) and occasionally as circles (such as CircleMap [14]).
- Genomic Coordinates represent oncogenomics data by showing alterations tied to their genomic loci. This approach is only suitable for analyzing the genomic topography of alternations or for inspecting particular genomic loci [9]. Typical techniques in this approach are Genomics Viewer [15], UCSC Cancer Denomics Browser [16], and Savant Genome Browser [17].
- Networks (or graphs) can be used to show changes in state for 1) interpreting and exploring large biological networks and 2) assembly and curation of pathways (such as Cytoscape [18], VANTED [19], VisANT [20], NAViGaTOR [21], and Cerebral [22]).
Methods
Biological background and data analysis
The visual analytics model
Interactive visualization
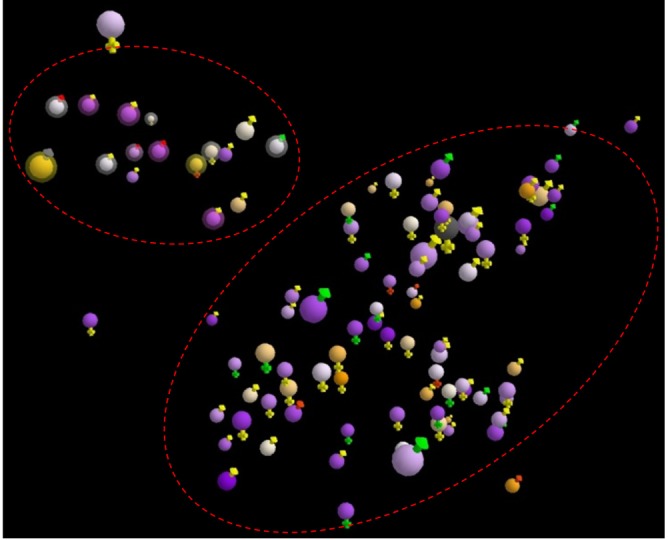
Overview of patients
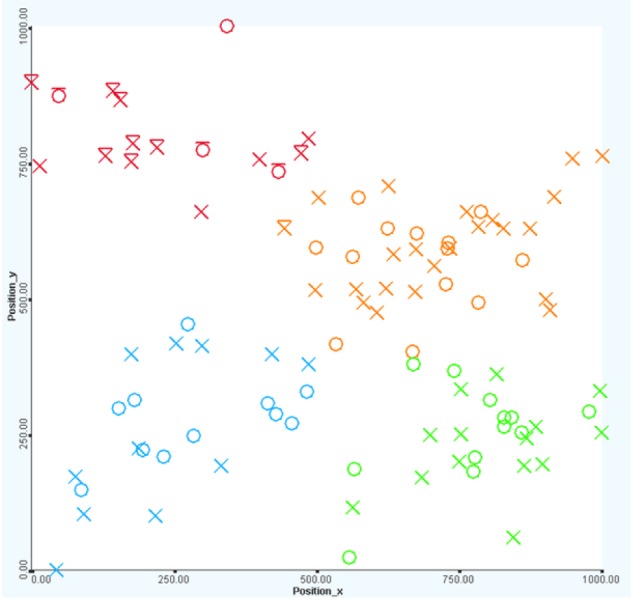
Patient's positions
Interactive exploration
Mapping property
Filtering
Probe set analysis
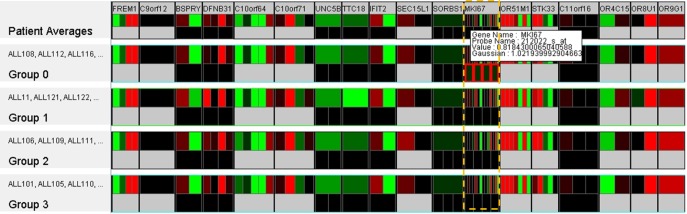
Clustering
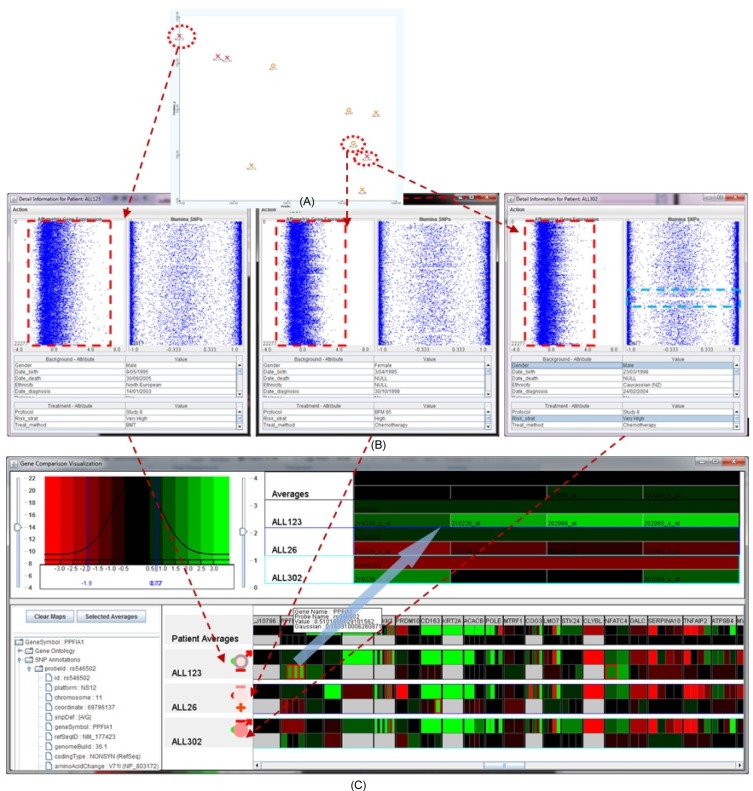
Patient-to-patient visual analysis
Visual analysis of GOI
Results and Discussion
There is little coherence between the genomic property and the biomedical property, such as risk, dead, or survival rate. Similar patients in terms of background and clinical information might have significant differences in their genetic properties. For example, Fig. 13 illustrates the details of several genes of interest for the four patients: ALL92, ALL129, ALL323, and ALL321. The patients' clinical properties are similar, including MR, male, deceased, and Study 8 protocol. However, the Affymetrix expression microarrays and Illumina SNPs values are quite varied among these patients.
Early treatments are more effective than late treatments (see Fig. 14). Particularly, there was only one death out of 19 cases (95% chance of survival from the disease) if the treatment was started within 5 years after birth. The dead case also happened to a very high-risk patient who was unlikely to survive because of the disease. If the treatment was started after 5 years but within 10 years from birth, the survival rate is 86% (3 deaths out of 22 cases), and if the treatment was used after 10 years from birth, the survival rate reduces significantly to 69% (4 deaths out of 13 cases).
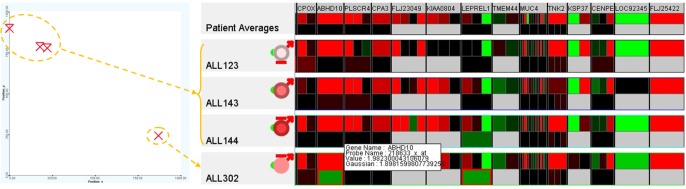
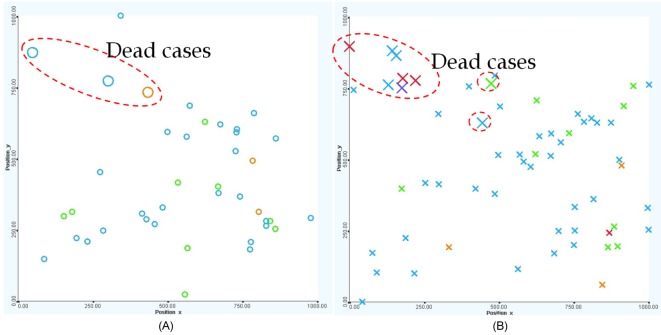
Among the very high-risk patients ALL123, ALL143, ALL144, and ALL302 (top-left), patient ALL302 (near bottom-right) was the only survivor whose genetic property was significantly different from the others (at the top-left). Further examination using the 250 GOIs illustrated in Fig. 15 confirms this hypothesis for the expression values, especially for the genes ABHD10, LEPREL1, CNOT4, CHD9, EPOR, RASAL2, ZNF141, and SLC25A31. The variation at a particular gene or a combination of these genes might have contributed to the survival rate or an improvement in treatment. This finding can be verified by further analysis using larger and more comprehensive datasets and, ultimately, the actual proof of the clinical experiments.
Patients who were born in later years have a better chance of survival. For example, the rate of survival for those patients born after 1995 was approximately 94% while the rate for those patients born before 1995 was approximately 83%. This property reflects the improvement in treatment technology, treatment methodology, and living conditions.
Female patients tend to fare better than male patients overall (see Fig. 16). There is a 92.5% chance of survival in females (3 dead cases out of 40) versus an 88.3% chance of survival in males (7 dead cases out of 60).
The Study 8 protocol is dominant. The BFM 95 protocol is mostly applied to standard- to medium-risk patients who were born before 2000. The Study 8 protocol is a much more popular method, and it was used for patients regardless of risk strategies and age. Fig. 17 shows the protocols used in ALL treatment, including Study 8 (green), BFM 95 (blue), Interfant 99 (orange), and others (red).
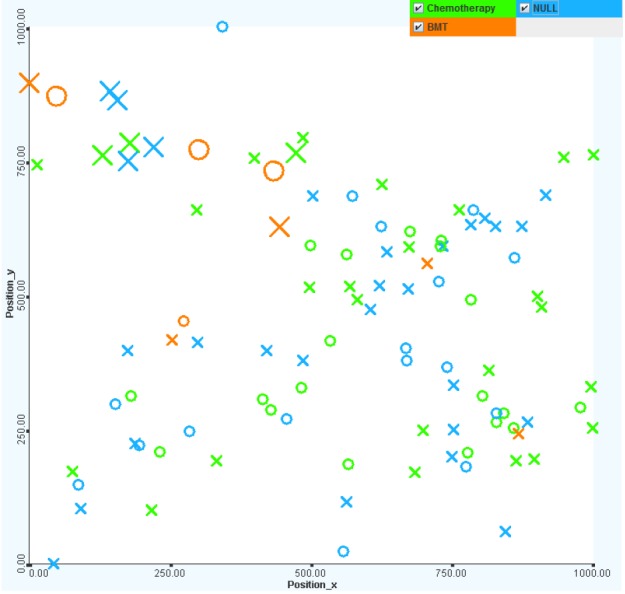
Chemotherapy is more effective in treatment. It is interesting that nearly one-half of all patients did not have any treatments (or there were no treatment records) on record. The untreated patients mostly have standard to MRs. The bone marrow transplant treatment method has little effect on the survival rate (only 1 out of 5 cases survived). The most commonly chosen treatment method is chemotherapy, the survival rate for which is over 90% (see Fig. 18).