Introduction
Gastritis is a common disease in Korea. There is a report that 9.9% of Koreans have gastritis [1]. Gastritis is associated with the potential risk of developing gastric cancer or peptic ulcer disease [2]. A common cause of gastritis is Helicobacter pylori infection [3]. However, in addition to the cause, other genetic and genomic factors have been examined for gastritis. Human leukocyte antigen class II allele is an important risk factor for chronic atrophic gastritis and gastric carcinoma in Koreans [4]. Moreover, many studies have reported that single-nucleotide polymorphisms (SNPs), including rs1143627 in interleukin-1 beta (IL1B), rs4073 in interleukin 8 (IL8), rs4986790 in Toll-like receptor 4 (TLR4), and rs16260 in cadherin-1 (CDH1), are associated with susceptibility to gastric diseases, especially gastric cancer [5, 6, 7, 8].
The results from SNP studies show the importance of research for the association between SNP and disease, based on the association and functional relationship between gastritis and gastric carcinoma [9]. In other words, a casual SNP in one disease may be a genetic factor for another disease. However, previous studies only targeted the effect from each single variation; results have been rarely obtained for high-order genetic interactions in gastritis from genome-wide association (GWA) studies to date.
In this study, we performed a GWA case-control study for gastritis using SNP genotype data of the Korea Associated Resource (KARE) project [10]. Our study was focused on detecting significant epistatic SNP-SNP interactions and the resulting gene-gene interactions that are putative causal factors in gastritis. A validation and functional analysis of the result was performed on the obtained relevance gene-gene epistasis network.
Our network construction method is based on the previous relevance network approach [11]. To measure the strength of the association between a pair of SNPs and gastritis, we used the mutual information that has shown to be effective in detecting epistasis in case-control GWA studies [12, 13]. An efficient permutation scheme was adopted to extract significant interaction pairs, and we also approximated the p-values by exploiting the relationship between the mutual information value and the χ2 value [14]. We further transformed this SNP network into a relevant gene-gene epistasis network to validate the biological significance of our findings. A functional analysis was performed on the gene-gene network, and the topological properties of the network were also investigated.
Methods
Pre-processing for KARE data
The KARE genotype data we used in the study initially consisted of 352,228 SNPs and 8,842 samples after the screening by genotype calling and quality control performed [10]. We performed the following additional stages of pre-processing. First, we selected case-control samples based on the survey of the disease history of the patients, which was carried out in the KARE project. In the first stage, we collected 1,885 patients who self-reported that they had gastritis in the past as cases. We also found 4,117 individuals who self-reported that they had no history of having gastritis or any other diseases. Among those patients, we randomly selected 1,885 individuals as controls to avoid bias in the study.
After the selection of case-control patients, we filtered out SNPs that corresponded to the following conditions: minor allele frequency <0.01 in each group [15], pairwise linkage disequilibrium r2 > 0.8 [16], and SNPs in the X chromosome. PLINK [17] was used for the calculation of these values. The resulting dataset consisted of 185,426 SNPs and 3,770 samples for the case-control study.
Mutual information
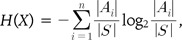
We used mutual information measures to assess the strength of the association between a pair of SNPs and the disease status of gastritis. Mutual information has been widely used to measure dependence or independence between two random variables [11, 12, 18, 19]. It is a non-parametric measure and is able to detect both linear and non-linear associations [14]. This measure is based on Shannon's entropy, H(X) = Σx∈X - p(x)log(p(x)), which shows the uncertainty of the random variable X. Mutual information I(X;Y) between random variables X and Y is defined by the composition of entropy as follows:
H(X), H(Y) denote entropies for the random variables X, Y, and H(X,Y) denotes the joint entropy of the two random variables as follows:
A high mutual information value indicates a strong association between two random variables. The measure can also be extended to assess the strength of association between a pair of SNPs and a phenotype. The extended version of mutual information is as follows: where X1 and X2 are random variables for two SNPs, and Y denotes random variables for the disease. In our recent work [12], we have shown that this measure could identify high-order epistatic interactions both with and without marginal effects by using simulation models, such as in Culverhouse et al.'s [20] and Velez et al.'s studies [21].
As the genotype and disease status are represented as discrete values, it is more convenient to consider the random variables as a partition of the combination of the genotypes and disease status. Then, the entropy of a random variable X can be represented in terms of the partition as follows:
where X = {A1, A2,…, An} is a partition on the set of samples S = {A1∪A2∪…∪An}, and no intersections exist between elements in the partition. The joint entropy of two random variables for the partition of S, X = {A1, A2,…, An} and Y = {B1, B2,…, Bm} is defined as follows:

The entropy also can be extended to the joint entropy of multiple random variables (e.g., 3 or 4 SNPs) naturally.
Extraction of statistically significant epistatic interactions
As mentioned above, mutual information is a non-parametric measure, and the distribution of values from the population is unknown; therefore, it is difficult to show the statistical significance of values calculated by this measure. Rather than doing the computationally too-expensive permutation tests for every pair of SNPs, which causes severe multiple testing issues when applied to GWA studies, we adopted the alternative permutation scheme proposed [11]. First, we replicated 30 permutations for disease status in case-control samples. For every possible pair of given SNPs, we calculated mutual information of SNPs with the permutated disease status labels and obtained the average value from 30 replications. θ denotes the maximum value of the averages. If a mutual information value between SNPs and the phenotype from real data is higher than θ, then we consider that the pair of SNPs shows a more significant association with gastritis than a random association.
To further assess the statistical significance of the identified SNP pairs, we approximated the p-values of the SNP pairs by exploiting the following relationship between χ2 value and mutual information [14]: where N denotes the number of patients in the study.
Relevance network construction and assessment of significance
Network analysis is a powerful tool to understand biological systems. Given the significant epistatic interactions between SNP pairs and disease status detected by the permutation scheme, we constructed SNP-SNP epistatic interaction networks, where SNP represents the node and the significant interaction between SNP pairs represents the edge. However, it is difficult to assess the biological significance of the interaction networks directly because of the lack of interaction databases for SNPs.
To overcome this limitation, we directly mapped these networks into a gene-gene relevance network.
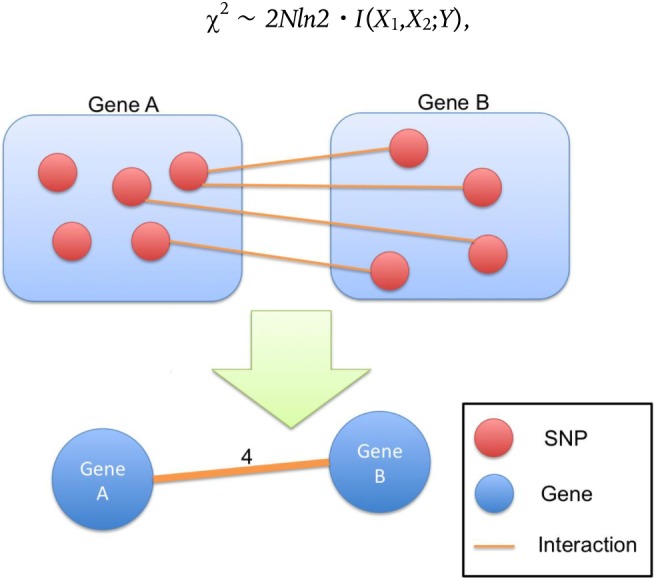
Fig. 1 represents a brief scheme of how to map the network. Suppose that some SNPs map directly to genes A and B, and there are at least two SNPs that have significant interactions for disease status. If one SNP maps to gene A and another SNP maps to gene B, then we consider that genes A and B have a unidirectional edge. The weight of the edge is defined by number of the interacting SNP pairs. For example, in Fig. 1, there are four SNP interactions between gene A and gene B. Thus, we consider that gene A and gene B have an edge, the weight of which is 4 in the gene-gene network. Finally, the top 5% edges having the largest edge weights are used in the biological validation and topological investigation.
We constructed a gene-gene network for each chromosome showing intra-chromosome interactions. We measured the network topologies of each network using Cytoscape [22] and also ran a gene ontology (GO) enrichment analysis for sets of genes in the network. We used DAVID [23] to validate the biological significance of the networks.
Fig. 2 illustrates the overall analysis scheme used in this study.
Results
Statistically significant epistatic interactions in each chromosome
We ran the permutation method for each individual chromosome separately. As a result, we obtained SNP pairs that were non-randomly associated with the status of gastritis for the given patients.
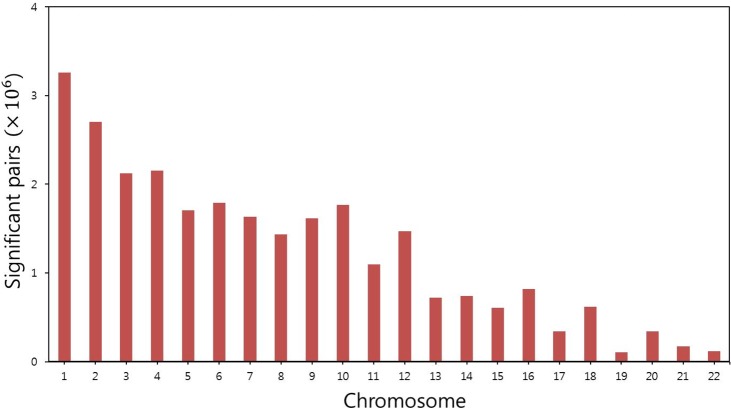
Fig. 3 shows the number of such SNP pairs for each chromosome. We found that there were approximately 2%-4% associated pairs among all possible pairs in the chromosomes.
We then calculated the p-value for each SNP pair by using the approximation scheme [14] and under Bonferroni correction [24]. Table 1 shows the number of statistically significant SNP pairs within each chromosome. Significant SNP pairs and p-values are listed in Supplementary Table 1. In total, 293 SNP pairs showed statistical significance in the study. Chromosomes 9 and 15 had many significant pairs, but many of those pairs included SNPs with marginal effects (rs169730 in chromosome 9, rs493971 in chromosome 15). There were few significant SNP pairs within the chromosomes, and these pairs were not found in previous studies of gastric disease; therefore, further investigation of the pairs is needed to assess their biological significance.
Network topologies
Table 2 summarizes the results of the network topology measures (number of nodes and edges, clustering coefficient, and network centralization) for the gene-gene interaction network for each chromosome. The table shows that all chromosomes showed similar properties: the number of edges is 10-30-fold higher than the number of nodes, and the measurements reveal high clustering coefficients and network centralization.
Additionally, every network from each chromosome consisted of only one component.
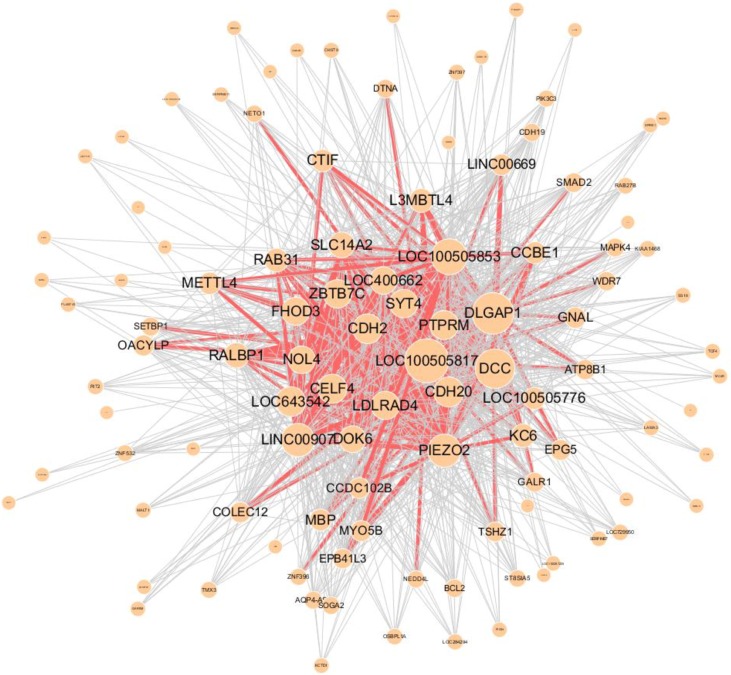
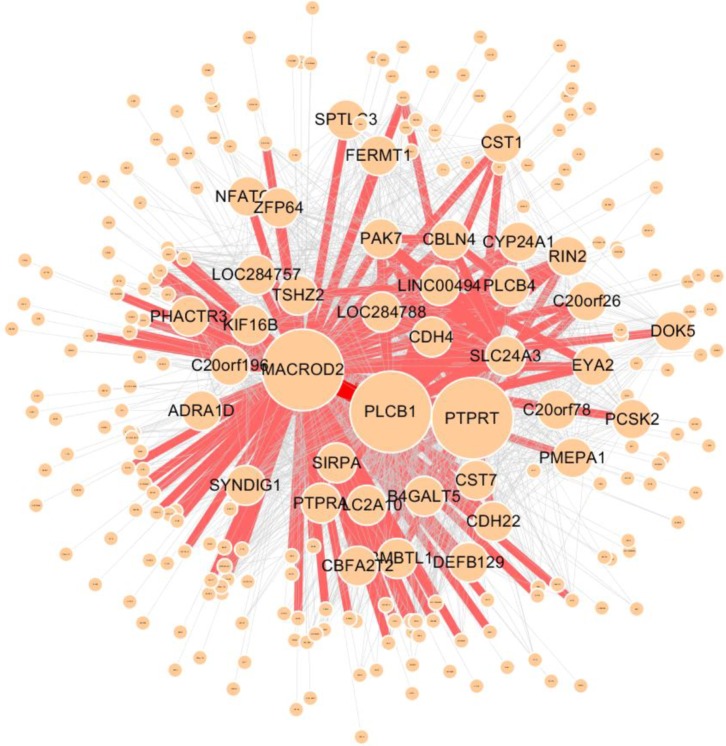
Figs. 4 and 5 present the structure of networks showing the highest values for the measures, especially the clustering coefficient and network centralization.
In the real world, many biological networks show high average clustering coefficients [25]. The network in chromosome 18 showed the highest clustering coefficient, and we found some hub genes in the network that were reported to be associated with gastric disease. For example, Uchino et al. [26] reported frequent loss of heterozygosity at the deleted in colorectal carcinoma (DCC) locus in gastric cancer.
Higher network centralization values show that hub genes highly affect the network [27]. In other words, if the hubs are removed, then the network may divide into several components. The network in chromosome 20 showed the highest value for the centralization measure. In the network receptor-type tyrosine-protein phosphatase T (PTPRT), one of the hub genes was reported to be one of 15 genes in CpG islands showing significant differential methylation in gastric carcinoma [28].
From the results, we determined that there were many close gene-gene interactions derived from SNP-SNP interactions for gastritis and that if a gene had a high degree in the network, then this gene was connected to other genes with which it had frequent SNP-SNP interactions. We also found this tendency in most chromosomes.
Enrichment analysis
We ran an enrichment analysis of the gene-gene interaction network for GO using DAVID [23].
Table 3 summarizes the significantly enriched terms from DAVID. Every term that was annotated in the table was significant under a false discovery rate (FDR)-based correction (p < 0.05 after adjustment).
Chromosome 19 had the most enriched terms among chromosomes, and these terms were related to regulation (biological process) and binding (molecular function).
Fig. 6 presents the internal structure of the sub-network for transcription (GO:0006350) in chromosome 19. This network has many zinc finger (ZNF) family genes. Taniuchi et al. [29] reported that zinc-binding protein-89 (ZBP-89), which is related to the ZNF gene family and is a Krüppel-type zinc finger protein, is overexpressed in gastric cancer patients.
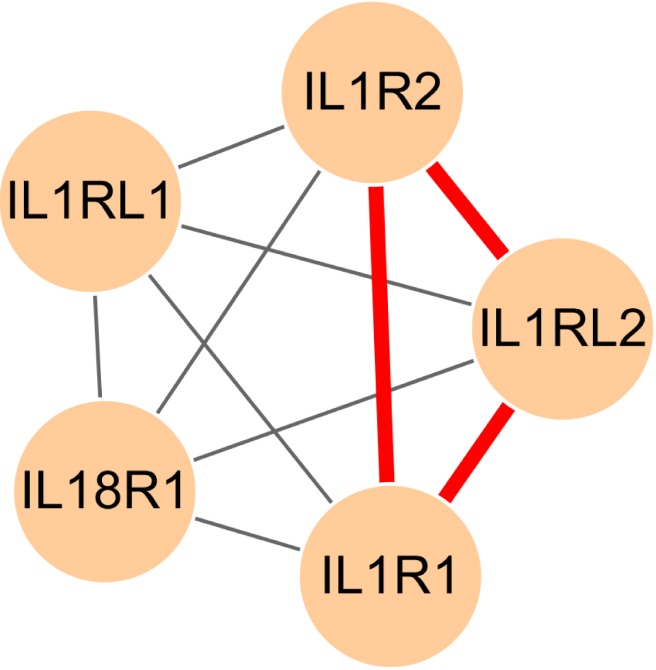
Additionally, interleukin-1 receptor activity (GO:0004908) was significantly enriched in chromosome 2.
Fig. 7 presents the internal structure of the gene-gene relevance network for the GO terms. As mentioned in the introduction, interleukin family genes and intra-SNPs were reported [5, 7]; therefore, these genes and SNPs are associated with the susceptibility to gastric cancer. Genes that were enriched in the GO terms were not connected in the relevance gene-gene network; still, these genes had few SNP-SNP interactions with every other gene (weight equal or less than 11).
We also ran an enrichment analysis for the Kyoto Encyclopedia of Genes and Genomes (KEGG) pathway [30], but no terms were significant under FDR-based adjustment.
Discussion
In this study, we applied a simple but powerful method to detect epistatic interactions that distinguish gastritis patients from controls. We found several putative SNP-SNP interactions using the mutual information measure. Additionally, relevance gene-gene interaction networks that are derived from epistatic interactions show high clustering coefficients and centralization.
We found that some sub-networks in the recovered network had biological significance for gastric disease from the GO enrichment analysis. However, we did not find these results to have direct associations with gastritis, because gastritis has been less extensively studied than other gastric diseases, such as gastric cancer or ulcer. We expect that future studies on gastritis will be necessary to validate the results from our study.
In this study, only intra-chromosome interactions were considered. We expect that if we extend the method to inter-chromosomal analyses, this could increase the chances of finding novel sub-networks that are enriched in pathways for gastritis. However, this extension will impose a computational burden and increase the type I error; therefore, the development of a more flexible framework is needed to resolve this issue.