Introduction
Recent data have shown the inextricable relationship between diabetes mellitus (DM), hypertension (HT), and coronary artery disease (CAD). For instance, approximately 70% of patients with DM reported being affected by HT, which is about twice as common in patients with DM as in those without it [1]. Furthermore, patients with both DM and HT were reported to have double the risk for CAD, which is the most prevalent cause of morbidity in type 1 or type 2 DM [2]. However, the underlying genetic contributions driving the increased prevalence of HT and CAD in diabetic patients are poorly understood.
There have been many studies seeking to understand the mechanisms of complex traits using a single-locus-based approach, but they have not been capable of explaining their complicated genetic effects. Instead, it is necessary to consider the joint genetic effects produced through the simultaneous perturbation of epistatically interacting variants. Consequently, epistasis is now increasingly assumed to be an important factor in demonstrating complex disease, and there are many studies in which evidence of epistasis has been found [3].
Unfortunately, in spite of such efforts, most such studies usually have been conducted in a European descent cohort [4] and have not included any Asian patients. In this work, we performed a genomewide epistasis analysis using the East Asian cohort from Korea Association Resource (KARE) data. This is meaningful work, because obvious differences exist between ethnically diverse populations, such as susceptibility genes, allele frequency, and linkage disequilibrium (LD) structure.
Most genetic variants associated with complex disease are usually located in non-coding genomic regions, and many studies have suggested that such variants might be involved in a transcriptional regulatory role [5]. In this regard, when building an appropriate model, it can be very limiting to assign affected genes using only the nearest ones. For systematic annotation, therefore, we have suggested extensive non-coding variant annotation using regulatory elements, including promoters and distal enhancers. In this work, we illustrate how this annotation method can be used to establish a reasonable genetic model in complex diseases.
Methods
KARE data
We used 352,228 single-nucleotide polymorphisms (SNPs) genotyped using Affymetrix Genomewide Human SNP Array 5.0 (genomic coordinates hg18; Affymetrix Inc., Santa Clara, CA, USA) for 8,842 Korean individuals from the KARE project. We converted hg18 to hg19 using the liftOver tool from UCSC (http://genome.ucsc.edu/cgi-bin/hgLiftOver) and converted Affymetrix ID to dbSNP reference cluster ID using the annotation file offered by Affymetrix (http://affymetrix.com). In this study, we focused on DM, HT, and CAD (myocardial infarction and CAD) and considered people who did not have any disease as the controls (Table 1).
Epistasis detection using GPU-based Boolean Operation-based Screening and Testing
We applied GPU-based Boolean Operation-based Screening and Testing (GBOOST) to analyze epistatic interaction effects from the genomewide SNP data [6]. Stage I: screening-in the screening stage, BOOST evaluated all pairwise interactions using the Kirkwood superposition approximation. Stage 2: testing-pairs of epistatic loci with PBOOST Ōēż 4.89e-06 were further evaluated by a logistic regression model to compute interaction effects [7]. After that, GBOOST conducted a Žć2 test with four degrees of freedom (df = 4) and calculated p-values to determine whether the interaction effect was significant. The numbers of interactions tested were 226,507, 251,344, and 151,090 in DM, HT, and CAD, respectively; thus, the genome-wide significance levels were 4.41e-08, 3.98e-08, and 6.62e-08 using Bonferroni correction.
Enrichment of epistatic SNPs in regulatory elements
To test for the enrichment of epistatic SNPs (Table 2) in regulatory elements, we overlapped SNPs with enhancers (see below) and footprints data. We obtained genomic DNase I footprints across 41 cell types from the Encyclopedia of DNA Elements (ENCODE) Project (The ENCODE Project Consortium 2012; http://genome.ucsc.edu/ENCODDE/downloads.html). Nucleotide resolution analysis of DNase I cleavage patterns allowed us to discover the footprints of where the transcription factor bound [8].
To determine whether the observed count was significantly greater than expected by chance, we randomly selected 7,967 variants (the same number of epistatic SNPs) from dbSNPs (59,180,134 autosomal SNPs) and repeated the overlap analysis 1,000 times. The level of significance (p-value) was computed as the proportion of counts that were equal to or larger than the observed count from the null distribution.
Target gene mapping to SNPs using regulatory elements
We used all transcript annotations from GENCODE.v19, which contains 20,242 protein-coding genes. The promoter was defined as the region 1.5 kb upstream of the transcription start site of a gene. When a SNP was in the promoter region of a gene, we assigned the gene to the SNP.
In the case of SNPs that were not assigned using the promoter, we assigned genes using the enhancer that was connected with the promoter of the target gene. We obtained genomewide multiple-cell-type enhancer data from previous studies [9, 10]. Maurano et al. [9] identified distal enhancer-to-promoter connections using DNase I profiles across 349 diverse cell types, and Andersson et al. [10] identified extensive active enhancers and their target promoters by using Cap Analysis Gene Expression (CAGE) data based on the FANTOM5 panel of ~400 distinct cell types. We collected a total of 663,583 pairs of enhancers and target genes.
If an SNP was not assigned, we looked for the closest SNP in LD based on CHB/JPT populations (Han Chinese in Beijing, China/Japanese in Tokyo, Japan; Asian ancestry) with an r2 > 0.8 that was within 500 kb using the SNAP proxy tool (http://www.broadinstitute.org/mpg/snap/) [11]. The summary of the number of assigned genes is shown in Table 3.
Enrichment of the affected genes in the known gene set
We downloaded DM-, HT-, and CAD-related gene information from Phenopedia (HuGE Navigator, version 2.0) [12]. The HuGE Navigator is an integrated knowledge-based database of genetic associations that have been extensively explored, based on the literature, and is continuously updated from PubMed (http://www.ncbi.nlm.nih.gov/pubmed/).
To test whether the genes we discovered were statistically enriched within known genes involving the disease, we calculated the p-value using the hyper-geometric test: where N represents the total number of genes (N = 20,242), n is the number of genes we found, and M and k are the number of genes in the known DB (Table 3) and that overlap, respectively.

Results
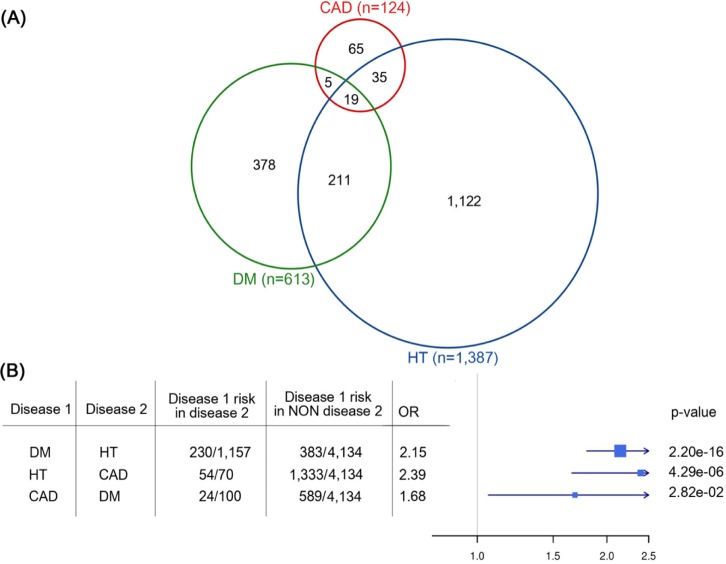
In the KARE dataset, there were substantial overlaps between the cases of DM, HT, and CAD (Fig. 1). We found that the occurrence of one disease was largely dependent on another. For example, the incidence of HT was significantly associated with CAD (odds ratio, 2.39; 95% confidence interval [CI], 1.64 to 3.48; p = 4.29e-06). Similarly, the odds ratio of incident DM for HT versus normal was 2.15 (95% CI, 1.79 to 2.56; p = 2.20e-16), and the odds ratio of CAD for DM was 1.68 (95% CI, 1.02 to 2.68; p = 2.82e-02) (Fig. 2).
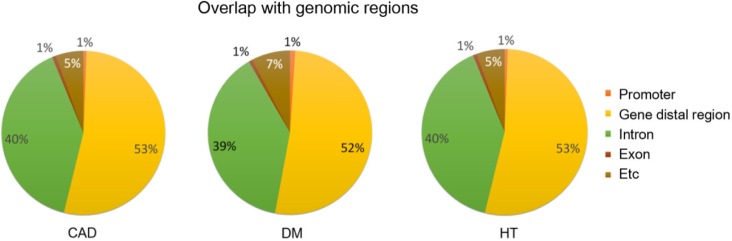
We analyzed all pairwise interaction effects from the KARE data using GBOOST. As the result, we detected 1,962, 2,023, and 1,709 epistatic interactions in DM, HT, and CAD, respectively (Table 3). For a full list, see the Supplementary Tables 1,2,3. We overlapped these epistatic SNPs within genomic regions, including the promoter, gene distal region, intron, and exon. (Fig. 2). As a result, the majority of detected epistatic SNPs was found to reside in non-coding regions, especially within introns and gene distal regions, which are intergenic regions, excluding promoters.
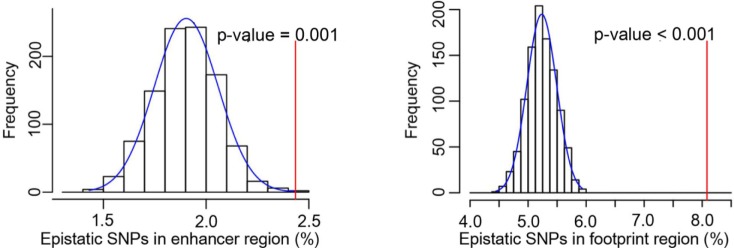
Furthermore, we tested whether the epistatic SNPs were enriched in regulatory element, such as enhancers and DNase I footprints (Fig. 3). We identified statistically significant enrichment of the SNPs in enhancer regions (p = 0.001), as well as DNase I footprint regions (p < 0.001). This suggests that the disruption of regulatory factor binding might be involved in the disease mechanism. For that reason, we annotated epistatic SNPs using regulatory element information, including promoters, as well as enhancers (see Methods). We also proved that the assigned genes were enriched in each known disease-associated gene set (Table 3).
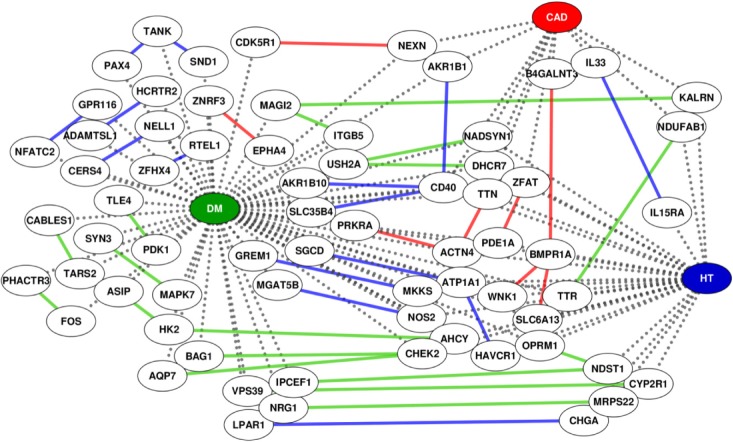
We built a knowledge-based epistatic network. We discovered that the diseases share many associated genes and also have a number of epistatic interactions within and between genes involved in each disease (Fig. 4). For a detailed list, see the Supplementary Table 4.
For example, we detected an epistatic interaction effect between atypical protein kinase C isotype-specific interacting protein (ASIP) and hexokinase II (HK2) in DM. Previous studies have reported that overexpression of ASIP inhibits insulin-induced glucose uptake [13], and HK2 plays a central role in glucose metabolism [14]. Our result implies that gene pairs, such as ASIP and HK2, could boost the incidence of DM through epistatic interactions. We also detected several significant epistatic interaction effects in CAD and HT between several DM-associated gene pairs. This finding could provide a genetic basis for the increased prevalence of CAD and HT in diabetic patients.
Discussion
In this paper, we carried out a genomewide epistasis analysis to understand the comprehensive genetic relationships between DM, HT, and CAD in a Korean cohort. For systematic annotation, we employed whole-genome multiple-cell-type enhancer data, because the majority of detected epistatic SNPs was located in non-coding regions. Our enrichment analysis in regulatory DNA regions identified substantial variants that might affect transcriptional regulatory function through disruptions of promoter or enhancer elements where regulatory factors bind. We confirmed that the genes that were discovered using the non-coding element are statistically enriched in known genes involved in the diseases, which suggests that this annotation method is considerably relevant. We found that the diseases shared many associated genes, implying their inseparable relationship. A large number of epistatic interactions were also intricately connected between genes involved in DM, HT, and CAD. This integrated map, based on epistatic interactions, could provide a genetic basis for the underlying mechanisms of the increased prevalence of the diseases' dependence on one another. In conclusion, our results illustrate how extensive non-coding variant annotation based on chromatin interactions of distal enhancers can be used to dissect complex genetic interactions in complex diseases.