In silico Identification of SFRP1 as a Hypermethylated Gene in Colorectal Cancers
Article information
Abstract
Aberrant DNA methylation, as an epigenetic marker of cancer, influences tumor development and progression. We downloaded publicly available DNA methylation and gene expression datasets of matched cancer and normal pairs from the Cancer Genome Atlas Data Portal and performed a systematic computational analysis. This study has three aims to screen genes that show hypermethylation and downregulated patterns in colorectal cancers, to identify differentially methylated regions in one of these genes, SFRP1, and to test whether the SFRP genes affect survival or not. Our results show that 31 hypermethylated genes had a negative correlation with gene expression. Among them, SFRP1 had a differentially methylated pattern at each methylation site. We also show that SFRP1 may be a potential biomarker for colorectal cancer survival.
Introduction
The Encyclopedia of DNA Elements (ENCODE) project, launched in 2003 by the US National Human Genome Research Institute (NHGRI), has accelerated the study of various aspects of epigenetics [1], among which DNA methylation has been one of the most actively studied areas [2]. DNA methylation refers to the chemical conversion of a cytosine nucleotide in DNA to 5-methylcytosine by DNA methyltransferase. This phenomenon usually takes place at the genomic region where a cytosine is immediately followed by a guanine and where the dinucleotide is enriched more than expected from the G + C content of the genome. Such CpG islands (CGIs) are typically found in the promoter region of a gene, regulating its expression [3].
Tumor suppressor genes (TSGs), including DNA repair genes that repair DNA mismatch during DNA replication, maintain the normal activities of cells, preventing cancer development. On the other hand, their hypermethylation may repress their expression, influencing the development and growth of cancer cells. Moreover, TSG expression may cause gene silencing through the hypermethylation of CGIs, and such a paradigm opens up a new avenue of cancer diagnosis and treatment based on DNA methylation profiles [4].
In cancer cells, genes that play important roles in cell growth and differentiation, such as TSG, DNA repair genes, and apoptosis-related genes, show downregulation in expression due to hypermethylation in their promoter regions. For example, the expression of p16, a well-known TSG, is downregulated due to its promoter hypermethylation [5], and DNA repair genes, such as BRCA1 and hMLH1, are also hypermethylated, repressing their gene expression [6].
It appears that hypermethylation profiles in CGIs may be useful targets for cancer treatment. Some DNA methylation inhibitors have been used as anticancer agents, paving a new avenue for the development of anticancer therapeutics [7]. Gene expression profiles have been used in cancer diagnosis and prognosis, but mRNA levels usually fluctuate temporally or are greatly influenced by environmental cues, resulting in unstable diagnostic sensitivity. On the other hand, DNA hypermethylation can show high specificity and sensitivity in cancer diagnosis [8]. Furthermore, its molecular diagnosis is gaining more and more acceptance due to its availability through real-time and quantitative blood testing [9]. In this study, we surveyed colon cancer data to look for genes that show hypermethylation, and investigated their effects on patient survival.
Methods
Data
The Cancer Genome Atlas (TCGA), launched in 2009, aimed to analyze the genomic features through sequencing of about 30 different types of cancers. We downloaded the microarray datasets on gene expression and DNA methylation of colorectal cancer and normal samples from the following URL: https://tcga-data.nci.nih.gov/tcga/dataAccessMatrix.htm (the "Data Type" field was selected as "Clinical," "DNA Methylation," and "Expression-Genes"). There were 12 matched cancer/normal pairs of both data types, and these were defined as the discovery set. The microarray platforms were UNC_AgilentG4502A_07_3 and Illumina Infinium Human DNA Methylation 27 (Illumina, San Diego, CA, USA) for gene expression and DNA methylation, respectively. For the methylation data, the so-called M-value was calculated as the log2 ratio of the intensities of the methylated probe versus unmethylated one, and the beta-value was the ratio of the methylated probe intensity and the overall intensity, either methylated or unmethylated [9].
For the clinical outcome analysis, we downloaded an expanded dataset from the URL, totaling 524 samples (202 samples on the Illumina Infinium Human DNA Methylation27 platform and 322 samples on the Illumina Infinium Human DNA Methylation450 platform), and 419 samples with clinical information were used in the survival analysis. For these samples, we downloaded a text file on tumor stage, last contact days, and vital status.
Identification of hypermethylated and downregulated genes
The discovery dataset was used for gene selection. Illumina Infinium Human DNA Methylation27 level 2 data were screened for differentially methylated regions (DMRs), where the median M of the tumor samples was greater than +1 and that of the matched normal samples was less than -1 [9]. For each gene, the mean mRNA expression level in tumor samples was compared to that in normal samples. Genes showing at least 4-fold down-regulation were selected. DAVID (http://david.abcc.ncifcrf.gov/) was used for the functional annotation of the gene list.
Survival analysis
Survival analysis was undertaken with the survival package in R (version 2.13.0). Survival time was represented by the days since cancer diagnosis in the hospital until the last contact date. The survival time of the patients who were still alive at the last contact date were treated as censored. Kaplan-Meier survival plot and Cox regression analysis were also performed with the survival package. In order to partition patients into two groups according to methylation level, the cutoff point was determined by the maximally selected rank statistics method, available in the R maxstat package.
Results and Discussion
Hypermethylated and downregulated genes in colorectal cancer
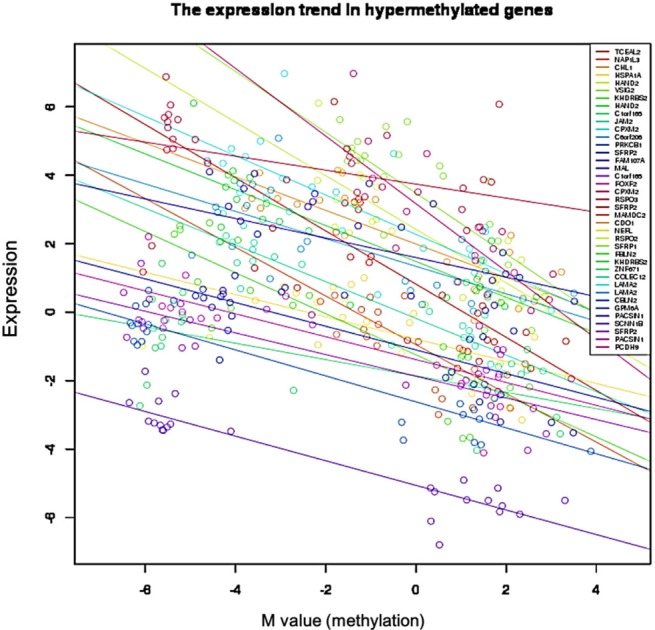
We used the discovery set (12 pairs of colorectal tumor and matched normal samples) to survey genes showing correlating differential DNA methylation and differential gene expression. All methylation probes (n = 27,578) were annotated by the name of the neighboring gene and were matched to the gene expression matrix. In order to look for the probes that were specifically hypermethylated only in tumors, we used the M-value of the methylation data; the median M of tumors (n = 12) was greater than 1, while the matched normal samples (n = 12) had a median M of less than -1. There were 634 such probes. We also identified 707 genes showing more than 4-fold downregulation in tumor samples compared to their matched normal samples. There were 31 genes that were shared by those two lists (Table 1). Fig. 1 shows the scatterplot of the mean differential methylation versus mean differential expression of these 31 genes (red points) on the background of 27,578 methylation probes (grey points). At the sample level, these 31 genes showed a negative correlation between methylation and expression (Fig. 2).
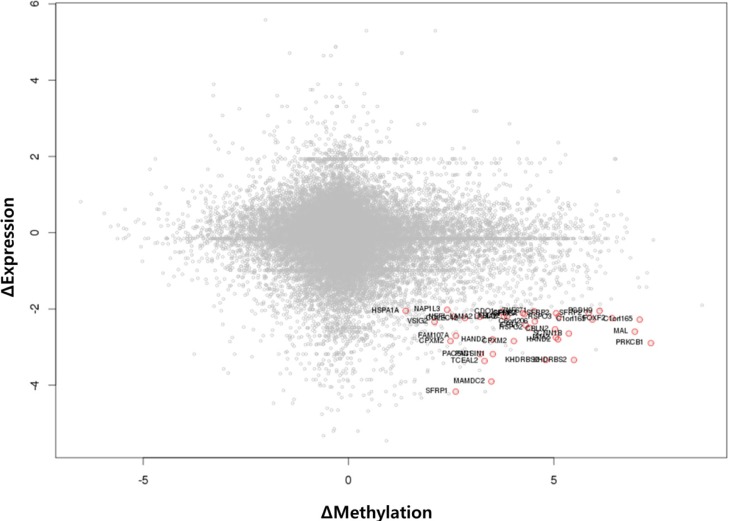
Scatterplot of differential methylation versus differential expression. A total of 27,578 methylation probes are plotted in grey, while those probes showing downregulated expression by 4-fold or more (Δ expression < -2) and methylation value (M value) change of +1 or more are plotted as red points.
Gene ontology and pathway analysis
Gene ontology analysis using DAVID revealed that the 31 genes were enriched in the Wnt receptor signaling pathway (Fisher exact = 9.6E-5); 4 genes-RSPO2, RSPO3, SFRP1, and SFRP2-belonged to this pathway (Table 2). Site of Frizzled proteins (SFRP) genes interact directly with Wnt, the ligand of the Wnt signaling pathway Frizzled (Fz) receptor, inhibiting the binding of Wnt to Fz receptor [10].
The Kyoto Encyclopedia of Genes and Genomes (KEGG) pathway diagram (http://www.genome.jp/kegg/) also confirmed that Wnt and SFRP regulate the Wnt signaling pathway at the upstream level (Fig. 3).
Wnt signaling pathway-related genes in colorectal cancer
Both the SFRP1 and SFRP2 genes are known to show DNA hypermethylation in colorectal cancers; their relatively low expression causes upregulation of Wnt signaling and thus tumor cell proliferation [11]. Wnt2, a member of the Wnt gene family, and SFRP1 showed drastically opposite gene expression patterns in the discovery dataset (Fig. 4). Given the premise that downregulation of SFRP1 and SFRP2 due to DNA hypermethylation deteriorates the inhibition of the Wnt ligand signaling pathway, we surveyed the gene expression profile of the pathway genes, including SFRP. The significance of the differential expression of each gene was measured by t test using the discovery dataset. The p-value distributions were compared between the genes involved in Wnt signaling (n = 151) and those that were not involved in Wnt signaling (n = 17,658) using Wilcoxon rank-sum test. The genes involved in Wnt signaling showed more significant differential expression than the others (p = 0.01658). SFRP1 and WNT2 were among the top ranked genes of the pathway (Fig. 5).
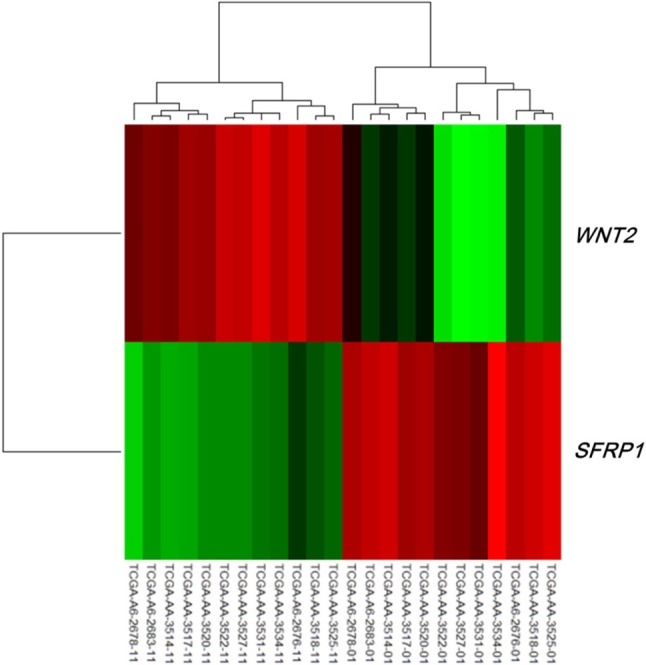
Heat map of WNT2 and SFRP1 in the discovery dataset. The 12 samples on the left are normal, while the 12 samples on the right are tumors.
DMR of SFRP1 gene in colorectal cancer
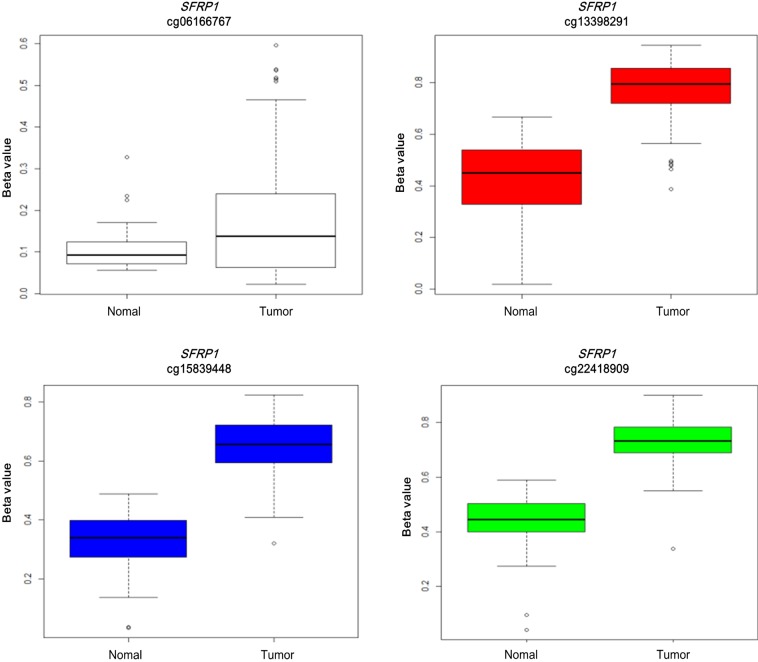
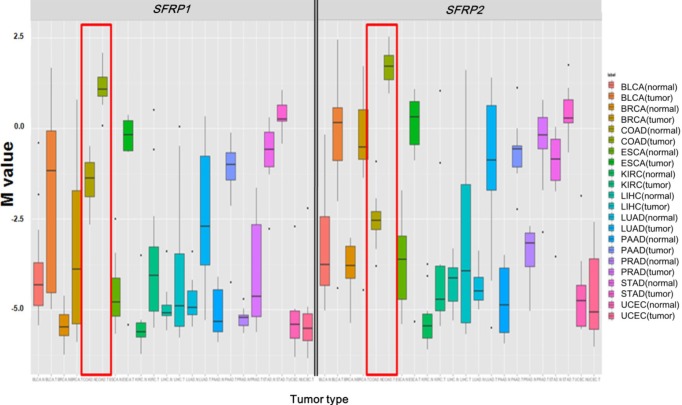
Illumina Human DNA Methylation27 and 450 are microarray platforms that can measure the methylation values of promoter regions, with 27,578 and 331,182 probes, respectively. On the former platform, there are four probes in the promoter region of SFRP1, and their methylation status varies probe to probe, while the latter has 33 additional probes for SFRP1. We examined which probes showed hypermethylation and correlated with expression change using the expanded dataset, for which both data types were available (n = 203). Among the four SFRP1 probes that were shared between the two platforms, one of them (cg06166767, chr8:41287005) did not show hypermethylation, while the other three showed similar hypermethylation (Fig. 6). Table 3 shows the correlation between differential methylation and differential expression, which was measured using linear regression, revealing a significant correlation of cg15839448 (chr8:41285687) (p = 0.1E-9). R/Bioconductor package methy Analysis was used to depict the chromosomal location in relation to CGI, along with the methylation beta-value, as a heat map (Fig. 7), confirming the variation among probes. Aberrant methylation patterns of SFRP have been reported not only in colorectal cancers but also in gastric cancers [12], breast cancers [10], and pancreatic cancers [13]. From TCGA, we downloaded 12 matched pairs for each cancer of the following organs: bladder, breast, esophageal, kidney, liver, lung, pancreas, prostate, stomach, and uterine corpus endometrium. Except for liver and endometrial cancers, the DNA methylation levels of both SFRP1 and SFRP2 were consistently higher in cancers than in the normal counterparts (Fig. 8). It should be noted that in colorectal cancers, the mean methylation M-value of the tumor samples was greater than 0. While stomach cancers (STAD) also showed a mean M of greater than 0, the difference between the tumor and normal sample was not as large as in colorectal cancers. In all other cancers, the mean M was below 0, implying marginal hypermethylation at most.

Methylation heat map of four SFRP1 probes. SFRP1 is marked by a vertical red line in the ideogram of chromosome 8, while tracks of CpG islands and exon-intron structures are shown. The heat map in methylation profile track shows the methylation beta-values of the four probes (cg06166767, cg13398291, cg15839448, and cg22418909 from left to right). Each row of the heat map represents one of the samples, which are ordered as shown by the The Cancer Genome Atlas (TCGA) sample codes. The last two digits of the TCGA sample codes represent sample types: "01" for tumor sample and "11" for matched normal.
Survival analysis: SFRP methylation in association with clinical factors
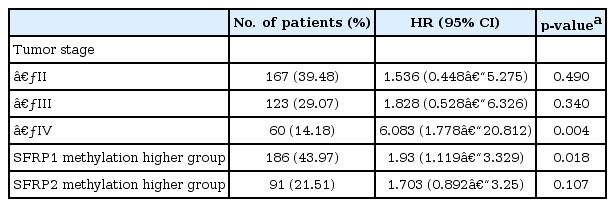
It is well known that the survival rate of colorectal cancer is negatively correlated with the tumor stage: the higher the stage, the poorer the survival. We confirmed this trend in the expanded dataset (n = 419). Stages IIA and IIB were merged into stage II, and similarly, stages IIIA, IIIB, and IIIC were merged into stage III. The Kaplan-Meier survival curves showed, as expected, lower survival for higher stages (Fig. 9). The Cox regression analyses also indicated a significant association of stage IV with survival rate (mean hazard ratio 6.083) (95% confidence interval [CI], 1.778 to 20.812; p = 0.004) (Table 4).
Upon confirming the anticipated survival trends by stage in the expanded dataset, we tested whether the methylation level of SFRP1 correlated with the survival rate. Among the four methylation probes, cg15839448 was chosen, as its methylation level showed the most consistent correlation with the expression level of SFRP1. In order to separate the samples into two groups that showed a survival difference according to SFRP1 methylation beta-values, we used maximally selected rank statistics, implemented in R (the maxstat package), yielding the cutoff point (beta-value = 0.598) (Fig. 10A). Similarly, cg23207990 was chosen for SFRP2, yielding the cutoff point (beta-value = 0.713) (Fig. 10B).
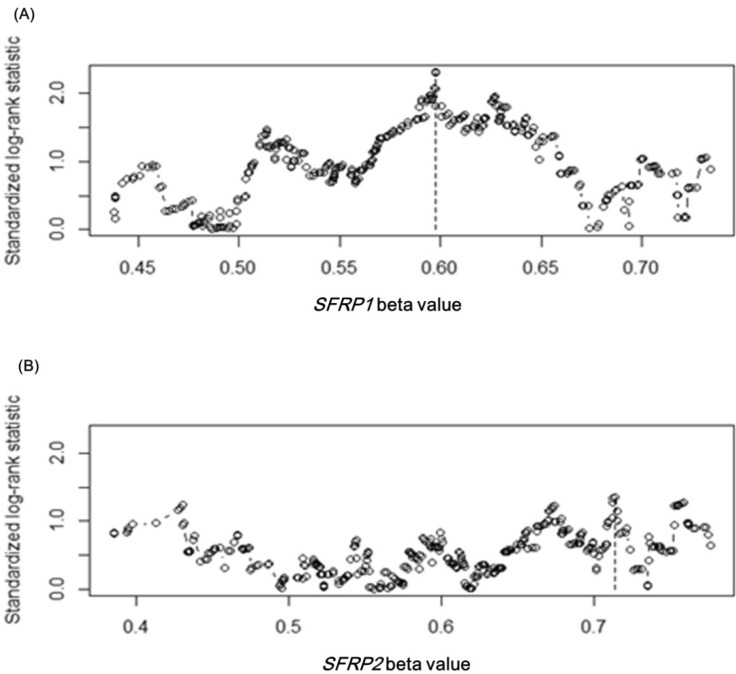
SFRP gene cutoff points by maximally selected rank statistic. The cutoff points are marked by vertical dotted lines at 0.598 and 0.713 for SFRP1 (A) and SFRP2 (B), respectively.
The group with highly methylated SFRP1 showed poorer survival than the other group (p = 0.0181) (Fig. 11A). On the other hand, SFRP2 methylation did not exhibit a significant relationship (p = 0.107) (Fig. 11B). The corresponding hazard ratios from the Cox regression analysis were 1.93 (95% CI, 1.119 to 3.329) and 1.703 (95% CI, 0.892 to 3.25) for SFRP1 and SFRP2, respectively (Table 4). As higher tumor stage shows a higher risk rate in the cumulative hazard curve (Fig. 12A), higher SFRP1 methylation also increases the risk rate (Fig. 12B).
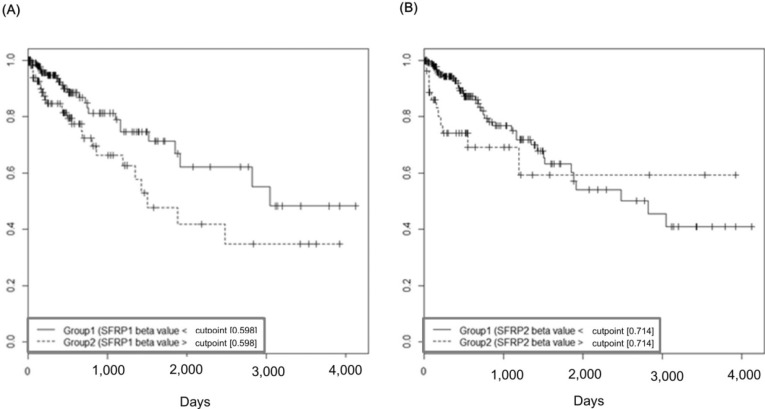
Survival curves of SFRP1 (A) and SFRP2 (B) by methylation beta-values. X-axis represents survival time in days.
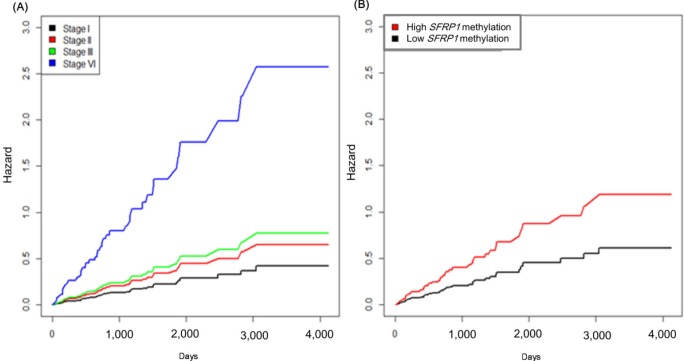
Cumulative hazard curve of colorectal cancer by stage (A) and SFRP1 methylation (B) values. X-axis represents survival time in days.
In conclusion, hypermethylation of SFRP genes has been linked to the downregulation of their expression in colorectal cancers [11]. Here, we confirm it using independent TCGA datasets. The evidence was stronger for SFRP1 but only marginal for SFRP2. We also demonstrate that promoter hypermethylation of SFRP1 is linked to poor survival of colorectal cancer patients.
Acknowledgments
This work was supported by the Industrial Strategic Technology Development Program, 10040231, "Bioinformatics platform development for next-generation bioinformation analysis," funded by the Ministry of Knowledge Economy (MKE, Korea).

