Genomics Inform Search

CLOSE


Genomics Inform > Volume 11(3); 2013 > Article
Park, Hwang, Go, Lee, Jang, Choi, Kang, Park, Choi, Song, Kim, and Lee: Genome-Wide Association Study of Liver Enzymes in Korean Children

Abstract

Liver enzyme elevations, as an indicator of liver function, are widely associated with metabolic diseases. Genome-wide population-based association studies have identified a genetic susceptibility to liver enzyme elevations and their related traits; however, the genetic architecture in childhood remains largely unknown. We performed a genome-wide association study to identify new genetic loci for liver enzyme levels in a Korean childhood cohort (n = 484). We observed three novel loci (rs4949718, rs80311637, and rs596406) that were multiply associated with elevated levels of alanine transaminase and aspartate transaminase. Although there are some limitations, including genetic power, additional replication and functional characterization will support the clarity on the genetic contribution that the ST6GALNAC3, ADAMTS9, and CELF2 genes have in childhood liver function.

Introduction

Plasma liver enzyme tests are broadly applied to predict biochemical liver functions and to diagnose liver diseases. Alanine transaminase (ALT) and aspartate transaminase (AST) are closely associated with hepatocyte damage and steatosis, including non-alcoholic fatty liver disease (NAFLD) [1]. Elevated liver enzyme levels, as prospective risk factors, have been reported to be involved in type 2 diabetes and coronary heart disease [2, 3]. However, alkaline phosphatase and gamma-glutamyltranspeptidase are related with biliary, cholestatic, and alcoholic diseases [4].
Overweightedness in childhood or adolescence is persistent in adulthood obesity and is closely associated with adverse health effects, including metabolic diseases [5]. A recent cohort study in Korean adolescents has shown strong associations of liver enzyme levels with a cluster of metabolic syndrome components [6]. Thus, finding genetic markers of liver enzyme levels in childhood would be important for early prediction of liver function and its related disease in adulthood.
Liver enzyme levels are affected by environmental and genetic factors. The heritabilities of liver enzyme levels range from approximately 35% to 61% [7, 8]. To date, two genome-wide association studies (GWASs) in European ancestry populations have identified genetic variants located in multiple genes associated with levels of ALT (HSD17B13-MAPK10, TRIB1, CHUK, and SAMM50), AST (NBPF3-ALPL), and both of them (CPN1 and PNPLA3) [9, 10]. In addition, a meta-analysis identified pleiotropic effects between NAFLD and metabolic traits, such as low-density lipoprotein, high-density lipoprotein, triglyceride, fasting glucose, and insulin resistance [11].
Despite the identification of novel genes or loci associated with liver enzymes in cohort populations, the common variants in childhood are still largely unknown. Here, we present findings from a GWAS in childhood subjects to identify new susceptibility loci for liver enzyme levels.

Methods

Study subjects

Students, aged between 8 and 13 years, were recruited from Gwacheon City and Kyunggi Province from April to June 2010. This study was performed as a part of the Korean Children-Adolescents Study (KoCAS), which has been monitored yearly since their entry into elementary school at age 7 in Gwacheon City or fourth grade at age 10 in Seoul and Gyeonggi Province, Korea. Subjects who were enrolled in a specific diet program or were taking any medications known to affect appetite were excluded from the study. AST and ALT levels were measured in the serum of each subject. The study protocol was approved by the institutional review board of Seoul Paik Hospital, Inje University, and the Korea Center for Disease Control and Prevention. Informed consent was obtained from the childrens' parents.

Genotyping and quality control

A total of 532 samples were genotyped using the Illumina HumanOmni1-Quad BeadChip (Illumina Inc., San Diego, CA, USA). Samples that revealed the following properties were excluded: genotyping call < 98%, heterozygosity > 30%, sex inconsistency, cryptic first-degree relative, or duplication. A total of 48 subjects were excluded from the sample QC process. Markers with a high missing call rate (> 5%), minor allele frequency < 0.01, and significant deviation from Hardy-Weinberg equilibrium (p < 1 × 10⁻⁶) were also excluded. The remaining 747,076 single nucleotide polymorphisms (SNPs) were used in subsequent analyses for association.

Association analyses

Genome-wide association was analyzed using the PLINK software (http://pngu.mgh.harvard.edu/~purcell/plink). The association between genotypes and concentration of liver enzymes in plasma was evaluated with linear regression analysis, controlling for age and body mass index (BMI) as covariates. The Manhattan plots of -log10 (p-value) were made using Haploview v. 4.2. The quantile-quantile plots were generated using R statistics package to assess the overall significance of the genome-wide associations.

Results

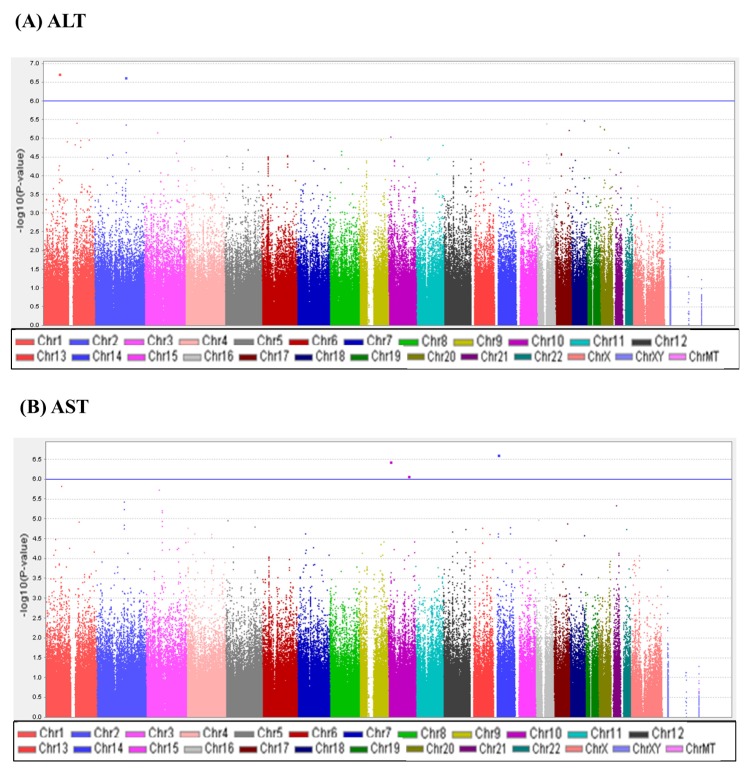
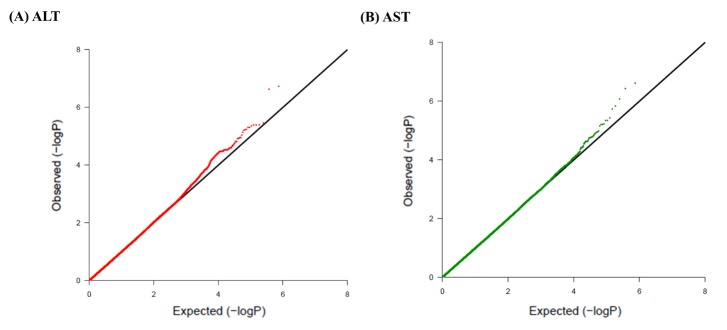
A total of 747,076 SNP genotype assays were tested on the DNA samples of 484 Korean childhood subjects. ALT and AST levels of the subjects according to age and sex are presented in Supplementary Table 1. Linear regression analyses were performed to estimate the p-values for the association between genotype distributions and levels of ALT and AST. Manhattan plots of association analyses of all SNPs with respect to ALT and AST are presented with the chromosomal positions (X-axis) and negative logarithm of p-values (Y-axis) of each SNP (Fig. 1). Quantile-quantile plots comparing the association p-values with those expected for a null distribution are also presented (Fig. 2). The highest-ranked SNPs showing the lowest p-values (p < 1.0 × 10⁻⁵) of association with ALT and AST levels are listed in Table 1. In addition, genotype clusters of the SNPs are presented in Supplementary Fig. 1.
Although there was no SNP satisfying the criteria of genome-wide significance (p < 1.0 × 10⁻⁸), we identified three loci (rs4949718, rs80311637, and rs596406 in ST6GALNAC3, ADAMTS9, and CELF2, respectively) that were suggestively associated with levels of ALT and AST. Of these SNPs, rs4949718 was found to be more strongly associated with ALT levels (p = 1.87 × 10⁻⁷) but less in AST levels (p = 1.49 × 10⁻⁶). The missense rs80311637 (V1597M) and intronic rs596406 SNPs were more strongly associated with an increased risk of AST than ALT.

Discussion

The levels of ALT and AST, known as transaminases, are important indicators for determining hepatocyte injury or hepatocellular diseases. However, ALT is known to be found in the highest level in the liver; thus, ALT levels are more liver-specific indicators [4]. Moreover, it has been reported that ALT levels are more significantly associated with a cluster of metabolic syndrome than AST levels in a Korean adolescent cohort study [6].
In this study, we identified three novel genes (ST6GALNAC3, ADAMTS9, and CELF2) that were multiply associated with elevated levels of ALT and AST. Of the three loci, rs4949718 in the intron region of ST6GALNAC3 yielded the lowest p-value for the association with ALT, compared to AST levels (Table 1). In addition, rs80311637 (ADAMTS9) and rs596406 (CELF2) were shown to be more strongly associated with AST levels, compared to ALT. These results indicate that the liver-specific feature of ALT was not driven as the secondary association for AST. In recent, a previous GWAS in an Amish population identified two genetic variants (rs17209512 and deletion) in glutamic-oxaloacetic transaminase 1 (GOT1) that were associated with serum AST. However, the rs17209512 SNP, which is in incomplete LD with rs76850691, was not replicated in our study (Table 1).
For the three multiply associated loci, we performed conditional analyses to test whether the association with the other trait was simply secondary to the primary association (Supplementary Table 2). In these analyses, the association signals on rs4949718 for AST and rs80311637 and rs596406 for ALT were abolished by adjustment of the ALT and AST, respectively. It is assumed that the multiple effects of these loci on ALT and AST resulted from the secondary effects by physiologically correlated features between ALT and AST [12]. In addition, when comparing with BMI-unadjusted data, the association signals in ALT were relatively weaker than those of the BMI-adjusted data. However, there was no significant difference in p-values before and after adjusting for BMI in AST (data not shown).
ST6GALNAC3 encodes a type of sialyltransferase that plays a role in the transfer of sialic acids from cytidine 5' monophospho-N-acetylneuraminic acid (CMP-NeuAc) to the carbohydrate termini of glycoproteins and glycolipids [13]. Previous GWASs have revealed the associations of ST6GALNAC3 SNPs with human electroencephalogram and nicotine dependence [14, 15]; however, there has been no report on an association with liver enzyme levels. Although the association with liver enzymes is still unknown, ST6GALNAC3 has been shown to be associated with subscapular skin-fold thickness, a type of obesity-related trait, in a Korean adult population [16]. Obesity affects elevated liver enzyme levels by inducing inflammatory responses in the liver, accompanied by increases in C-reactive protein [17]. The involvements between obesity and liver enzyme levels have been found in cohort studies [18-20]. Therefore, the association of ST6GALNAC3 with obesity may influence liver enzyme levels indirectly. In addition, ST6GALNAC3 protein interacts with α2-Heremans-Schmid glycoprotein (AHSG), which is also known as fetuin-A, by enzyme-substrate specificity [13]. AHSG is abundantly distributed in serum protein and is produced mainly in the liver, and elevated levels of this protein are associated with the risk of NAFLD [21]. Considering that liver enzyme levels are closely involved indicators in NAFLD [22, 23], the interaction with AHSG might induce an association between ST6GALNAC3 and liver enzyme levels.
ADAMTS9 is a metalloproteinase that plays a role in cleavage of proteoglycans and is expressed in skeletal muscle and pancreas [24]. ADAMTS9 has been reported as a type 2 diabetes susceptibility region in a GWAS [24]. This gene has also shown an association with insulin resistance and impaired beta-cell function in the pancreas [25]. Taken together, the association of ADAMTS9 with liver enzymes might be due to its susceptibility to diabetes and insulin resistance.
CELF2 (also known as CUGBP2) induces the skipping of exon 11 of insulin receptor (IR). The mRNA expression level of exon-skipped IR is significantly lower in liver than in other organs in mouse models [26]. It has been reported that a decrease in the number of IRs on target cells can cause insulin resistance [27]. Therefore, it is assumed that CELF2 affects liver enzyme levels by lowering expression of IR in liver that induces insulin resistance.
In summary, our data demonstrate new multiple associations with ALT and AST levels in a Korean childhood cohort. Further replication and functional studies remain to be done to clarify the genetic factors of liver dysfunction.

Acknowledgments

This work was supported by grants from the Korea Centers for Disease Control and Prevention (4845-301;4845-302), an intramural grant from the Korea National Institute of Health (2012-N73002-00).

Supplementary materials

Supplementary Information

Supplementary data including two tables and one figure can be found with this article online at http://www.genominfo.org/src/sm/gni-11-149-s001.pdf.
gni-11-149-s001.pdf

References

1. Li Y, Xing C, Cohen JC, Hobbs HH. Genetic variant in PNPLA3 is associated with nonalcoholic fatty liver disease in China. Hepatology 2012;55:327–328. PMID: 21898508.
crossref pmid pmc
2. Forlani G, Di Bonito P, Mannucci E, Capaldo B, Genovese S, Orrasch M, et al. Prevalence of elevated liver enzymes in Type 2 diabetes mellitus and its association with the metabolic syndrome. J Endocrinol Invest 2008;31:146–152. PMID: 18362506.
crossref pmid
3. Monami M, Bardini G, Lamanna C, Pala L, Cresci B, Francesconi P, et al. Liver enzymes and risk of diabetes and cardiovascular disease: results of the Firenze Bagno a Ripoli (FIBAR) study. Metabolism 2008;57:387–392. PMID: 18249212.
crossref pmid
4. Pratt DS, Kaplan MM. Evaluation of abnormal liver-enzyme results in asymptomatic patients. N Engl J Med 2000;342:1266–1271. PMID: 10781624.
crossref pmid
5. Must A. Does overweight in childhood have an impact on adult health? Nutr Rev 2003;61:139–142. PMID: 12795448.
crossref pmid
6. Lee K, Yang JH. Which liver enzymes are better indicators of metabolic syndrome in adolescents: the fifth Korea national health and nutrition examination survey, 2010. Metab Syndr Relat Disord 2013;11:229–235. PMID: 23451816.
crossref pmid
7. Bathum L, Petersen HC, Rosholm JU, Hyltoft Petersen P, Vaupel J, Christensen K. Evidence for a substantial genetic influence on biochemical liver function tests: results from a population-based Danish twin study. Clin Chem 2001;47:81–87. PMID: 11148181.
crossref pmid
8. Whitfield JB, Zhu G, Nestler JE, Heath AC, Martin NG. Genetic covariation between serum gamma-glutamyltransferase activity and cardiovascular risk factors. Clin Chem 2002;48:1426–1431. PMID: 12194918.
crossref pmid
9. Yuan X, Waterworth D, Perry JR, Lim N, Song K, Chambers JC, et al. Population-based genome-wide association studies reveal six loci influencing plasma levels of liver enzymes. Am J Hum Genet 2008;83:520–528. PMID: 18940312.
crossref pmid pmc
10. Chambers JC, Zhang W, Sehmi J, Li X, Wass MN, Van der Harst P, et al. Genome-wide association study identifies loci influencing concentrations of liver enzymes in plasma. Nat Genet 2011;43:1131–1138. PMID: 22001757.
crossref pmid pmc
11. Speliotes EK, Yerges-Armstrong LM, Wu J, Hernaez R, Kim LJ, Palmer CD, et al. Genome-wide association analysis identifies variants associated with nonalcoholic fatty liver disease that have distinct effects on metabolic traits. PLoS Genet 2011;7:e1001324. PMID: 21423719.
crossref pmid pmc
12. Kim YJ, Go MJ, Hu C, Hong CB, Kim YK, Lee JY, et al. Large-scale genome-wide association studies in East Asians identify new genetic loci influencing metabolic traits. Nat Genet 2011;43:990–995. PMID: 21909109.
crossref pmid
13. Tsuchida A, Ogiso M, Nakamura Y, Kiso M, Furukawa K, Furukawa K. Molecular cloning and expression of human ST6GalNAc III: restricted tissue distribution and substrate specificity. J Biochem 2005;138:237–243. PMID: 16169874.
crossref pmid
14. Hodgkinson CA, Enoch MA, Srivastava V, Cummins-Oman JS, Ferrier C, Iarikova P, et al. Genome-wide association identifies candidate genes that influence the human electroencephalogram. Proc Natl Acad Sci U S A 2010;107:8695–8700. PMID: 20421487.
crossref pmid pmc
15. Uhl GR, Liu QR, Drgon T, Johnson C, Walther D, Rose JE, et al. Molecular genetics of successful smoking cessation: convergent genome-wide association study results. Arch Gen Psychiatry 2008;65:683–693. PMID: 18519826.
crossref pmid pmc
16. Lee KT, Byun MJ, Kang KS, Park EW, Lee SH, Cho S, et al. Neuronal genes for subcutaneous fat thickness in human and pig are identified by local genomic sequencing and combined SNP association study. PLoS One 2011;6:e16356. PMID: 21311593.
crossref pmid pmc
17. Kerner A, Avizohar O, Sella R, Bartha P, Zinder O, Markiewicz W, et al. Association between elevated liver enzymes and C-reactive protein: possible hepatic contribution to systemic inflammation in the metabolic syndrome. Arterioscler Thromb Vasc Biol 2005;25:193–197. PMID: 15499043.
crossref pmid
18. Franzese A, Vajro P, Argenziano A, Puzziello A, Iannucci MP, Saviano MC, et al. Liver involvement in obese children. Ultrasonography and liver enzyme levels at diagnosis and during follow-up in an Italian population. Dig Dis Sci 1997;42:1428–1432. PMID: 9246041.
crossref pmid
19. Luyckx FH, Desaive C, Thiry A, Dewé W, Scheen AJ, Gielen JE, et al. Liver abnormalities in severely obese subjects: effect of drastic weight loss after gastroplasty. Int J Obes Relat Metab Disord 1998;22:222–226. PMID: 9539189.
crossref pmid
20. Sabuncu T, Nazligul Y, Karaoglanoglu M, Ucar E, Kilic FB. The effects of sibutramine and orlistat on the ultrasonographic findings, insulin resistance and liver enzyme levels in obese patients with non-alcoholic steatohepatitis. Rom J Gastroenterol 2003;12:189–192. PMID: 14502318.
pmid
21. Haukeland JW, Dahl TB, Yndestad A, Gladhaug IP, Løberg EM, Haaland T, et al. Fetuin A in nonalcoholic fatty liver disease: in vivo and in vitro studies. Eur J Endocrinol 2012;166:503–510. PMID: 22170794.
crossref pmid
22. Zain SM, Mohamed R, Mahadeva S, Cheah PL, Rampal S, Basu RC, et al. A multi-ethnic study of a PNPLA3 gene variant and its association with disease severity in non-alcoholic fatty liver disease. Hum Genet 2012;131:1145–1152. PMID: 22258181.
crossref pmid pmc
23. Sookoian S, Pirola CJ. Meta-analysis of the influence of I148M variant of patatin-like phospholipase domain containing 3 gene (PNPLA3) on the susceptibility and histological severity of nonalcoholic fatty liver disease. Hepatology 2011;53:1883–1894. PMID: 21381068.
crossref pmid
24. Zeggini E, Scott LJ, Saxena R, Voight BF, Marchini JL, Hu T, et al. Meta-analysis of genome-wide association data and large-scale replication identifies additional susceptibility loci for type 2 diabetes. Nat Genet 2008;40:638–645. PMID: 18372903.
crossref pmid pmc
25. Trombetta M, Bonetti S, Boselli ML, Miccoli R, Trabetti E, Malerba G, et al. PPARG2 Pro12Ala and ADAMTS9 rs4607103 as "insulin resistance loci" and "insulin secretion loci" in Italian individuals. The GENFIEV study and the Verona Newly Diagnosed Type 2 Diabetes Study (VNDS) 4. Acta Diabetol 2013;50:401–408. PMID: 23161442.
crossref pmid
26. Suzuki H, Takeuchi M, Sugiyama A, Alam AK, Vu LT, Sekiyama Y, et al. Alternative splicing produces structural and functional changes in CUGBP2. BMC Biochem 2012;13:6. PMID: 22433174.
crossref pmid pmc
27. Taylor SI, Kadowaki T, Kadowaki H, Accili D, Cama A, McKeon C. Mutations in insulin-receptor gene in insulin-resistant patients. Diabetes Care 1990;13:257–279. PMID: 1968373.
crossref pmid
Fig. 1
Manhattan plots of association results for alanine transaminase (ALT) and aspartate transaminase (AST) levels. Manhattan plots of the genome-wide analyses of association with ALT (A) and AST (B) are based on a total of 484 Korean children. Color scale of X-axis represents chromosomes, and negative logarithms of p-values are shown on the Y-axis.
gni-11-149-g001.jpg
Fig. 2
Quantile-quantile plots of association results for alanine transaminase (ALT) and aspartate transaminase (AST) levels in Korean children for 747,076 single nucleotide polymorphisms (SNPs). Quantile-quantile plots for ALT (A) and AST (B) AST are composed of X-axis and Y-axis indicate the negative log-scale of expected p-values of each SNP and the negative log-scale of the observed p-values, respectively. A straight line indicates the expected results under Hardy-Weinberg equilibrium.
gni-11-149-g002.jpg
Table 1.
Genetic loci associated with levels of ALT and AST at p < 1 × 10⁻⁵ in the GWAS of Korean children (n = 484)
Trait rs ID Chr Gene (Nearest gene) Position Class (AA change) A1/A2 MAF β (SE) p-value
ALT rs4949718 1 ST6GALNAC3 76672052 Intron A/G 0.402 0.053 (0.01) 1.87E-07
rs17801127 2 (MMADHC) 150272730 Intergenic A/G 0.030 0.154 (0.029) 2.37E-07
rs1539893 18 CCDC102B 64695735 Intron G/A 0.188 0.06 (0.013) 3.40E-06
rs12035879 1 RGS5 161409179 Intron A/G 0.419 0.048 (0.01) 3.97E-06
rs9941219 16 (BRD7) 48995029 Intergenic A/G 0.024 0.154 (0.033) 4.06E-06
rs731660 16 (BRD7) 48998709 Intergenic A/C 0.024 0.154 (0.033) 4.06E-06
rs12621256 2 GALNT13 154942564 Intron G/A 0.066 0.092 (0.02) 4.36E-06
rs6035126 20 (SIRPA) 1877542 Intergenic A/G 0.019 0.176 (0.038) 4.94E-06
rs13433286 20 (SIRPA) 1879500 Intergenic G/A 0.019 0.176 (0.038) 4.94E-06
rs844917 20 (CD93) 23089655 Intergenic A/G 0.041 0.111 (0.024) 5.64E-06
rs844914 20 (CD93) 23089445 Intergenic A/C 0.041 0.111 (0.024) 5.98E-06
rs903107 17 SLC39A11 68573529 Intron G/A 0.052 0.104 (0.023) 6.11E-06
rs80311637 3 ADAMTS9 64511688 CDS (V1597M) A/G 0.029 0.137 (0.03) 7.18E-06
rs596406 10 CELF2 11264671 Intron G/A 0.044 0.11 (0.024) 9.18E-06
AST rs862946 14 (CYB5AP5) 25558307 Intergenic A/G 0.112 0.043 (0.008) 2.41E-07
rs596406 10 CELF2 11264671 Intron G/A 0.044 0.067 (0.013) 3.69E-07
rs76850691 10 GOT1 101147428 CDS (Q370E) C/G 0.019 -0.099 (0.02) 8.55E-07
rs4949718 1 ST6GALNAC3 76672052 Intron A/G 0.402 0.026 (0.005) 1.49E-06
rs80311637 3 ADAMTS9 64511688 CDS (V1597M) A/G 0.029 0.078 (0.016) 1.85E-06
rs892877 2 THSD7B 137589817 Intron A/G 0.180 -0.032 (0.007) 3.75E-06
rs457603 21 (EIF4A1P1) 27579820 Intergenic G/A 0.033 -0.07 (0.015) 4.57E-06
rs452621 21 (EIF4A1P1) 27581267 Intergenic A/G 0.033 -0.07 (0.015) 4.57E-06
rs984295 2 THSD7B 137615223 Intron G/A 0.192 -0.031 (0.007) 5.86E-06
rs7617400 3 ROBO1 79686754 Intron A/G 0.161 0.034 (0.007) 6.16E-06
rs11924965 3 ROBO1 79693315 Intron A/G 0.161 0.034 (0.007) 6.16E-06
rs7644918 3 ROBO1 79728847 Intron C/A 0.166 0.033 (0.007) 6.97E-06

ALT, alanine transaminase; AST, aspartate transaminase; GWAS, genome-wide association study; Chr, chromosome; AA, amino acid; MAF, minor allele frequency; SE, standard error.


ABOUT
ARTICLE CATEGORY

Browse all articles >

BROWSE ARTICLES
FOR CONTRIBUTORS
Editorial Office
Room No. 806, 193 Mallijae-ro, Jung-gu, Seoul 04501, Korea
Tel: +82-2-558-9394    Fax: +82-2-558-9434    E-mail: kogo3@kogo.or.kr                

Copyright © 2024 by Korea Genome Organization.

Developed in M2PI

Close layer
prev next