Genomics Inform Search

CLOSE


Genomics Inform > Volume 11(3); 2013 > Article
Kim, Kwon, and Kim: Gene Set Analyses of Genome-Wide Association Studies on 49 Quantitative Traits Measured in a Single Genetic Epidemiology Dataset

Abstract

Gene set analysis is a powerful tool for interpreting a genome-wide association study result and is gaining popularity these days. Comparison of the gene sets obtained for a variety of traits measured from a single genetic epidemiology dataset may give insights into the biological mechanisms underlying these traits. Based on the previously published single nucleotide polymorphism (SNP) genotype data on 8,842 individuals enrolled in the Korea Association Resource project, we performed a series of systematic genome-wide association analyses for 49 quantitative traits of basic epidemiological, anthropometric, or blood chemistry parameters. Each analysis result was subjected to subsequent gene set analyses based on Gene Ontology (GO) terms using gene set analysis software, GSA-SNP, identifying a set of GO terms significantly associated to each trait (pcorr < 0.05). Pairwise comparison of the traits in terms of the semantic similarity in their GO sets revealed surprising cases where phenotypically uncorrelated traits showed high similarity in terms of biological pathways. For example, the pH level was related to 7 other traits that showed low phenotypic correlations with it. A literature survey implies that these traits may be regulated partly by common pathways that involve neuronal or nerve systems.

Introduction

Genome-wide association (GWA) studies are now well established for discovering hypothesis-free genetic loci whose variations are associated with a phenotype [1-4]. Downstream analysis of the study result in terms of gene sets is gaining popularity these days, as it facilitates biological interpretation of a GWA result [5].
The Korea Association Resource (KARE) project has collected epidemiological and genotype data from the regional cohorts in Ansung and Ansan, Korea [6]. A number of GWA studies based on this KARE data have been published so far [6-8]. We pursued re-analyses of these studies in terms of gene sets in a systematic way to warrant cross-comparisons of the traits. We mimicked the analysis conditions of the original published GWA works as much as possible, based on the de facto standard program PLINK [9]. For the gene set analysis, we used GSA-SNP software [10], an efficient Java-based application that accepts a list of single nucleotide polymorphisms (SNPs) and their association p-values and outputs the gene set p-values after multiple testing correction.
We applied this procedure to 49 baseline quantitative traits that were of epidemiological, anthropometric, or blood chemistry parameters. As expected, those traits that are known to share common biological mechanisms and to overlap in their population incidences indeed showed similar profiles of the significantly associated gene sets. To our surprise, some of the traits that were phenotypically uncorrelated in our study population and were seemingly unrelated to each other showed similar profiles of the significantly associated gene sets. Our results may demonstrate a useful strategy of discovering pleiotropy, which refers to a phenomenon of common pathways involved in distinct phenotypes.

Methods

Phenotype and genotype data

Details of the KARE study design have been reported [6]. Briefly, the genotype data were measured for a total of 10,038 residents in both Ansung and Ansan provinces, Korea, using Affymetrix Genome-wide Human SNP Array 5.0 chips (Affymetrix Inc., Santa Clara, CA, USA). After quality control, 352k SNP genotypes for 8,842 samples were used in the subsequent GWA analyses. The epidemiological trait data for these individuals were also received from the KARE project. Among a total of 49 quantitative traits, we took a logarithm of 5 trait values to balance the distribution.

GWA analyses

We used the imputed genotype data that comprised 1.8 million SNP markers [6]. GWA analyses of these 49 quantitative traits were performed by linear regression under the additive genetic model, as implemented in PLINK.

Gene set analyses

We performed GSA using the Gene Ontology (GO) databases, where only gene sets having 10-200 members (2,476 biological process GO terms) were used. We applied the Z-statistic method, as implemented in GSA-SNP [10], with the default options. Briefly, those SNPs residing inside or within 20 kb of the boundary of each gene were compiled, and the second best p-value was assigned to the gene. See Kwon et al. [11] for the rationale of using the second best p-value instead of the best p-value. The gene score was defined as the -log of the p-value assigned to the gene. The Z-statistic was then calculated for each gene set [10]. The p-values for each gene set were computed under the assumption of a normal distribution of the Z-statistic, followed by multiple testing correction using the false discovery rate method. When the member genes of a gene set overlapped in their genomic loci or were located in tandem within a short block of strong linkage disequilibrium, the p-values assigned to them might have been highly correlated. In such cases, only one of them was included to calculate the gene set score.

Semantic similarity between GO terms

The R package GOSemSim was developed to compute semantic similarity among GO terms, sets of GO terms, gene products, and gene clusters. This package contains functions to estimate the semantic similarity of GO terms based on Resnik's, Lin's, Jiang and Conrath's, Rel's, and Wang's methods. Here, we used Wang's method for our analysis. This method determines the semantic similarity of two GO terms based on both the locations of these terms in the GO graph and their relationships with their ancestor terms [12]. The similarity index between the two GO terms was between 0 (the least similar) and 1 (identical). The similarity between two sets of GO terms was calculated as follows. First, the highest value against all members of the other set was calculated for a given GO term in one of the sets. Then, all of these values were collected and averaged to provide the similarity between the two sets. The significance of the similarity index was inferred, based on the distribution of the indices from 106 random samplings.

Results and Discussion

Parallel and systematic GWA studies of a number of traits using a single genetic epidemiology dataset give a unique opportunity to explore common biological pathways regulating multiple traits that do not display phenotypic correlations. In this report, we focused on the 49 baseline quantitative trait data that were demographic, anthropometric, or blood chemistry parameters.
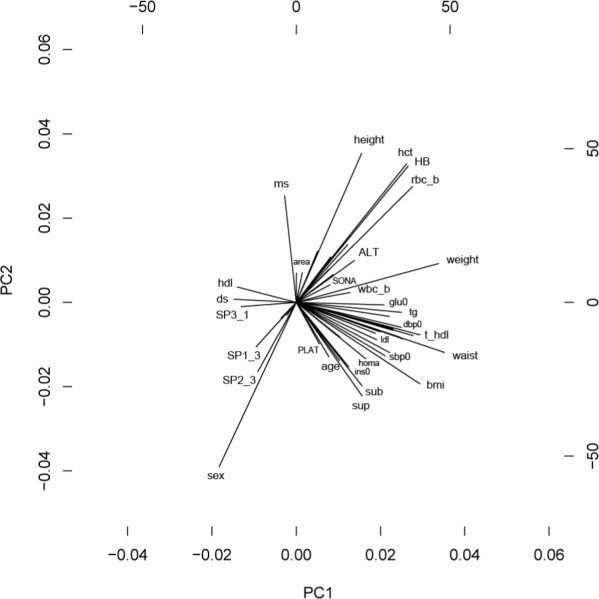
We surveyed the literature for the published GWA studies, based on the KARE data, and extracted the information on the analysis conditions, such as exclusion of samples and covariates of association regression. For the GWA analyses of all 49 traits, we included area, age, and sex as covariates, and for some of the traits, additional covariates were added, based on the literature information (Table 1). The phenotypic relations were also learned from principal component analysis (PCA). For example, the directions pointed by waist and body mass index (BMI) were similar in the PCA plot (Fig. 1); using BMI as one of the covariates for the analysis of waist. On the contrary, we used a literature guide for the analysis of BMI [13]. GWA analyses for all 49 traits were performed using linear regression, as implemented in PLINK, and the resulting SNP p-values were fed into GSA-SNP for gene set analysis.
For each of the 49 traits, we identified biological process GO terms that showed p < 0.05 after multiple testing correction (the lists are available upon request). As GO terms are hierarchically arranged, verbatim matches are not desirable for the comparison of a pair of gene sets. Instead, one should take into consideration the number of nodes in the GO tree that separate a pair of terms. For this, we used so-called semantic similarity, as implemented in the R package GOSemSim. For each pair of traits, we calculated the semantic similarity of the gene sets and plotted it against the correlation coefficient between the trait values (Fig. 2). The pairs showing semantic similarity greater than 0.8 corresponded to traits that had high correlations in the trait values. We also noted many pairs having high semantic similarity, despite low phenotypic correlation.
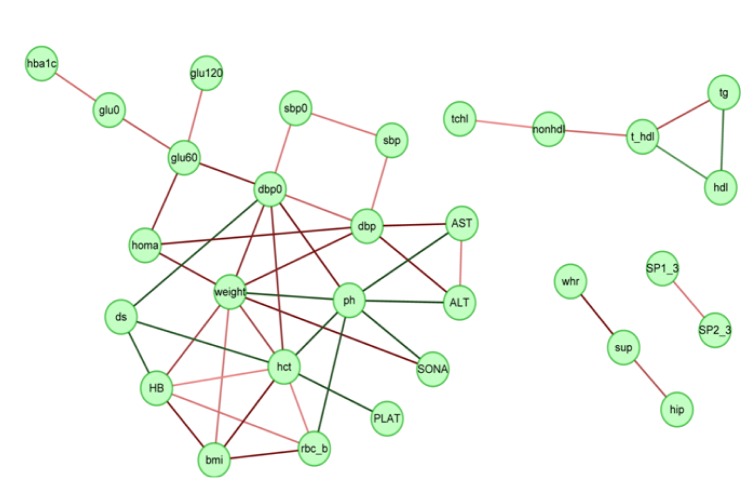
We selected 46 trait pairs that showed a semantic similarity in gene sets greater than an arbitrary cutoff of 0.75 and depicted the interaction network using Cytoscape (Fig. 3). The traits related to blood lipid levels, such as total cholesterol, high density lipoprotein cholesterol, low density lipoprotein cholesterol, and triglycerides (TGs), formed a small network by themselves. As cholesterol and TGs are components of lipoproteins, it is not surprising to observe such a network. Both hip and waist-hip ratio are connected to suprailiac skinfold; they are all related to body fat. The most striking feature is a large network involving 20 traits. In this network, the traits related to blood glucose levels, such as GLU0, GLU60, GLU120, HbA1c, and HOMA, form a subnetwork. In addition, the traits related to either blood pressure or liver damage also formed respective subnetworks, as expected from their high phenotypic correlations.
We also noted some hub nodes having many first neighbors. Interestingly, the pH level was connected to 7 other traits, none of which showed high phenotypic correlations with it. We examined the gene sets that were commonly shared between these traits (Table 2). Among them, 11 were related to neuron development and function. We surveyed the literature for putative involvement of neuronal or nerve systems in the regulation of those 8 traits (Table 3). Although it is presumptive, this may imply that these traits are regulated partly by common pathways that involve the neuronal system.
In conclusion, our work may be a useful approach for discovering pleiotropy.

Acknowledgments

The genotype and phenotype data were kindly provided by the Korea National Institute of Health, Centers for Disease Control and Prevention, the Republic of Korea.
The financial support of this work was made available by the Basic Science Research Program through the National Research Foundation of Korea (NRF), funded by the Ministry of Education, Science, and Technology (NRF-2010-0021811).

References

1. Levy D, Ehret GB, Rice K, Verwoert GC, Launer LJ, Dehghan A, et al. Genome-wide association study of blood pressure and hypertension. Nat Genet 2009;41:677–687. PMID: 19430479.
crossref pmid pmc
2. Ma L, Yang J, Runesha HB, Tanaka T, Ferrucci L, Bandinelli S, et al. Genome-wide association analysis of total cholesterol and high-density lipoprotein cholesterol levels using the Framingham heart study data. BMC Med Genet 2010;11:55. PMID: 20370913.
crossref pmid pmc pdf
3. Yamazaki K, Umeno J, Takahashi A, Hirano A, Johnson TA, Kumasaka N, et al. A genome-wide association study identifies 2 susceptibility loci for Crohn's disease in a Japanese population. Gastroenterology 2013;144:781–788. PMID: 23266558.
crossref pmid
4. Lettre G. Using height association studies to gain insights into human idiopathic short and syndromic stature phenotypes. Pediatr Nephrol 2013;28:557–562. PMID: 22941042.
crossref pmid
5. Schaid DJ, Sinnwell JP, Jenkins GD, McDonnell SK, Ingle JN, Kubo M, et al. Using the gene ontology to scan multilevel gene sets for associations in genome wide association studies. Genet Epidemiol 2012;36:3–16. PMID: 22161999.
crossref pmid pmc
6. Cho YS, Go MJ, Kim YJ, Heo JY, Oh JH, Ban HJ, et al. A large-scale genome-wide association study of Asian populations uncovers genetic factors influencing eight quantitative traits. Nat Genet 2009;41:527–534. PMID: 19396169.
crossref pmid
7. Lee BY, Cho S, Shin DH, Kim H. Genome-wide association study of copy number variations associated with pulmonary function measures in Korea Associated Resource (KARE) cohorts. Genomics 2011;97:101–105. PMID: 21059387.
crossref pmid
8. Hong KW, Min H, Heo BM, Joo SE, Kim SS, Kim Y. Recapitulation of genome-wide association studies on pulse pressure and mean arterial pressure in the Korean population. J Hum Genet 2012;57:391–393. PMID: 22475680.
crossref pmid
9. Purcell S, Neale B, Todd-Brown K, Thomas L, Ferreira MA, Bender D, et al. PLINK: a tool set for whole-genome association and population-based linkage analyses. Am J Hum Genet 2007;81:559–575. PMID: 17701901.
crossref pmid pmc
10. Nam D, Kim J, Kim SY, Kim S. GSA-SNP: a general approach for gene set analysis of polymorphisms. Nucleic Acids Res 2010;38:W749–W754. PMID: 20501604.
crossref pmid pmc
11. Kwon JS, Kim J, Nam D, Kim S. Performance comparison of two gene set analysis methods for genome-wide association study results: GSA-SNP vs i-GSEA4GWAS. Genomics Inform 2012;10:123–127. PMID: 23105940.
crossref pmid pmc
12. Yu G, Li F, Qin Y, Bo X, Wu Y, Wang S. GOSemSim: an R package for measuring semantic similarity among GO terms and gene products. Bioinformatics 2010;26:976–978. PMID: 20179076.
crossref pmid
13. Yang J, Loos RJ, Powell JE, Medland SE, Speliotes EK, Chasman DI, et al. FTO genotype is associated with phenotypic variability of body mass index. Nature 2012;490:267–272. PMID: 22982992.
crossref pmid pmc
14. Kiel DP, Demissie S, Dupuis J, Lunetta KL, Murabito JM, Karasik D. Genome-wide association with bone mass and geometry in the Framingham Heart Study. BMC Med Genet 2007;8(Suppl 1):S14. PMID: 17903296.
crossref pmid pmc
15. Kim J, Namkung J, Lee S, Park T. Application of structural equation models to genome-wide association analysis. Genomics Inform 2010;8:150–158.
crossref
16. Pyun JA, Kim S, Park K, Baik I, Cho NH, Koh I, et al. Interaction effects of lipoprotein lipase polymorphisms with lifestyle on lipid levels in a Korean population: a cross-sectional study. Genomics Inform 2012;10:88–98. PMID: 23105935.
crossref pmid pmc
17. Chen G, Bentley A, Adeyemo A, Shriner D, Zhou J, Doumatey A, et al. Genome-wide association study identifies novel loci association with fasting insulin and insulin resistance in African Americans. Hum Mol Genet 2012;21:4530–4536. PMID: 22791750.
crossref pmid pmc
18. Ryu J, Lee C. Association of glycosylated hemoglobin with the gene encoding CDKAL1 in the Korean Association Resource (KARE) study. Hum Mutat 2012;33:655–659. PMID: 22290723.
crossref pmid
19. Kong M, Lee C. Genetic associations with C-reactive protein level and white blood cell count in the KARE study. Int J Immunogenet 2013;40:120–125. PMID: 22788528.
crossref pmid
20. Kwon JS, Kim S. Comparison of erythrocyte traits among European, Japanese and Korean. Genomics Inform 2010;8:159–163.
crossref
21. Ro M, Kim S, Pyun JA, Shin C, Cho NH, Lee JY, et al. Association between arachidonate 5-lipoxygenase-activating protein (ALOX5AP) and lung function in a Korean population. Scand J Immunol 2012;76:151–157. PMID: 22537113.
crossref pmid
22. Woo J, Lee C. Genetic association of the gene encoding RPGRIP1L with susceptibility to vascular dementia. Gene 2012;499:160–162. PMID: 22425971.
crossref pmid
23. Lesch M, Nyhan WL. A familial disorder of uric acid metabolism and central nervous system function. Am J Med 1964;36:561–570. PMID: 14142409.
crossref pmid
24. Emanuel DA, Fleishman M, Haddy FJ. Effect of pH change upon renal vascular resistance and urine flow. Circ Res 1957;5:607–611. PMID: 13473056.
crossref pmid
25. Sandin B, Chorot P. Changes in skin, salivary, and urinary pH as indicators of anxiety level in humans. Psychophysiology 1985;22:226–230. PMID: 3991850.
crossref pmid
26. Morrison J, Wen J, Kibble A. Activation of pelvic afferent nerves from the rat bladder during filling. Scand J Urol Nephrol Suppl 1999;201:73–75. PMID: 10573780.
crossref pmid
27. Grassi G, Seravalle G, Colombo M, Bolla G, Cattaneo BM, Cavagnini F, et al. Body weight reduction, sympathetic nerve traffic, and arterial baroreflex in obese normotensive humans. Circulation 1998;97:2037–2042. PMID: 9610534.
crossref pmid
28. Spraul M, Ravussin E, Fontvieille AM, Rising R, Larson DE, Anderson EA. Reduced sympathetic nervous activity: a potential mechanism predisposing to body weight gain. J Clin Invest 1993;92:1730–1735. PMID: 8408625.
crossref pmid pmc
29. Judy WV, Watanabe AM, Henry DP, Besch HR Jr, Murphy WR, Hockel GM. Sympathetic nerve activity: role in regulation of blood pressure in the spontaenously hypertensive rat. Circ Res 1976;38(6 Suppl 2):21–29. PMID: 178466.
crossref pmid
30. Sundlöf G, Wallin BG. Human muscle nerve sympathetic activity at rest: relationship to blood pressure and age. J Physiol 1978;274:621–637. PMID: 625012.
crossref pmid pmc
31. Walicke P, Varon S, Manthrope M. Purification of a human red blood cell protein supporting the survival of cultured CNS neurons, and its identification as catalase. J Neurosci 1986;6:1114–1121. PMID: 3009731.
crossref pmid pmc
32. Woolf CJ, Mannion RJ. Neuropathic pain: aetiology, symptoms, mechanisms, and management. Lancet 1999;353:1959–1964. PMID: 10371588.
crossref pmid
33. Woodhull AM. Ionic blockage of sodium channels in nerve. J Gen Physiol 1973;61:687–708. PMID: 4541078.
crossref pmid pmc
34. Cestèle S, Catterall WA. Molecular mechanisms of neurotoxin action on voltage-gated sodium channels. Biochimie 2000;82:883–892. PMID: 11086218.
crossref pmid
35. Masui Y, Mozai T, Kakehi K. Functional and morphometric study of the liver in motor neuron disease. J Neurol 1985;232:15–19. PMID: 3998769.
crossref pmid
36. Shin'oka T, Shum-Tim D, Jonas RA, Lidov HG, Laussen PC, Miura T, et al. Higher hematocrit improves cerebral outcome after deep hypothermic circulatory arrest. J Thorac Cardiovasc Surg 1996;112:1610–1620. PMID: 8975853.
crossref pmid
37. Carlson ES, Tkac I, Magid R, O'Connor MB, Andrews NC, Schallert T, et al. Iron is essential for neuron development and memory function in mouse hippocampus. J Nutr 2009;139:672–679. PMID: 19211831.
crossref pmid pmc
Fig. 1
Principal component analysis of the phenotype values of 49 quantitative traits used in this study. See Table 1 for the trait abbreviations.
gni-11-135-g001.jpg
Fig. 2
Scatter plot of correlation coefficients versus biological process Gene Ontology semantic similarities (GOSemSim) between trait pairs. The red horizontal line marks the GOSemSim value at 0.75.
gni-11-135-g002.jpg
Fig. 3
Interaction network between traits based on biological process Gene Ontology semantic similarity. Pairs of traits having the semantic similarity greater than 0.75 are connected. On the other hand, the edge color represents the direction of phenotypic correlations (red and green for positive and negative correlations, respectively), and the brightness of the line represents the level of correlation (the brighter the higher correlation, and the darker the lower correlation).
gni-11-135-g003.jpg
Table 1.
List of the traits used in this work
Descriptiona Variableb Covariatec Referenced
Height height Area, age, sex Yang et al. [13]
Body mass index (BMI) bmi Area, age, sex Yang et al. [13]
Waist waist Area, age, sex, BMI Fig. 1
Hip hip Area, age, sex, height, BMI Kiel et al. [14]
Waist hip ratio whr Area, age, sex Fig. 1
Weight weight Area, age, sex Fig. 1
Systolic blood pressure (sitting position) sbp0 Area, age, sex, BMI Hong et al. [8]
Diastolic blood pressure (sitting position) dbp0 Area, age, sex, BMI Hong et al. [8]
Systolic blood pressure (lying position) sbp Area, age, sex, BMI Hong et al. [8]
Diastolic blood pressure (lying position) dbp Area, age, sex, BMI Hong et al. [8]
Subscapular sub Area, age, sex Kim et al. [15]
Suprailiac sup Area, age, sex Kim et al. [15]
Pulse rate pllie Area, age, sex, BMI Hong et al. [8]
Distal radius SOS (for bone density measure) ds Area, age, sex, height Fig. 1
Midshaft tibia SOS (for bone density measure) ms Area, age, sex, height Fig. 1
High density lipoprotein cholesterol hdl Area, age, sex, BMI Pyun et al. [16]
Total cholesterol tchl Area, age, sex, BMI Pyun et al. [16]
Triglyceride tg Area, age, sex, BMI Pyun et al. [16]
Low density lipoprotein cholesterol ldl Area, age, sex, BMI Pyun et al. [16]
Total cholesterol-HDL nonhdl Area, age, sex, BMI Fig. 1
Total cholesterol/HDL t_hdl Area, age, sex, BMI Fig. 1
Fasting blood glucose glu0 Area, age, sex Cho et al. [6]
Blood glucose (OGTT after 60 min) glu60 Area, age, sex Cho et al. [6]
Blood glucose (OGTT after 120 min) glu120 Area, age, sex Cho et al. [6]
Fasting blood insulin ins0 Area, age, sex, BMI Chen et al. [17]
Blood insulin (OGTT after 60 min) ins60 Area, age, sex, BMI Chen et al. [17]
Blood insulin (OGTT after 120 min) ins120 Area, age, sex, BMI Chen et al. [17]
Glycosylated hemoglobin hba1c Area, age, sex, BMI Ryu and Lee [18]
White blood cells wbc_b Area, age, sex, BMI Kong and Lee [19]
Red blood cells rbc_b Area, age, sex, BMI Kwon and Kim [20]
Sodium SONA Area, age, sex, BMI Fig. 1
Potassium POTA_K Area, age, sex, BMI Fig. 1
Chloride CHL_CI Area, age, sex, BMI Fig. 1
Hemoglobin (Hb) HB Area, age, sex, BMI Kwon and Kim [20]
C-reactive protein CRP Area, age, sex, BMI Kong and Lee [19]
Renin RENIN Area, age, sex, BMI Fig. 1
Platelet PLAT Area, age, sex, BMI Fig. 1
Spirometry (FVC_%PRED) SP1_3 Area, age, sex, BMI, height Ro et al. [21]
Spirometry (FEV1_%PRED) SP2_3 Area, age, sex, BMI, height Ro et al. [21]
Spirometry (FEV1/FVC_PRED) SP3_1 Area, age, sex, BMI, height Ro et al. [21]
AST AST Area, age, sex Woo and Lee [22]
ALT ALT Area, age, sex Woo and Lee [22]
r-GTP r_gtp Area, age, sex Fig. 1
Homa homa Area, age, sex, BMI Fig. 1
Blood urea nitrogen bun Area, age, sex, BMI Fig. 1
Creatine creatn Area, age, sex, BMI Fig. 1
Hematocrit hct Area, age, sex, BMI Kwon and Kim [20]
Urine/pH ph Area, age, sex, BMI Fig. 1
Urine-specific gravity sg Area, age, sex, BMI Fig. 1

SOS, speed of sound; HDL, high density lipoprotein cholesterol; OGTT, oral glucose tolerance test; FVC, forced vital capacity; FEV1, forced expiratory volume in one second; AST, aspartate aminotransferase; ALT, alanine aminotransferase.

a The full description of the target trait of the genome-wide association study (GWAS);

b The abbreviation of the trait;

c The covariates used in the regression analysis;

d The original reference that reported the GWAS.

Table 2.
The biological Gene Ontology (GO) terms commonly associated with pH and its first neighbor traits in Fig. 3 GO category
GO category GO ID GO description No. of sharing traits
Nerve GO:0001764 Neuron migration 8
GO:0010975 Regulation of neuron projection development 8
GO:0021537 Telencephalon development 8
GO:0031644 Regulation of neurological system process 8
GO:0050804 Regulation of synaptic transmission 8
GO:0051969 Regulation of transmission of nerve impulse 8
GO:0007158 Neuron cell-cell adhesion 7
GO:0007612 Learning 7
GO:0008038 Neuron recognition 7
GO:0021543 Pallium development 7
GO:0050890 Cognition 7
GTPase GO:0035023 Regulation of Rho protein signal transduction 7
GO:0043087 Regulation of GTPase activity 7
GO:0043547 Positive regulation of GTPase activity 7
Molting cycle GO:0001942 Hair follicle development 7
GO:0022404 Molting cycle process 7
GO:0022405 Hair cycle process 7
Cell adhesion GO:0007156 Homophilic cell adhesion 8
GO:0010810 Regulation of cell-substrate adhesion 7
Others GO:0006816 Calcium ion transport 8
GO:0044089 Positive regulation of cellular component biogenesis 8
GO:0051899 Membrane depolarization 8
GO:0007626 Locomotory behavior 7
GO:0008037 Cell recognition 7
GO:0034330 Cell junction organization 7
GO:0007215 Glutamate receptor signaling pathway 7
Table 3.
Literature evidence of neuronal systems regulating pH and its first neighbor traits in Fig. 3
Shared traits Title of the reference Reference ID
Urine/pH A familial disorder of uric acid metabolism and central nervous system function [23]
Effect of pH change upon renal vascular resistance and urine flow [24]
Changes in skin, salivary, and urinary pH as indicators of anxiety level in humans [25]
Activation of pelvic afferent nerves from the rat bladder during filling [26]
Weight Body weight reduction, sympathetic nerve traffic, and arterial Baroreflex in obese normotensive humans [27]
Reduced sympathetic nervous activity: a potential mechanism predisposing to body weight gain [28]
Diastolic blood pressure Sympathetic nerve activity: role in regulation of blood pressure in the spontaneously hypertensive rat [29]
Human muscle nerve sympathetic activity at rest; relationship to blood pressure and age [30]
Red blood cells Purification of a human red blood cell protein supporting the survival of cultured CNS neurons, and its identification as catalase [31]
Sodium Neuropathic pain: etiology, symptoms, mechanisms, and management [32]
Ionic blockage of sodium channels in nerve [33]
Molecular mechanisms of neurotoxin action on voltage-gated sodium channels [34]
AST/ALT Functional and morphometric study of the liver in motor neuron disease [35]
Hematocrit Higher hematocrit improves cerebral outcome after deep hypothermic circulatory arrest [36]
Iron is essential for neuron development and memory function in mouse hippocampus [37]

CNS, central nervous system; AST, aspartate aminotransferase; ALT, alanine aminotransferase.

TOOLS
Share :
Facebook Twitter Linked In Google+
METRICS Graph View
  • 0 Crossref
  •    
  • 5,556 View
  • 67 Download
Related articles in GNI


ABOUT
ARTICLE CATEGORY

Browse all articles >

BROWSE ARTICLES
FOR CONTRIBUTORS
Editorial Office
Room No. 806, 193 Mallijae-ro, Jung-gu, Seoul 04501, Korea
Tel: +82-2-558-9394    Fax: +82-2-558-9434    E-mail: kogo3@kogo.or.kr                

Copyright © 2024 by Korea Genome Organization.

Developed in M2PI

Close layer
prev next