Genetic Risk Prediction for Normal-Karyotype Acute Myeloid Leukemia Using Whole-Exome Sequencing
Article information
Abstract
Normal-karyotype acute myeloid leukemia (NK-AML) is a highly malignant and cytogenetically heterogeneous hematologic cancer. We searched for somatic mutations from 10 pairs of tumor and normal cells by using a highly efficient and reliable analysis workflow for whole-exome sequencing data and performed association tests between the NK-AML and somatic mutations. We identified 21 nonsynonymous single nucleotide variants (SNVs) located in a coding region of 18 genes. Among them, the SNVs of three leukemia-related genes (MUC4, CNTNAP2, and GNAS) reported in previous studies were replicated in this study. We conducted stepwise genetic risk score (GRS) models composed of the NK-AML susceptible variants and evaluated the prediction accuracy of each GRS model by computing the area under the receiver operating characteristic curve (AUC). The GRS model that was composed of five SNVs (rs75156964, rs56213454, rs6604516, rs10888338, and rs2443878) showed 100% prediction accuracy, and the combined effect of the three reported genes was validated in the current study (AUC, 0.98; 95% confidence interval, 0.92 to 1.00). Further study with large sample sizes is warranted to validate the combined effect of these somatic point mutations, and the discovery of novel markers may provide an opportunity to develop novel diagnostic and therapeutic targets for NK-AML.
Introduction
Acute myeloid leukemia (AML), which is characterized by the rapid growth of abnormal myeloid cells in the marrow, is a highly malignant and cytogenetically heterogeneous type of cancer [1]. AML is categorized into three risk groups: favorable, intermediate, and unfavorable. AML with a normal karyotype (NK-AML) accounts for approximately 40% to 50% of adult patients and 25% of pediatric patients with AML and is composed of a heterogeneous group with an intermediate prognosis [2].
In the past few years, next-generation sequencing technologies have been developed rapidly in the field of cancer genomics [3, 4] and enabled a direct genome-wide association test for NK-AML at single-base resolution in an unbiased manner [5]. A comprehensive understanding of the genetic lesions is an important basis for developing personalized therapies for the treatment of NK-AML [6].
Ley et al. [5] carried out the first whole-genome association study for AML by using single-end whole-genome sequencing data and found 181 single nucleotide variations (SNVs), including 28 indels, nonsynonymous, and splicing sites (NPM1 and FLT3, respectively). Mardis et al. [7] performed paired-end whole-genome sequencing for cytogenetically normal AML, found seven nonsynonymous SNVs (nsSNVs), one splice site SNV, two indels in coding regions, and 52 somatic point mutations in conserved or regulatory genomic regions, and observed a 10% recurrence rate in the IDH1 mutation in 188 additional AML samples. In the following year, Ley et al. [5] carried out a case-control study of relapsed AML among patients who were reported in 2008. They found a one-base-pair deletion in the DNMT3A gene, which showed a recurrence risk of 22% in AML [8]. De Weer et al. [9] detected deletions within a chromosomal region of 7q35-q36, which contains the CNTNAP2 gene, in both Kasumi-3 and MUTZ-3 cell lines using high-resolution array comparative genomic hybridization (CGH). Particularly, Bejar et al. [10] identified novel associations between somatic mutations in two genes, ETV6 and GNAS, and both myelodysplastic syndrome (previously known as preleukemia) and AML using high-throughput genotyping technology. In the same year, Link et al. [11] identified a novel TP53 susceptibility mutation in AML patients through the use of whole-genome sequencing. Recent exome-sequencing studies found more than 60 susceptible variants, including indels and splicing site mutations, in AML patients [12]. However, to the best of our knowledge, none of the previous studies attempted to predict the risk of NK-AML by analyzing whole-exome sequencing data.
This study aimed to evaluate the effect of nsSNVs in 10 pairs of tumor and normal cells of NK-AML patients with whole-exome sequencing data. Finally, we developed genetic risk prediction models for NK-AML by creating genetic risk scores (GRS).
Methods
Whole-exome sequencing data analysis
A total of 20 DNA samples were obtained from 10 pairs of bone marrow (tumor) and germline (normal) cells collected from 10 NK-AML patients. We illustrated the workflow for whole-exome sequencing data analysis in Fig. 1. The raw reads in FASTQ file format were mapped to the human reference, which was developed by the 1,000 genome project (human_g1k_v 37.fasta), by using the Burrows-Wheeler aligner (BWA v 0.6.1), which generates SAM format files [13]. The SAM files were converted into binary format files (BAM) by samtools v0.2.6, which reduces the file size and improves computing efficiency [14]. The read group information of the sequencing machine was added to the head of the BAM files. The aligned sequences were sorted in the order of chromosomes by Picard v1.79 (http://picard.sourceforge.net) and went through a PCR duplicate marking process, which enables the Genome Analysis Toolkit (GATK) to ignore duplicates in subsequent processing [15]. Finally, the BAM files were indexed by bamtools v2.2.0 [16]. We performed a local realignment prior to recalibration, which gives the most accurate quality scores for each sample. Local realignment with known indel sites (Mills_and_1000G_gold_standard.indels.b37.vcf, 1000G_phase1.indels.b37.vcf) for each individual does not require multiple sample realignments, which demand extreme computational power. However, we carried out a local realignment with the matched tumor and normal samples together to prevent misalignment due to the differences between these two tissue types. Recalibration was performed with multiple known sites (dbSNV_137.b37, Mills_and_1000G_gold_standard.indels.b37.vcf, and 1000G_phase1.indels.b37.vcf), which may increase recalibration accuracy. We reduced the BAM file size to about 1/100 of the original file size by using the GATK tool, which saved variant calling time without losing any essential information. We used the UnifiedGenotyper of GATK for variant calling, followed by variant recalibration with known sites (hapmap_3.3.b37.vcf, 1000G_omni2.5.b37.vcf, dbsnp_137.b37.vcf, and Mills_and_1000G_gold_standard.indels.b37.vcf), and annotated by them using snpEff v2.0.57 [17].
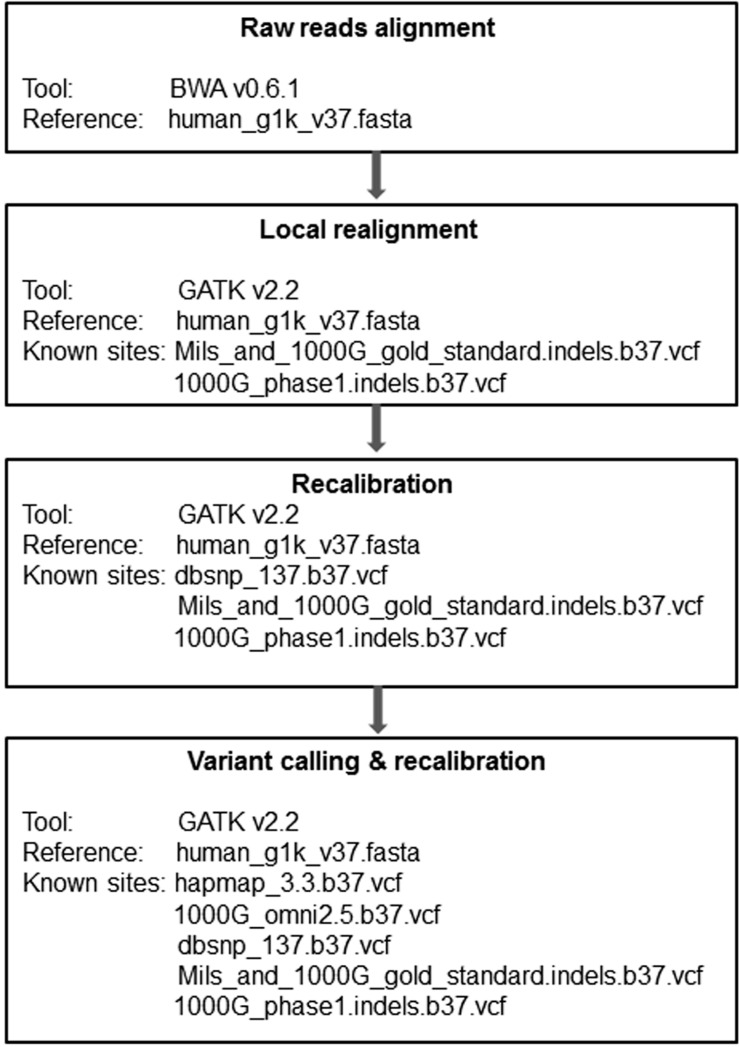
Next-generation sequencing data analysis workflow.
Statistical analysis
We performed logistic regression analyses between the somatic mutations and NK-AML using PLINK/SEQ v0.08 (http://atgu.atgu.mgh.harvard.edu/plinkseq), which provides powerful utilities in variant call format (vcf) for analyzing whole-exome and -genome data. Further, we verified the odd ratios and p-values estimated from PLINK/SEQ using Stata, v11.2 (Stata Corp., College Station, TX, USA).
We selected the somatic nsSNVs with complete call rates and evaluated the GRS models composed of the variants associated with NK-AML. The GRS was calculated for each individual by accumulating the number of risk alleles (0, 1, or 2) of the SNVs. We created stepwise GRS models, comprised of the selected SNVs, according to their significance level; if the significance level was equal between two or more SNVs, we selected the SNVs in the order of their chromosomal position. In addition, we evaluated a GRS model that consisted of gene variants reported in previous leukemia studies [9, 10, 18, 19]. We compared the area under the receiver operating characteristic curve (AUC) of each GRS model using the "roctab" and "roccomp" commands in Stata.
Results
The improvement in concordance between the empirical and reported quality scores of SNVs is shown in Fig. 2A. A significant improvement in the accuracy of quality scores after recalibration is shown in Fig. 2B. The association test for NK-AML yielded 42 SNVs that had a p-value of less than 0.05 and passed the quality threshold of PLINK/SEQ (data not shown). Among 42 SNVs, we excluded 11 SNVs with no rs ID, four SNVs with call rates less than 1, and five synonymous SNVs for subsequent analysis.

Base quality score recalibration. Raw reads (pink) and recalibrated (blue) base quality scores for a patient. Panel (A) compares the reported base quality scores to the empirical estimates. Panel (B) shows the difference between the average reported and empirical quality scores for each machine cycle.
A total of 21 nsSNVs located in 18 candidate genes were selected and included in the GRS models after considering pairwise linkage disequilibrium (Table 1). This study replicated three somatic mutations of the MUC4, CNTNAP2, and GNAS genes, which were reported in previous studies on leukemia [9, 10, 18, 19]. In addition, we identified novel point mutations in 15 other genes. The SNVs rs75156964 (ATP13A3; odds ratio [OR], 9.33; p = 0.013) and rs56213454 (GNAS; OR, 9.33; p = 0.013) showed the most significant evidence for association, and rs6604516 (PPIAL4G; OR, 21.00; p = 0.016) showed the strongest effect size among the 21 SNVs. Other SNVs also showed strong effects in the risk of NK-AML (OR, 9.33 to 13.5).
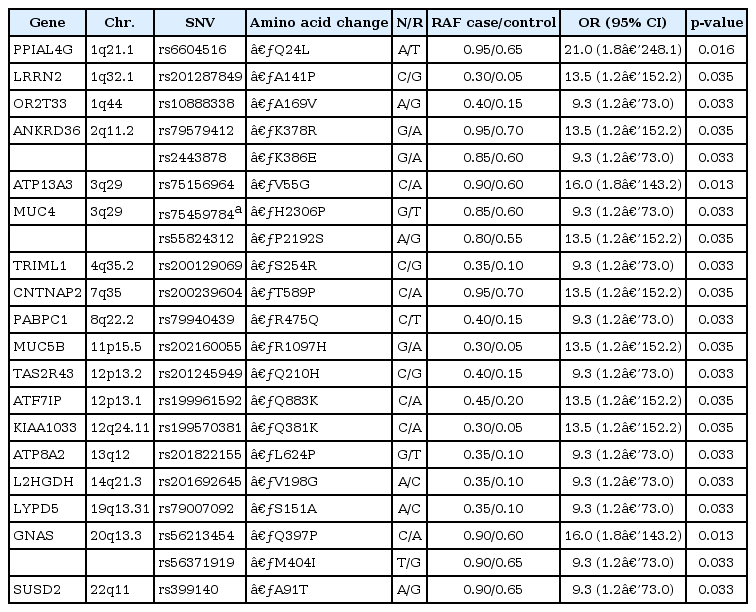
Associations between 21 SNVs and NK-AML in 10 pairs of tumor and normal samples
We compared the prediction accuracy of 21 stepwise GRS models. The predictive power for NK-AML reached 100% in model 5, which consisted of five nsSNVs: rs75156964 (ATP13A3, 3q29), rs56213454 (GNAS, 20q13.3), rs6604516 (PPIAL4G, 1q21.1), rs10888338 (OR2T33, 1q44), and rs2443878 (ANKRD36, 2q11.2) (Table 2, Fig. 3A). The five SNVs (rs75459784, rs55824312, rs200239604, rs56213454, and rs56371919) in three previously reported genes-MUC4, CNTNAP2, and GNAS-also showed a high AUC value (AUC, 0.98; 95% confidence interval [CI], 0.92 to 1.00).
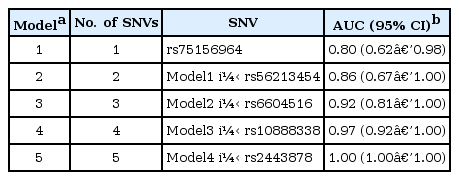
The area under the ROC curves for genetic risk score models consisting of SNVs
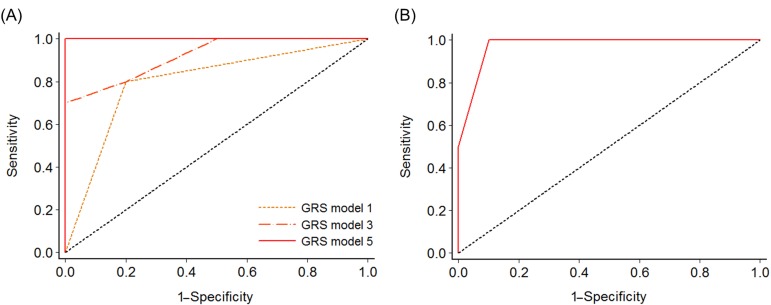
Receiver operating characteristic analysis to measure the discriminatory power of each genetic risk score model in predicting normal-karyotype acute myeloid leukemia. (A) Model 1 (rs75156964), model 3 (rs75156964, rs56213454, and rs6604516), and model 5 (rs75156964, rs56213454, rs6604516, rs10888338, and rs2443878). (B) A model comprising five candidate single nucleotide variations (rs75459784, rs55824312, rs200239604, rs56213454, and rs56371919) in MUC4, CNTNAP2, and GNAS, reported in previous studies (area under the receiver operating characteristic curve, 0.98; 95% confidence interval, 0.92 to 1.00). GRS, genetic risk score.
Discussion
We evaluated the effects of 21 nsSNVs of 18 candidate genes for NK-AML in this study. Among 18 genes, we replicated previously reported associations of two genes (CNTNAP2 and GNAS) with AML [9, 10]. The mutation in the MUC4 gene has been reported to be associated with acute lymphoblastic leukemia [18, 19]. The MUC4 gene encodes a mucin protein and a high-molecular-weight glycoprotein in humans. This integral membrane glycoprotein, which is observed on the cell surface, plays various roles in tumor progression [20]. Particularly, MUC4, complexed with v-erb-b2 erythroblastic leukemia viral oncogene homolog 2 (ERBB2), results in the repression of apoptosis and the stimulation of proliferation; in addition, the overexpression of MUC4 in carcinoma cells promotes loss of cellular polarity by ERBB2-mediated disruption [21]. The CNTNAP2 gene is one of the largest genes in the entire human genome and occupies approximately 1.5% of chromosome 7. This gene encodes a neurexin family member that functions in the vertebrate nervous system. The GNAS gene has a highly complex imprinted expression pattern. This gene provides instructions for making one component, the stimulatory alpha subunit, of a protein complex called a guanine nucleotide-binding protein (G-protein). G-protein alpha subunit regulates the cyclic AMP (cAMP) pathway. GNAS gene mutations are known to be associated with high cAMP signaling [22]. The novel associations between 15 somatic mutations (PPIAL4G, LRRN2, OR2T33, ANKRD36, ATP13A3, TRIML1, PABPC1, MUC5B, TAS2R43, ATF7IP, KIAA1033, ATP8A2, L2HGDH, LYPD5, and SUSD2) and NK-AML need to be replicated, and their functional mechanisms in the AML should be investigated in future studies.
The GRS models that were comprised of the somatic nsSNVs showed extremely high predictive accuracy for the risk of NK-AML (86% to 100%). The combination of five nsSNVs of previously reported genes (MUC4, CNTNAP2, and GNAS) had a predictive ability of 98% for the risk of NK-AML in this study. One of the limitations in this study was the small number of study subjects (n = 10), which resulted in substantial variations in the 95% CIs of the effects (ORs) of each SNV.
In conclusion, we have highlighted 21 susceptibility nsSNVs located in 18 genes. The GRS model that comprises five candidate SNVs is highly informative in predicting the risk for NK-AML. The discovery of novel markers may provide an opportunity to develop novel diagnostic and therapeutic targets for NK-AML. Further study with a larger sample size is necessary to validate the AML-related gene mutations and will provide an opportunity to develop a powerful genetic risk prediction model for NK-AML.
Acknowledgments
The sequence data for this study were provided by the National Project for Personalized Genomic Medicine (A111218-GM07) (PGM21 Project, A111218), Ministry for Health and Welfare, Republic of Korea.