Comparative Modeling and Molecular Dynamics Simulation of Substrate Binding in Human Fatty Acid Synthase: Enoyl Reductase and β-Ketoacyl Reductase Catalytic Domains
Article information
Abstract
Fatty acid synthase (FASN, EC 2.3.1.85), is a multi-enzyme dimer complex that plays a critical role in lipogenesis. This lipogenic enzyme has gained importance beyond its physiological role due to its implications in several clinical conditions-cancers, obesity, and diabetes. This has made FASN an attractive pharmacological target. Here, we have attempted to predict the theoretical models for the human enoyl reductase (ER) and β-ketoacyl reductase (KR) domains based on the porcine FASN crystal structure, which was the structurally closest template available at the time of this study. Comparative modeling methods were used for studying the structure-function relationships. Different validation studies revealed the predicted structures to be highly plausible. The respective substrates of ER and KR domains-namely, trans-butenoyl and β-ketobutyryl-were computationally docked into active sites using Glide in order to understand the probable binding mode. The molecular dynamics simulations of the apo and holo states of ER and KR showed stable backbone root mean square deviation trajectories with minimal deviation. Ramachandran plot analysis showed 96.0% of residues in the most favorable region for ER and 90.3% for the KR domain, respectively. Thus, the predicted models yielded significant insights into the substrate binding modes of the ER and KR catalytic domains and will aid in identifying novel chemical inhibitors of human FASN that target these domains.
Introduction
Fatty acid synthase (FASN, E.C. 2.3.1.85) is a multi-enzyme complex that synthesizes endogenous fatty acids. Seven cycles of FASN-catalyzed reactions result in the conversion of acetyl-CoA and malonyl-CoA into 16-carbon palmitate [1, 2] by the successive addition of 2-carbon units per synthesis cycle. Acyl carrier protein (ACP) holds the growing chain covalently and transports it sequentially to the active sites of β-ketoacyl synthase (KS), acetyl transacylase, malonyl transacylase, β-hydroxy acyl dehydratase, enoyl reductase (ER), β-ketoacyl reductase (KR), and finally thioesterase (TE), from which palmitate is cleaved by catalytic actions.
Two major forms of FASN are known: FASN type I (FASNI) and type II. FASNI is a multimeric multi-enzyme complex involved in the synthesis of palmitate in an integrative manner on a single polypeptide chain (α) or on two different polypeptides (α and β). FASNI is further subdivided into two subtypes. Animal FASN, which is a homodimeric protein (α2), is arranged head to tail [3], and the microbial subgroup FASN, which is an oligomer of higher order, consists of certain bacterial FASN type I α6 hexamers and of fungal α6β6 dodecomers [4]. Type II FASN consists of independent proteins that catalyze individual reactions and is present in bacteria, plants, and eukaryotic mitochondria [5].
Besides the important biochemical role that FASN plays in lipid biogenesis, this complex enzyme has been implicated in several pathological conditions. In comparison with normal cells, the overexpression of FASN has been reported in several types of cancers, including prostrate, breast, ovarian, and colon cancers [6, 7, 8], which strongly suggests the involvement of FASN in cancer progression. Similarly, FASN overexpression in ocular cancer and retinoblastoma and its potential as an anti-cancer target using enzyme inhibitors have been reported from our lab [9]. FASN is also indicated to have a potential role in the clinical management of microbial infections, obesity, and diabetes. This enzyme is a potential target to control bacterial infections by using agents, such as cerulenin and triclosan [10], and an anti-tumor target against different cancers [11] and is also targeted for the treatment of obesity [12, 13] and diabetes [14, 15]. It is therefore important to understand the structure of this multi-enzyme protein in order to suitably target its various catalytic domains. The resulting ligands could be potential therapeutic leads.
In this study, we have attempted to predict the 3D structure of the enoyl reductase (ER) and KR domains of human FASN in unbound form by comparative modeling. At the time of this model development, the structurally closest template was the reported crystal structure of porcine FASN (PDB ID: 2VZ8, 3.2 Å). This mammalian FASN template revealed a complex architecture, covering five catalytic domains and also the inter-connecting linkers [16]. The crystal structures of some of the other individual domains of human FASN were available in ligand-bound forms-MAT (PDB ID: 2JFK), ACP (PDB ID: 2CG5), and TE (PDB ID: 2PX6, 3TJM) and in apo forms-KS (PDB ID: 3HHD) and MAT (PDB ID: 2JFD). Most recently, crystal structures of human FASN domains-ligand-bound ER (PDB ID: 4W9N) and apo ER (PDB ID: 4W82)-and KR (PDB ID: 4PIV) have been reported.
In order to validate the biological closeness of the predicted in silico model and also to infer the structure-function relationships, the predicted structures here were computationally docked with their respective physiological substrates. Further, these structures were also subjected to molecular dynamics (MD) simulation in apo and holo conditions to understand the conformational dynamics and stability.
Methods
The amino acid sequences of the ER and KR domains of human FASN, were retrieved from Uniprot Kb/Swissprot server (uniprot ID: P49327). The sequences of the ER and KR domains were 229 and 255 amino acids in length, respectively. The retrieved sequences were BLAST-analyzed against PDB towards identifying suitable templates for homology modeling. From the available crystal structures deposited in PDB during the time of this study (early 2014), the crystal structure of mammalian (porcine, Sus scrofa) fatty acid synthase (chain A, PDB ID: 2VZ8) showed the closest homology and was therefore used as the template for modeling the unbound ER and KR domains.
Homology modeling of ER and KR domains
The pairwise sequence alignments between the template and the targets (human ER and KR) were built using MODELLER 9v7 [17, 18]. Further, the aligned target-template file was used to generate homology models. A total of 100 initial models were generated for both the ER and KR domains. The qualities of these models were ranked based on discrete optimized protein energy (DOPE) score generated by MODELER 9v7 [17]. The models showing the lowest DOPE score was chosen as the best model. Further, these best models of the ER and KR domains were processed using the 'Protein Preparation Wizard' module of Schrodinger Suite (Schrödinger, LLC, New York, NY, USA) to correct the structural defects, to add and optimize hydrogen atoms, to assign bond orders, and also to selectively assign tautomerization and ionization states.
Model validation
The validations of structural geometric properties, like backbone conformation, and of the compatibility of residue interactions were performed using the Structural Analysis and Verification Server (SAVES; http://nihserver.mbi.ucla.edu/SAVES). The Ramachandran plot statistics determined by the PROCHECK program (analyzing the phi [Φ] and psi [ψ] torsion angles) were used to verify the backbone conformation and overall stereochemical quality of the protein structures. The non-bonded atomic interactions of refined structures were analyzed using the ERRAT program [19]. Based on the inferences from the Ramachandran plot and ERRAT predictions, further refinement of side chain and backbone atoms was performed using MODREFINER [20] and was subsequently loop-refined using MODELLER 9v7 scripts. Additionally, these models were again refined using the WHATIF program [21] to remove atomic clashes (bumps) by rotating the side chain torsion angles (chi1, chi 2, and chi 3). Finally, the quality and plausibility of the predicted 3D structures were validated using ProQ, a model quality assessment program developed by Wallner and Elofsson [22].
MD simulation of homology models
MD simulations for the modeled proteins were carried out using the Desmond program, an explicit solvent MD package (version 3.1, Desmond Molecular Dynamics System; D. E. Shaw Research, New York, NY, USA and version 3.1, Maestro-Desmond Interoperability Tools; Schrödinger) with inbuilt optimized potentials for liquid simulation (OPLS 2005) force field [23]. The correctness of the chemical structures provided to Desmond was ensured using Protein Preparation Wizard (macro models), Ligprep (chemical molecules), and Epik (ligand protonation states). The system was set up for simulation using a predefined water model (simple point charge, SPC) as solvent in a cubic box with periodic boundary conditions specifying the shape and size of box as 10 Å × 10 Å × 10 Å distance. The desirable electrically neutral system for simulation was built with 0.15 M NaCl (physiological concentration of monovalent ions) in 10 Å buffer using the system-built option. The relaxation of the system was achieved by implementing Steepest Descent and the limited-memory Broyden-Fletcher-Goldfarb-Shanno algorithms in a hybrid manner. The simulation was performed under NPT ensemble for 5 ns implementing the Berendsen thermostat and barostat methods. A constant temperature of 300 K was maintained throughout the simulation using the Nose-Hoover thermostat algorithm [24] and Martyna-Tobias-Klein Barostat algorithm [25] to maintain 1 atm of pressure, respectively. The short-range coulombic interactions were analyzed using a cut-off value of 9.0 Å using the short-range method. The smooth particle mesh ewald method [26] was used for handling long-range coulombic interactions. Tolerance value usually affects the accuracy of long-range interactions; therefore, a smaller value of 1e-9 is set for accurate computations implemented by the SHAKE algorithm. The final production run was carried out for 5 ns, and the trajectory sampling was done at an interval of 1.0 ps [23].
Binding pocket prediction
Site Map 2.6 (Schrödinger, LLC) was used to identify the active sites on the predicted models. Various countermaps were also generated to distinguish the hydrophobic and hydrophilic regions on the active site regions. Finally, the best binding pockets were ranked based on the Sitemap score.
Substrate docking and postdocking simulation
The substrates for the ER and KR domains-namely, the trans butenoyl and β-ketobutyryl groups-were sketched using the 2D draw tool (version 9.3, Maestro; Schrödinger, LLC). The optimal 3D structures of the sketched substrates were generated using Ligprep Module, which fixes ionization states, tautomers, and other stereochemical errors. The correct chiral forms of the optimized substrates were used for docking with the corresponding FASN domains.
Receptor grid files for glide docking were generated to cover the volume of the predicted active sites. Here, van der Waals radius is scaled to 1.0 with a partial cut-off of 0.25 to soften the potential for non-polar parts of a receptor, where other atoms are free of scaling. The receptor grid file and the prepared substrate were docked using Glide standard precision, where the ligand sampling was set to be flexible, ensuring the sample ring conformation and nitrogen inversions. Ligands were set to select only less than 300 atoms and less than 50 rotatable bonds with a van der Waals scaling factor of 0.8 with a partial cut-off of 0.15. Out of the 1,000 poses generated per docking run, 10 energetically favorable poses per ligand were selected. Glide score, an empirical docking scoring function that implements the OPLS 2005 force field, was used to infer the affinity and binding mode of the substrate. The best docked substrate conformation for the ER and KR (holo) domains was subjected to MD simulation for 5 ns, similar to that of the methods discussed for MD simulations of the apo form, except that maximum iterations of 2,000 steps were applied on solute heavy atoms alone with a convergence threshold as 1.0 kcal/mol/Å.
Results and Discussion
Target-template alignment
The amino acid sequences of the human FASN ER and KR domains were retrieved from Uniprot (P49327). Comparative modeling method was implemented to predict the structures of the ER and KR domains. The structural templates for modeling the query sequences were searched against PDB using BLASTP. Many of the hits obtained were similar to the query sequences, mainly representing the reductase families. The best templates were selected in accordance with the optimal pairwise alignment, sequence coverage, and sequence conservation. Accordingly, mammalian (porcine, Sus scrofa) fatty acid synthase (chain A) (PDB ID: 2VZ8, 3.2 Å resolution, region 1635 to 1860, 82% similarity) was chosen for ER. Similarly, the template chosen for the KR domain (porcine, Sus scrofa) showed significant homology (83% of sequence identity matching to region 1866 to 2117 of 2VZ8) and was used for modeling the KR domain.
Homology modeling
We had attempted to model the protein structure of human FASN ER domain earlier for the purpose of understanding its bonding interactions with the known inhibitor triclosan [27]. There was a close correlation between the inhibition constant (Ki) obtained from the in silico model and the experimentally obtained biochemical IC50. However, in the present study, we implemented advanced algorithms and MD simulations to provide a more refined and highly plausible structure, with more emphasis on the catalytic active site. As discussed above, the crystal structure of Sus scrofa FASN (PDB ID 2VZ8) was used as the template to model the 3D structures of the human ER and KR domains. The pairwise sequence alignment between the template and targets were built using MODELLER 9v7. The best models for the human ER and KR domains were chosen based on the lowest DOPE score. Further, these models were found to have similar secondary structures (folds and loops) when compared with that of the template. The backbone alignment score was generated using maestro (version 9.3, Maestro, Schrödinger, LLC), superimposing the respective templates. The alignment scores were found to be 0.27 for modeled human ER and 0.01 for modeled KR domain. In the postmodel development, we also compared our predicted structures with the very recently reported crystal structures of the human ER (4W82) and KR domains (4PIV) [28, 29], wherein the alignment scores were found to be 0.28 and 0.048 for modeled ER and KR, respectively. Generally, the lower alignment score (less than 0.7-0.8) is indicative of a good alignment and higher structurally identity, according to Yang and Honig [30]. Hence, taken together, all of these findings imply the predictive accuracy of the in silico methods implemented here.
The predicted structure of the human ER domain showed a Rossmann fold at region 1651 to 1794, which harbors a nucleotide binding cavity (1671 to 1688) and also overlapping substrate binding cavities at 1650-1653 and 1795-1863, as proposed by Maier et al. [16]. Similarly, the predicted structure of the KR domain showed a binding cavity at the region covering 1864 to 2117. The active cavity residue Lys1995 and the nucleotide binding residues 1886-1901 [16] were found to harbor the predicted binding cavity. The overall topology and secondary structure information of the ER and KR domains are shown in Figs. 1 and 2.
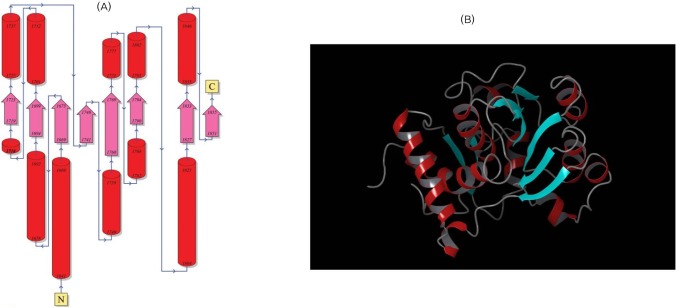
(A) Overall topology of the enoyl reductase (ER) domain from N to C terminus. (B) The 3D structure of the ER domain; helices are shown in red, beta sheets in cyan, and turns in green.

(A) Overall topology of the β-ketoacyl reductase (KR) domain from N to C terminus. (B) The 3D structure of the KR domain, with helices shown in red, beta sheets in cyan, and turns in green.
Secondary structure analysis
PDBsum server, which uses Gail Hutchinson's PROMOTIF program to compute the secondary structure motif information of the models generated (http://www.ebi.ac.uk/pdbsum/), was used to predict the topology of the predicted structures. The overall secondary structure elements of the ER domain include 18.8% of residues forming strands, 44.5% forming alpha helices, 0.9% forming 3-10 helices, and 35.5% of residues forming other structures. Similarly, secondary structure elements of the KR domain include 16.1% of residues forming strands, 35.7% forming alpha helices, 0.0% forming 3-10 helices, and 48.2% of residues forming other structures. The ER model has 2 beta-sheets, 5 beta-alpha-beta motifs, 1 beta bulge, 8 strands, 12 helices, 12 helix-helix interactions, and 10 beta turns. Similarly, the KR domain has 2 beta-sheets, 4 beta-alpha-beta motifs, 1 beta bulge, 9 strands, 7 helices, 5 helix-helix interactions, 19 beta turns, and 2 gamma turns.
Model validation
The initial models were subjected to different structure evaluation tools for understanding the geometries, backbone configuration, dihedrals, and residue-residue interactions. The Ramachandran plot for the ER domain showed 0.5% residues in a disallowed region. In the case of the KR domain, 0.0% of the residues were in disallowed regions. Hence, these models were further refined using the WHAT IF program to remove the atomic bumps and subsequently loop-refined using MODELLER 9v7 scripts and the MODREFINER algorithm. The final refined structures of both domains showed no residues in the disallowed region of the Ramachandran plot (Figs. 3 and 4).
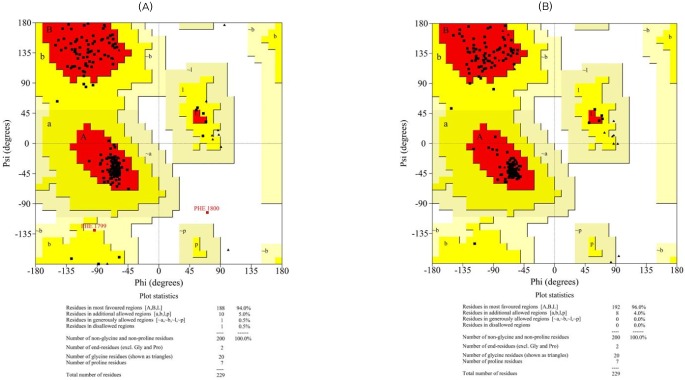
Ramachandran plots for the modeled enoyl reductase domain (A, before refinement; B, after refinement).
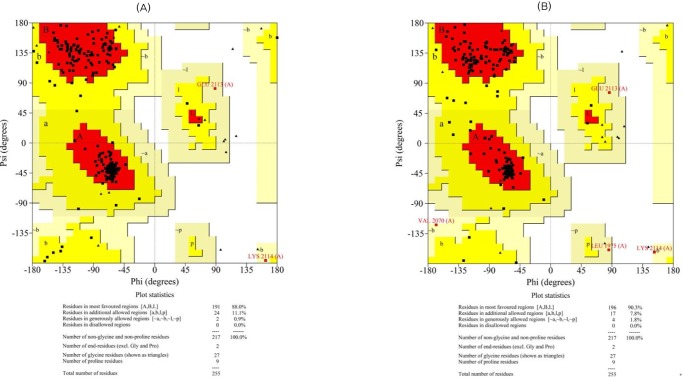
Ramachandran plots for the modeled β-ketoacyl reductase domain (A, before refinement; B, after refinement).
The overall stereochemical parameters for the modeled proteins were measured using G-factor and ERRAT calculations by PROCHECK. G-factor is a measure of the proper dihedrals and covalent bond orders, and it is expressed overall as log-odd score. G-factor scores for optimal structures range from 0.0 to 0.1 with increasing order of confidence. A negative G-factor score indicates improper conformation of the residues, while higher positive scores indicate proper conformation. In the case of the predicted model of the ER domain, the overall log-odd score was found to be 0.30, which indicates a high plausibility of the structure with negligible improper conformations. Similarly, the KR model also showed an overall G-factor score of 0.22, suggestive of a high plausibility of the structure. Moreover, the non-bonded atomic interactions of the models were analyzed using the ERRAT tool, wherein the overall quality score for the predicted structures of the ER and KR domains were found to be 95.92 and 80.85, respectively. The ERRAT scores for both models were above 50 and are considered a standard for good models. To validate this further, the modeled structures were also assessed for their quality using the ProQ server. ProQ assessment for the ER model predicted the LGscore to be 4.362 (>4.0, extremely good model) and the MaxSub score to be 0.416 (>0.1, fairly good model). Similarly, for the KR domain, the LGscore was 3.509 (>2.5, very good model) and the MaxSub score was 0.246 (>0.1, fairly good model), suggesting higher plausibility of the models.
MD simulation
MD simulation was carried out for the predicted models to understand the stability and conformational changes of the modeled proteins in holo and apo forms. The simulation was carried out in a water (SPC-molecule)-solvated system with optimal physiological conditions, wherein the temperature and pressure were maintained at 300 K and 1 atm for both the ER and KR domains. The computed total energy and potential energy remained stable from start of the dynamics simulation until the course of the the 5-ns simulation in the case of both proteins. The ER domain had a total energy of -82,181.468 kJ/mol and a potential energy of -101,788.978 kJ/mol. Similarly, KR also had stable distribution with a total energy of -141,285.655 kJ/mol and potential energy of -174,168.487 kJ/mol. The event trajectory was observed to remain stable throughout the simulation process. Further, the stability of the modeled proteins was verified by plotting the root mean square deviation (RMSD) graph for backbone atoms during the production run. The RMSD for the ER domain remained stable for the 5-ns time frame with minimal deviation until the end of 5 ns (Fig. 5A). Similarly, the RMSD plot for the KR model also suggested a stable trajectory during the production run (Fig. 6A). Moreover, the radius of gyration was also calculated for each model during the simulation process and was found to be within the range of 1 Å, indicating the compactness of the models predicted (Figs. 5B and 6B). Hence, these validation studies summarize the higher plausibility of the predicted models.
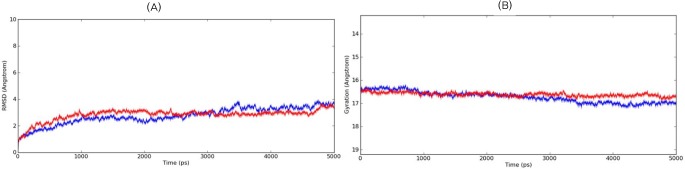
Time-dependent root mean square deviation (RMSD) (Å) and radius of gyration (Å) for the enoyl reductase model during 5-ns molecular dynamics simulation. (A) The RMSD trajectories of the backbone atoms for the apo-protein are shown in blue and the holo-protein in red. (B) The radius of gyration trajectories for the apo-protein are shown in blue and the holo-protein in red.

Time-dependent root mean square deviation (RMSD) (Å) and radius of gyration (Å) for the β-ketoacyl reductase model during 5 ns of molecular dynamics simulation. (A) The RMSD trajectories of the backbone atoms of the apo-protein are shown in blue and the holo-protein in red. (B) The radius of gyration trajectories for the apo-protein are shown in blue and the holo-protein in red.
Active site prediction
Site Map 2.6 (Schrödinger, LLC) was used to predict the active sites in the modeled proteins. The presently modeled human FASN ER domain comprises two subdomains forming the Rossmann fold and substrate binding fold. According to Maier et al. [16], on the porcine ER structure, NADP+ is likely to be found in the junction of the subdomains, and Lys1771 and Asp1797 may be donor residues for substrate protonation. This orientation favors the entry of substrate through a tunnel to the nicotinamide ring and its exit through an opening at the posterior part of the ER domain [16]. This fold orientation was observed in our predicted model of ER (Fig. 7). In the case of the KR domain, the predicted active site had Lys1995 as a central key substrate-interacting residue surrounded by Asn2038, Tyr2034, and Ser2021residues, which also coincides with the observations of Maier et al. [16] on porcine KR.
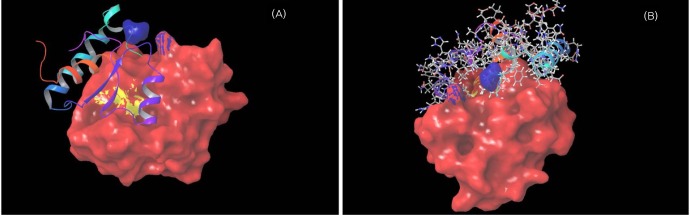
Molecular surface area of the enoyl reductase domain. (A) Red region shows the Rossmann fold; yellow region shows the nucleotide binding residues, and the blue region shows the two donor residues for protonation of the substrates (Lys1771 and Asp1797). (B) Depicts the tunnel through which the substrate moves into the next domain.
Docking and post-docking simulation
Normally, in FASN-catalyzed lipid biosynthesis, seven cycles of two carbon additions are essential for synthesizing the 16-carbon palmitate. The respective initial physiological substrates for the KR and ER domains-namely, β-ketobutyryl and trans butenoyl groups-were built using 2D draw. Further, these structures were optimized using LigPrep 2.6 (Schrödinger, LLC) and docked to the respective catalytic active sites using Glide 5.8 (Schrödinger, LLC) (Figs. 8 and 9). Reports suggest that in these β-carbon processing enzymes, KR and ER have been studied using derivatives of S-β-ketobutyryl and S-crotonyl (S-acyl-N-acetyl cysteamine thioester derivatives) as model substrates [3, 31]. The Glide docking score for the ER trans butenoyl complex was found to be -2.283 kcal/mol with a Glide energy of -11.638 kcal/mol. Similarly, the Glide docking score for the KR domain was found to be -5.25738 kcal/mol with a Glide energy of -16.827 kcal/mol.
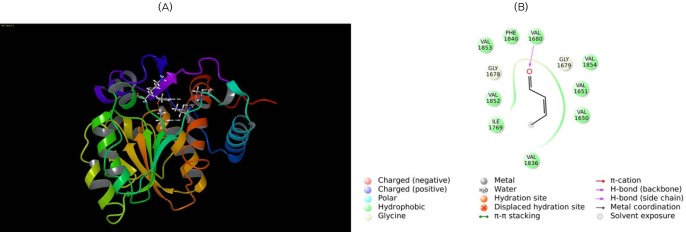
Molecular docking of enoyl reductase (ER) with its substrate. (A) Substrate trans butenoyl is docked to the ER domain. The substrate is shown in ball and stick form, the hydrogen bond is a dotted yellow line, and weak interactions are dotted orange lines. (B) 2D interaction map of trans butenoyl substrate with the ER domain. Amino acids are mentioned with 3 letter codes, and arrow indicates hydrogen bonding with Val1680.

Molecular docking of β-ketoacyl reductase (KR) with its substrate. (A) Substrate β-ketobutyryl is docked to the KR domain. The substrate is shown in ball and stick form, the hydrogen bond is a dotted yellow line, and weak interactions are dotted orange lines. (B) 2D interaction map of β-ketobutyryl substrate to the KR domain. Amino acids are mentioned with 3 letter codes, and arrow indicates hydrogen bonding with Ser2021 and Tyr2034.
Finally, both docked complexes were validated for the stability of complex formation, implementing a MD simulation using DESMOND. The simulations for both holoenzyme complexes were carried out for 5 ns. The RMSD plot for all atoms of each holoenzyme during the production run was analyzed. The plots showed no significant increase in deviation until the completion of 5 ns (Figs. 5A and 6A). Similarly, the radius of gyration was also calculated for the complex structures, which inferred the compactness of the docked complexes, as it was within the range of 1 Å in the case of both complexes.
Hence, all of these findings strongly suggest the highly stable complex formation of the ER and KR domains with their respective substrates (Figs. 5B and 6B). The root mean square fluctuation plot of all residues on pre-substrate binding and post-substrate binding (Fig. 10A and 10B) clearly indicates the decrease in overall flexibility of the residues in the holo condition of both the ER and KR domains.

Time-dependent root mean square fluctuation (RMSF) plots (Angstrom). (A) RMSF trajectory plot of enoyl reductase domain showing residue-wise fluctuation in apo (blue) and holo (red) conditions. (B) RMSF trajectory plot for β-ketoacyl reductase (KR) domain showing residue-wise fluctuation of KR domain in apo (blue) and holo (red) conditions.
Conclusion
Based on the in silico approaches employed in this study, the plausible stable homology models of the ER and KR domains of FASN protein are suggested, which are also found to be in substantial agreement with the reported crystal structures. Further, the favorable outcomes of substrate binding with the ER and KR domains validate the predicted structures and their potential for screening anti-FASN ligands. The insights from this in silico study would be very helpful in pharmacologic lead generation, as FASN inhibition is favorably implicated in the treatment of cancers, diabetes, obesity, and infections.
Acknowledgments
The work described in this article was supported by the Department of Biotechnology, Ministry of Science & Technology, New Delhi for program support on retinoblastoma (Project sanction order no: BT/01/CEIB/11/V/16, dated 08/05/2012).