Evaluation of 16S rRNA Databases for Taxonomic Assignments Using a Mock Community
Article information

Abstract
Taxonomic identification is fundamental to all microbiology studies. Particularly in metagenomics, which identifies the composition of microorganisms using thousands of sequences, its importance is even greater. Identification is inevitably affected by the choice of database. This study was conducted to evaluate the accuracy of three widely used 16S databases—Greengenes, Silva, and EzBioCloud—and to suggest basic guidelines for selecting reference databases. Using public mock community data, each database was used to assign taxonomy and to test its accuracy. We show that EzBioCloud performs well compared with other existing databases.
Introduction
Microbial identification is the key component to microbial community analysis. Considering that most recent data are generated from next-generation sequencing technology, correctly linking the sequences to microbial taxonomic information is fundamental to research in metagenomic studies. Despite the accumulation of genome sequences, 16S rRNA is still the standard for taxonomic identification. This is because current microbial taxonomies based on genomes have a number of limitations, including low phylogenetic resolution and a lack of absolute numbers. Compared with this usefulness, there are only a few public 16S databases available for microbial identification, because it requires a lot of effort to collect and maintain the most up-to-date taxonomic information. Since our knowledge is being constantly expanded through the sequencing of new strains and species, it is not easy to properly organize their taxonomic structure and verify the information in the known phylogeny. Public databases providing taxonomy are as follows: Greengenes (http://greengenes.secondgenome.com), Silva (https://www.arb-silva.de), and EzBioCloud (https://www.ezbiocloud.net); these three are currently being used extensively in amplicon sequencing analysis [1–3]. Greengenes is the most popular and widely used database, since it is the default database in the QIIME pipeline (http://qiime.org/index.html) [4]. It provides Bacterial and Archaeal taxonomy based on phylogenetic trees inferred from chimera-free, consistent multiple sequence alignments, but it has not been updated since May 2013. The Silva database contains taxonomic information for the domains of Bacteria, Archaea, and Eukarya based on phylogenies. Their taxonomic hierarchy and rank are constructed according to Bergey’s Taxonomic Outlines, List of Prokaryotic Names with Standing in Nomenclature (LPSN) and manual curation. The EzBioCloud 16S database provides information on Bacteria, Archaea, and Eukarya and is mainly designed for species-level identification. It consists of complete taxonomic hierarchy from phylum to species and covers validly published names from LPSN, Candidatus, potential species, and uncultured microbes. The database also contains 16S sequences derived from genome assemblies, which are of higher quality than PCR amplicon sequencing. Among these databases, it is not easy to conclude that one database is superior to others, because each has its advantages and disadvantages. Instead, this study attempts to provide a guideline for which 16S databases are more appropriate in amplicon-based metagenomic analysis. The accuracy of each database was assessed in terms of correctness and diversity using mock community data, wherein the composition of microorganisms is already known.
Methods
Mock community
The mock community data for evaluation were obtained from the European Nucleotide Archive (accession number: PRJEB6244) [5]. The data were generated so that 59 strains had uniform abundance, and they were used to validate biases and sequencing errors in the previous paper. In order to maintain the consistency of the data, only the six samples sequenced using the V3/V4 primer in the hypervariable regions of 16S rRNA were used (sample accession ERS447183, ERS447184, ERS447185, ERS447186, ERS447187, and ERS447188).
16S rRNA analysis
Illumina adapter sequences in paired end reads were removed by cutadapt, version 1.1.6 (https://cutadapt.readthedocs.io) [6]. The trimmed sequence pair was merged using CASPER, and the merged reads were filtered by the Phred (Q) score as described by Bokulich [7, 8]. After filtering, only reads with lengths of between 350 bp and 550 bp were used, because the reads that do not satisfy this criterion are either errors or artifacts. To identify chimeric sequences introduced by PCR or amplification, a reference-based chimera searching method was conducted using VSEARCH with the Silva gold database [9]. Next, the remaining reads were clustered into operational taxonomic units (OTUs) by open, closed, and de novo reference methods with three databases: Greengenes, Silva, and EzBioCloud. The representative sequences in each OTU cluster were finally assigned taxonomy with UCLUST, along with the three databases (parallel_assign_taxonomy_uclust.py script on QIIME version 1.9.1) under default parameters [4]. To measure the diversity of each sample, three alpha diversity indices—Chao1, Simpson’s evenness, and Shannon’s diversity—were estimated.
Evaluation of database accuracy
Due to each database having different update dates and different ways of constructing taxonomies, we first modified the taxonomy mentioned in the original paper to match the taxonomy corresponding to each database. We modified the names to be as equal as possible to the species level, but when no corresponding names were found, we chose the most similar taxonomy for each database. For example, the Erwinia chrysanthemi mentioned in the paper was converted to Dickeya chrysanthemi, because the name was no longer valid in the Silva and EzBioCloud databases. Here, we measured the accuracy of taxonomic assignments using the previously published method of Edgar [10]. We calculated the following values: N, the number of correct names; M, the number of predicted names; TP, the number of true positives; FP, the number of false-positives; and FN, the number of false-negatives. Unlike in the original paper, we evaluated the taxonomic assignments at the genus and species levels. In addition, we estimated how much the evenness was reproduced by calculating the value of alpha diversity, based on the assumption that the mock community was made to have an even distribution.
Results
To examine the accuracy of the three public databases, we compared known taxonomies from the mock community with the outcome of taxonomic assignments. Assuming an ideal situation, except for sequencing errors or missing a specific strain, we evaluated each database. At the genus and species level, EzBioCloud was the most successful database (Fig. 1A and 1B). Among 44 genera distributed over a total of 60 strains present in the mock community, the EzBioCloud database found over 40 true positive in all six samples. Also, the number of false-positives and false-negatives was lower than that of other databases. In contrast, the Greengenes database found only 30 genera out of a total of 44 genera, and the ratio of false-positives was high. The Silva database found a sufficient number of genera, and the number of false-positives was the highest, with around 20% of the predicted genera being incorrect. Similar results were observed at the species level, but the overall accuracy decreased, and the differences in accuracy between the databases were more clearly revealed. At the species level, EzBioCloud correctly identified about 40 species, but false-positives increased when comparing the result with that of the genus level. Silva correctly identified about 35 genera at the genus level, but about more than 10 of them did not detect the correct answer at the species level. In the case of Greengenes, only a few correct species were found. Among clustering methods, closed reference was the least accurate, regardless of database. We computed several alpha diversity indices to measure the effect associated with three databases. The alpha diversity indices Observed and Chao1 showed sample diversity from the perspective of richness and evenness (Fig. 1C). When using the same clustering method, we observed that the richness of EzBioCloud was the lowest in all cases, and its Simpson’s evenness index was the highest. Only for the Shannon index was the value of Silva higher than that of EzBioCloud.
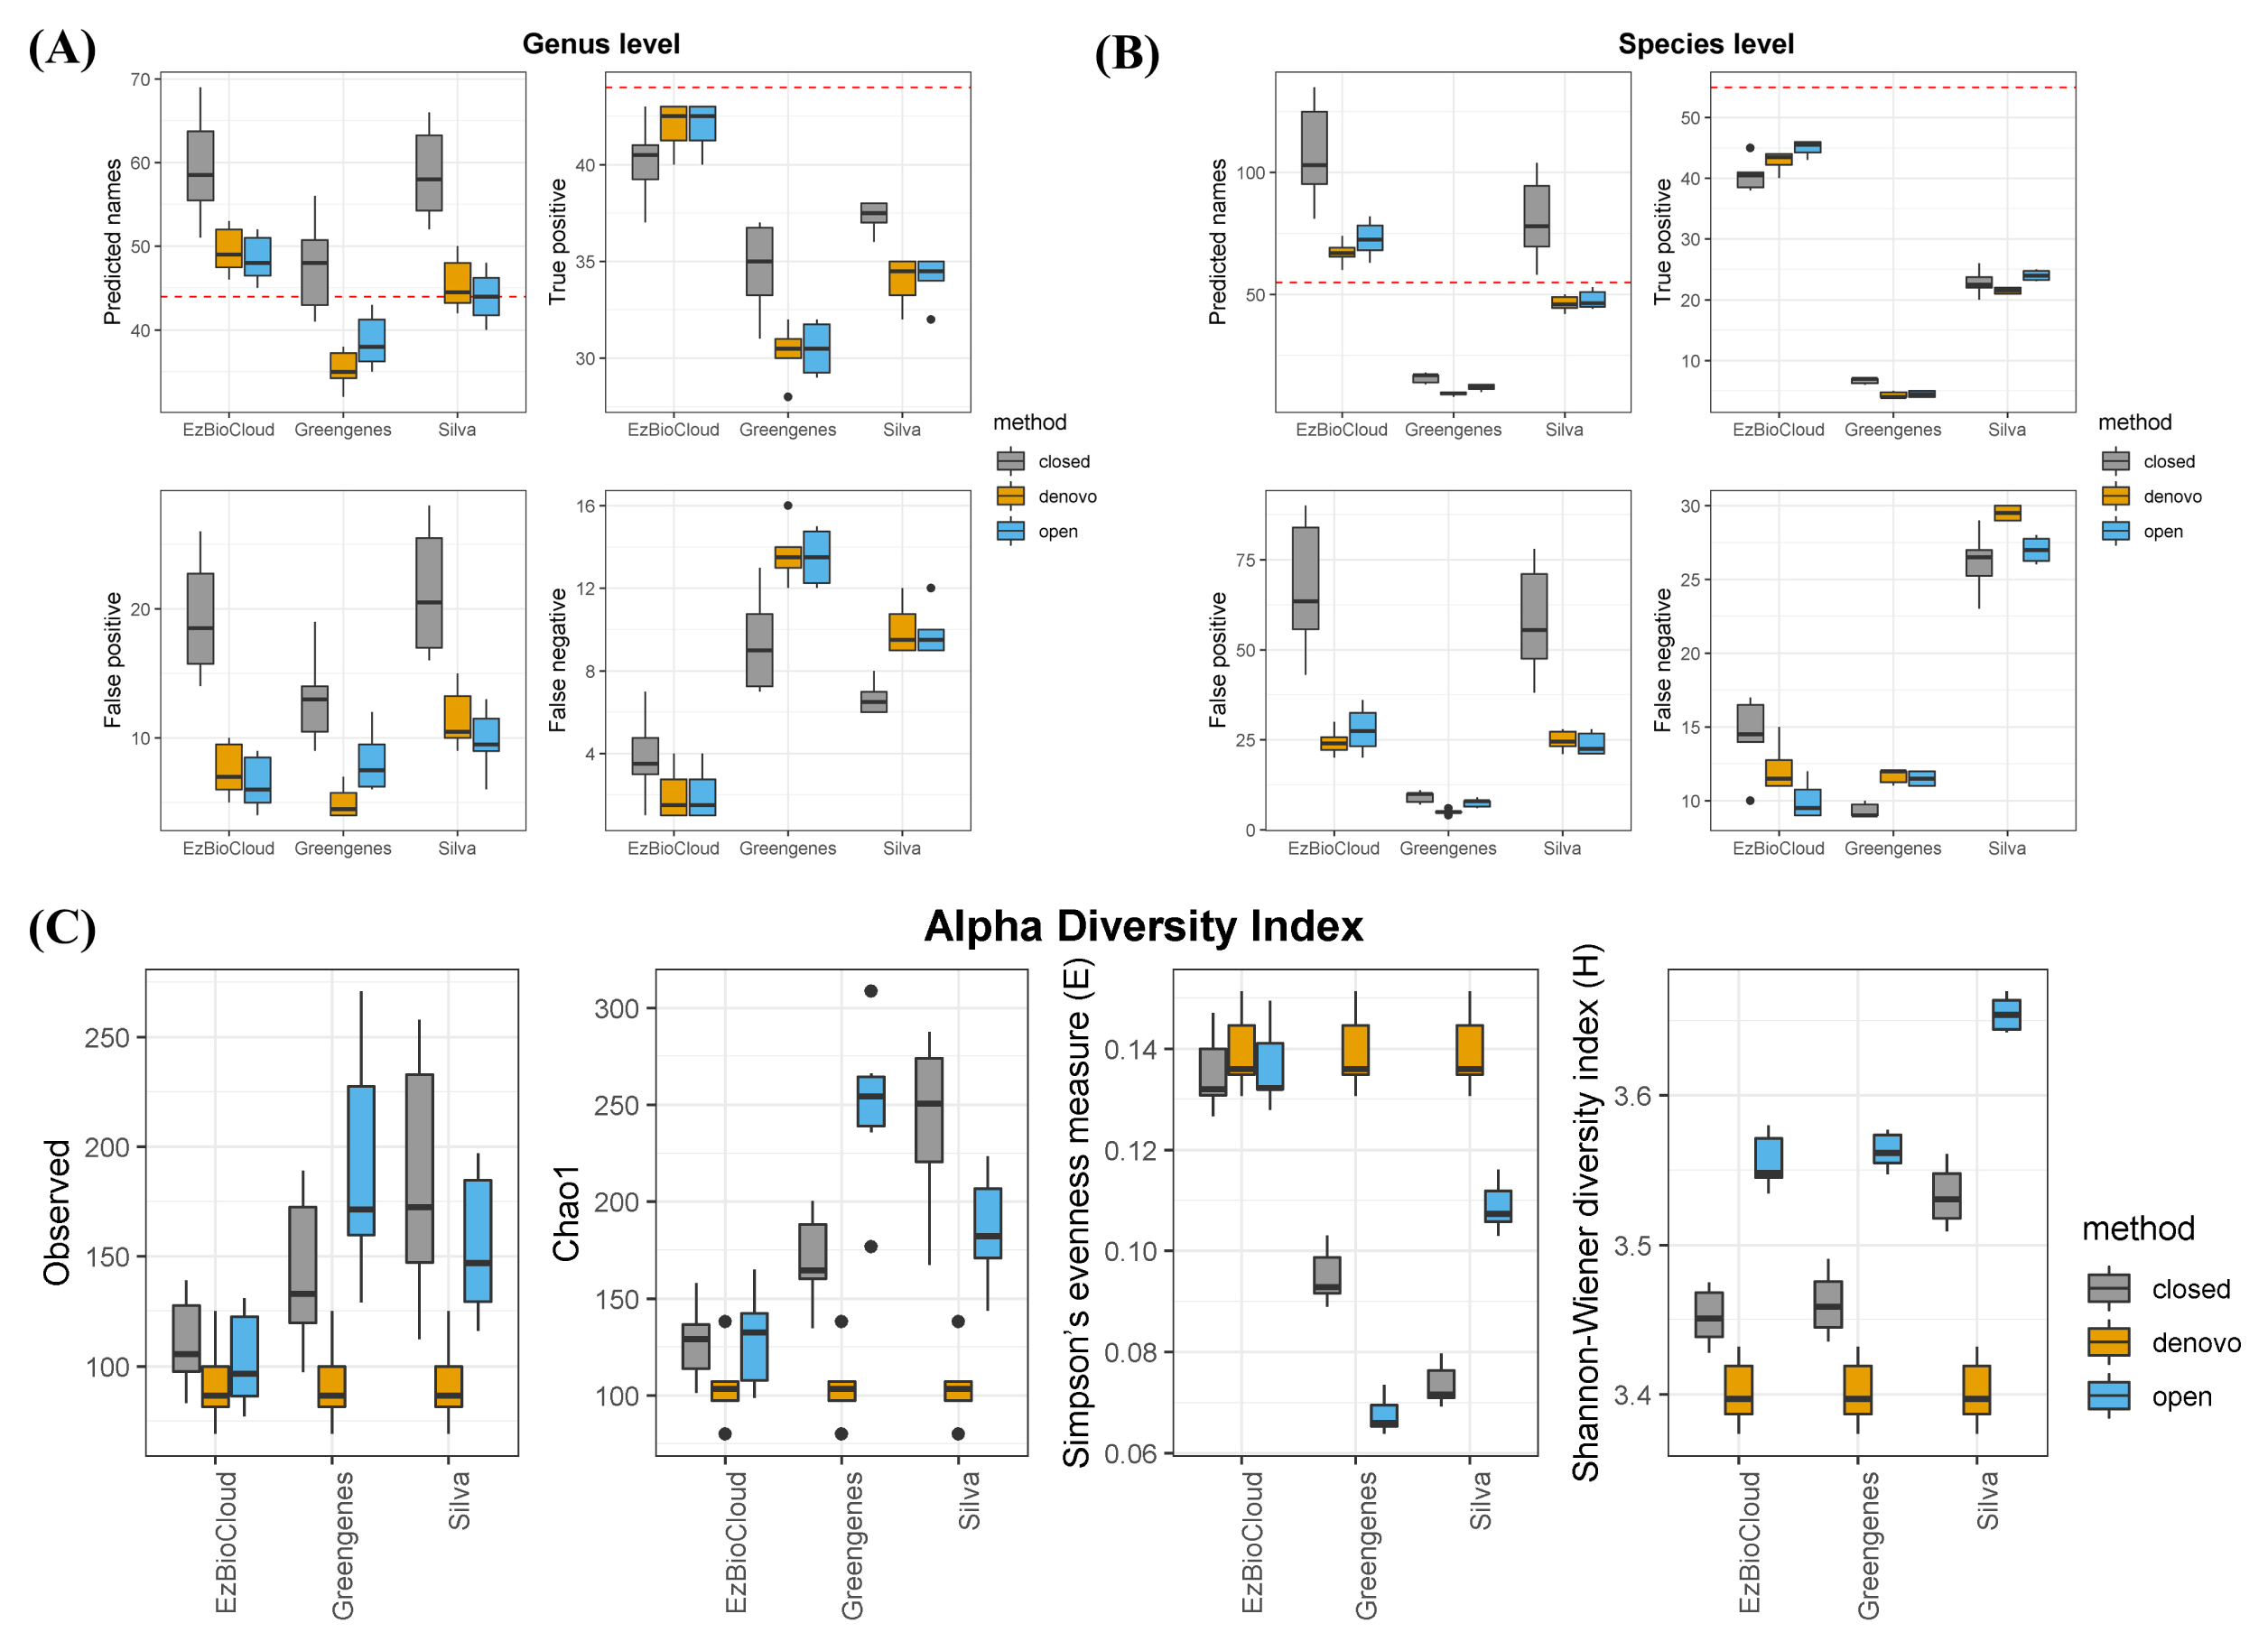
Taxonomic assignment accuracy at the genus level (A) and species level (B) and by alpha diversity index (C).
Discussion
Taxonomic assignment is a principal component of microbial community analysis; so, the choice of 16S database is also significant, because it may affect post-analysis and interpretation of the community composition. In this study, our goal was to evaluate the bacterial reference databases with a mock community. Here, we analyzed the accuracy of three public databases in terms of how well the correct taxa were found and how well in-sample diversity was reproduced at the OTU level. Our findings showed that EzBioCloud was the most accurate reference database for taxonomic identification, from all tests. It performed better than the other databases, finding more true positive taxa at both the genus and species levels. Greengenes predicted fewer genera than the actual number of genera, and the Silva database, although it roughly predicted the correct number of genera, resulted in many false-positives. This was mainly due to the fact that each database has a different number of sequences; Silva contains 190,000 sequences, and Greengenes contains 99,000 sequences, whereas EzBioCloud contains only 63,000 sequences [1–3]. More sequences in a given database increases the probability of genera being identified as a different genus. Another reason for the poor result in Greengenes is that the database has not been updated since 2013, meaning that it does not contain many of the novel bacterial sequences that have become known since then. As expected, the species-level prediction yield was poor overall compared with that of the genus level, with significantly worse results when Silva and Greengenes were used. This was likely due to the fact that Greengenes and Silva contain sequences that have missing taxonomic information at the species level. In some cases, Silva has only strain information without knowing the species. This demonstrates that the microbial composition from Silva or Greengenes at the species level is spurious, and reidentification is necessary using the representative sequences of the OTUs to figure out the species-level community structure.
When estimating richness and evenness with alpha diversity, EzBioCloud performed well, whereas the other two overestimated the sample richness and underestimated the evenness. Since the data were produced from uniformly distributed bacterial strains, correct estimations were indicated by a value of richness closer to 60 and a higher Simpson’s evenness. The values of EzBioCloud were more biologically reasonable than those of the others. This is, again, because the OTU-level resolution was affected by the number of sequences that each database had. Given the sequence errors generated from the Illumina platform, it is likely that several base differences will assign sequences derived from one species into different OTUs. This also led to an increase in Simpson’s evenness index in EzBioCloud, unlike other databases. This means that even if the database has more sequences, it can create more biases if the taxonomy is not properly organized. Interestingly, our analysis also shows that clustering methods affect indices more than the database itself. Closed reference methods resulted in the worst outcome, giving the highest variation in the same database. Therefore, clustering methods should be chosen carefully when describing in-sample diversity in metagenome studies.
The reader should bear in mind that our findings above were generated using a mock community. Most microbiome communities are composed of more than thousands of species, and their constitution is not uniform like artificial data. Despite these limitations, these results help us to understand the difference between database characteristics and provide a basic guideline in selecting the database, depending on the research purpose.
Acknowledgments
This study was supported by the National Research Foundation of Korea (2017M3A9F3046543).
Notes
Conflicts of Interest
No potential conflicts of interest relevant to this article was reported.
Authors’ contribution
Conceptualization: SCP, SW
Data curation: SCP
Formal analysis: SCP
Funding acquisition: SW
Methodology: SCP
Writing – original draft: SCP
Writing – review & editing: SCP, SW