Interaction Effects of Lipoprotein Lipase Polymorphisms with Lifestyle on Lipid Levels in a Korean Population: A Cross-sectional Study
Article information
Abstract
Lipoprotein lipase (LPL) plays an essential role in the regulation of high-density lipoprotein cholesterol (HDLC) and triglyceride levels, which have been closely associated with cardiovascular diseases. Genetic studies in European have shown that LPL single-nucleotide polymorphisms (SNPs) are strongly associated with lipid levels. However, studies about the influence of interactions between LPL SNPs and lifestyle factors have not been sufficiently performed. Here, we examine if LPL polymorphisms, as well as their interaction with lifestyle factors, influence lipid concentrations in a Korean population. A two-stage association study was performed using genotype data for SNPs on the LPL gene, including the 3' flanking region from 7,536 (stage 1) and 3,703 (stage 2) individuals. The association study showed that 15 SNPs and 4 haplotypes were strongly associated with HDLC (lowest p = 2.86 × 10⁻²²) and triglyceride levels (lowest p = 3.0 × 10⁻¹⁵). Interactions between LPL polymorphisms and lifestyle factors (lowest p = 9.6 × 10⁻⁴) were also observed on lipid concentrations. These findings suggest that there are interaction effects of LPL polymorphisms with lifestyle variables, including energy intake, fat intake, smoking, and alcohol consumption, as well as effects of LPL polymorphisms themselves, on lipid concentrations in a Korean population.
Introduction
Lipoprotein lipase (LPL) plays an important role in the metabolism and transport of lipids. It hydrolyzes triglycerides (TGs) in lipoproteins, such as chylomicrons (CMs) and very low-density lipoproteins (VLDLs), into free fatty acids, releasing CM remnants and intermediate-density lipoproteins that act on high-density lipoprotein cholesterol (HDLC) metabolism. Plasma LPL therefore plays an essential role in elevating HDLC and lowering TG [1-3].
While HDLC plays a role in the removal and transport of cholesterol from peripheral tissues to other tissues where it is required, such as the liver, low-density lipoprotein cholesterol (LDLC) is, conversely, transported from the liver to peripheral tissues. The concentration of lipids has been tightly associated with the risk of cardiovascular diseases [4-6]. Specifically, LDLC levels have been shown to have a positive log-linear association with the risk of coronary heart disease: a reduction of 1% in the serum concentration of LDLC has been shown to reduce the relative risk of coronary heart disease risk by approximately 1% [7], whereas an increase of 1 mg/dL in serum HDLC levels is associated with a decrease in the risk of coronary heart disease of approximately 2% to 3%, independent of LDLC levels [8]. It was also reported that TG levels are associated with risk of cardiovascular disease, independent of concentrations of other lipids and cardiac risk factors, although there has been controversy [6]. Recently, a report based on the Korea National Health and Nutrition Examination Surveys I, II, III, and IV has indicated that the prevalence of dyslipidemia and hypertriglyceridemia in this country has increased during the last decade [9]. Genetic association studies aimed at identifying the genetic factors associated with variations in lipid concentrations have been performed mostly for Europeans, and they have shown that the polymorphisms in the LPL gene, including the 3' flanking region, are strongly associated with HDLC and TG levels [10-13]. There is a report of a candidate gene approach for lipid concentrations in a Korean population, but the LPL gene was not included in the study [14].
The concentration of lipids is also influenced by environmental factors, such as smoking, alcohol consumption, diet, and physical activity, as well as genetic factors [5, 15]. However, studies about the influence of interactions between LPL polymorphisms and lifestyle factors have not been sufficiently performed. In this study, we examined the effects of potential interactions between LPL polymorphisms and lifestyle, as well as genetic variations of the LPL gene, including the 3' flanking region, on the lipid profile of a Korean population.
Methods
Subjects
Data for this study were obtained from the Korean Genome Epidemiology Study (KoGES), conducted by the Korean National Institute of Health (KNIH). The study comprised two stages. In the first stage, a cross-sectional analysis was conducted of samples from urban and rural communities from South Korea, whereas in the second stage, the study was replicated in other urban regions in Korea. Subjects who were examined in the first stage, described in a previous report [16], were recruited from a rural (Ansung) and an urban (Ansan) community from South Korea, which have been studied since 2001 as a part of KoGES. In total, 5,018 and 5,020 subjects from the Ansung and Ansan communities, respectively, participated in the study. The age of the participants ranged from 40 to 69 years. Samples were scrutinized for quality control purposes, after which 8,842 subjects remained in our sample [16]. We further excluded 1,306 subjects who were on medication for hypertension, diabetes, myocardial infarction, and hyperlipidemia. Information about the lifestyle of the subjects was based on their responses to questionnaires.
For the second stage of the study, 4,302 samples were obtained from both urban regions, Seoul and Busan, in South Korea that were established from 2006 to 2007 as part of KoGES. Samples satisfying any of the following criteria were excluded: i) gender inconsistencies, ii) genotype call rate lower than 95%, iii) excessive heterozygosity, iv) cryptic first degree relative, v) outliers on a multidimensional scaling plot, or vi) cancer history. A total of 3,703 subjects remained in our sample. These exclusion criteria for samples have been described [17]. Details of the sample characteristics are listed in Table 1.
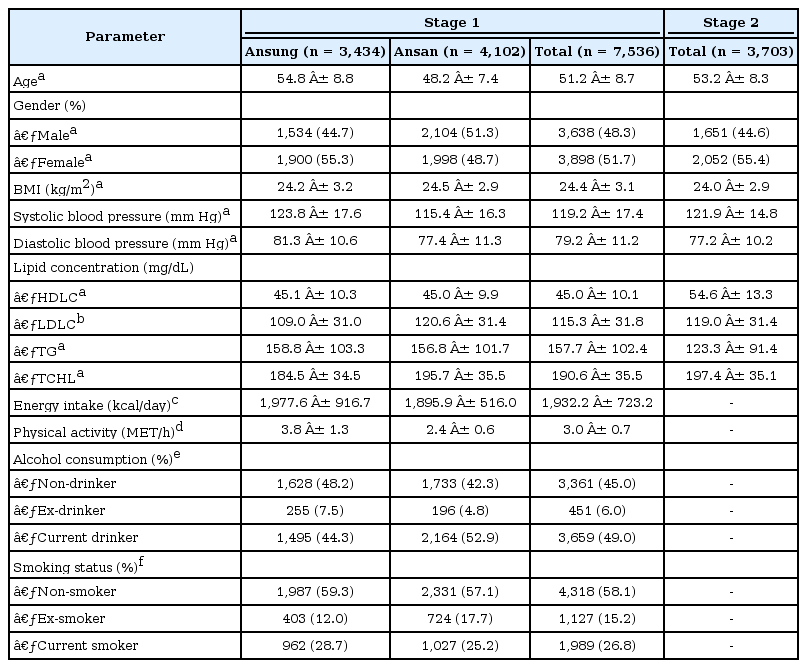
Description of subjects used in stages 1 and 2 of the study
Genotyping
We obtained genotype data for single-nucleotide polymorphisms (SNPs) located in the LPL gene, including the 3' flanking region, from KoGES, which are accessible to the research community through the Korean Associated Resource project. The study protocol was approved by the Institutional Review Board of KNIH. For genotyping of the samples from the Ansung and Ansan cohorts, Affymetrix Genome-Wide Human SNP Array 5.0 (Affymetrix Inc., Santa Clara, CA, USA) was used. Affymetrix Genome-Wide Human SNP Array 6.0 (Affymetrix Inc.) was used for genotyping samples from the Seoul and Busan cohorts. The Bayesian Robust Linear Model with the Mahalanobis distance algorithm was used to determine the genotypes at each SNP of Affymetrix 5.0. The BirdSeed calling genotyping algorithm was used on Affymetrix 6.0. The SNPs were filtered if any of the following criteria was met: i) a call rate lower than 95%, ii) a minor allele frequency (MAF) lower than 0.05, or iii) significant deviation from the Hardy-Weinberg equilibrium (HWE). Significant deviation from HWE for 28 successfully genotyped SNPs was determined based on a threshold of p < 0.002 (0.05/28).
SNP imputation was performed using the IMPUTE program (https://mathgen.stats.ox.ac.uk/impute/impute.html). A reference panel from International HapMap (phase II/release 22/NCBI build 36 and dbSNP build 126) data, comprising SNPs from 90 Japanese (JPT) and Han Chinese (CHB) individuals, was used as a template for inferring untyped genotypes. Imputed SNPs that were located in the LPL gene, including the 3' flanking region, with low quality were excluded according to the following criteria: low genotype information content (information lower than 0.5), a posterior probability score lower than 0.90, a call rate lower than 0.95, and MAF lower than 0.05.
Biochemical measures
Biochemical data from KoGES were obtained through the Korean Association Resource (KARE) project. Blood samples were obtained from the participants with at least 8 hours of overnight fasting. Serum total cholesterol (TCHL), HDLC, and TG concentrations were measured using the Advia 1650 analyzer (Siemens, Tarrytown, NY, USA) for the Ansung and Ansan cohorts and the Hitachi 7600 analyzer (Hitachi, Tokyo, Japan) for the Seoul and Busan study cohorts [16, 17]. LDLC concentration was estimated using the equation by Friedewald et al. [18] for individuals with TG levels lower than 400 mg/dL.
Statistics
To test the association between LPL SNPs and haplotypes (HTs) and lipid concentration, linear regression analyses, adjusted for age, gender, and body mass index (BMI), were performed. For stage 1 and imputed data, the residence area of each participant was additionally adjusted. The influence of the interaction between LPL SNPs and lifestyle variables on lipid levels was analyzed by using linear regression, including main and interaction effects, adjusted for residence area, age, gender, and BMI. The effect of energy and fat intake, physical activity, smoking, and drinking status on lipid profiles was examined. Energy intake, fat intake, and physical activity were measured as the total intake of kilocalories per day, daily fat intake, and metabolic equivalent scores per hour, respectively. Smoking status had two categories, non-smokers and smokers, and alcohol consumption was divided into non-drinkers and drinkers. These lifestyle factors were available for subjects from stage 1 and imputed data but not from stage 2.
All analyses were performed by log-transforming HDLC, TG, and TCHL values to normalize their distribution. Untransformed LDLC values were used for all analyses. To determine the effect of SNPs, untransformed lipid concentrations were used.
Linkage disequilibrium (LD) block partition was performed by Gabriel's rule, applied in Haploview version 4.1 (Broad Institute of MIT and Harvard University, Boston, MA, USA), and HT inference was performed using the expectation maximization algorithm with PLINK version 1.07 (http://pngu.mgh.harvard.edu/~purcell/plink). All statistical analyses were performed in an additive model (AA vs. AB vs. BB or +/+ vs. +/- vs. -/-) using PLINK.
Results
Association of LPL SNPs with lipid concentrations
We sequentially discarded 6 SNPs with MAF < 0.05, 2 SNPs with call rate < 95%, and 1 SNP with HWE p-value < 0.002, leaving 19 SNPs for the association study at stage 1. Our results show that SNPs located in the LPL gene, including the 3' flanking region, were strongly associated with HDLC and TG levels. The linear regression, adjusted for age, gender, and BMI, using combined data from the two study stages, revealed that 15 SNPs were associated with HDLC and TG levels (Table 2). The strongest associations were between rs10503669 and both HDLC (combined p = 3.6 × 10⁻²²; 2.2-mg/dL increase per minor T allele) and TG (combined p = 3 × 10-15; 13.6-mg/dL decrease per minor T allele) in additive models. However, no strong association was detected between the SNP and either LDLC or TCHL levels (Supplementary Fig. 1).
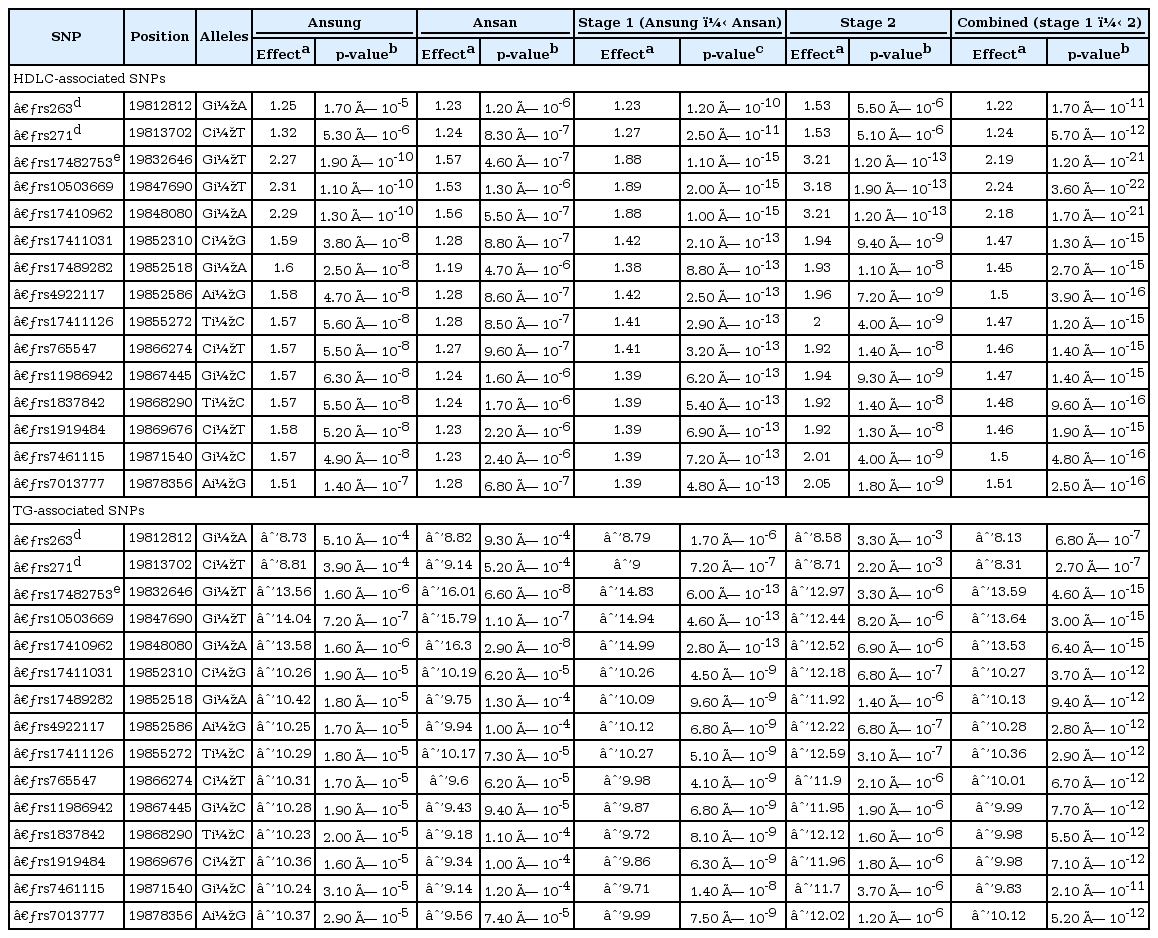
SNPs associated with HDLC and TG concentrations at each stage of the study
For LPL SNPs, we tested 2 intronic SNPs and 2 SNPs located in the 3' untranslated region (UTR) from stage 1. Of these, two SNPs in the 3' UTR (rs11570892 and rs3200218) were not significantly associated with any lipid concentration (Supplementary Table 1). Two intronic SNPs, rs263 and rs271, were significantly associated to higher HDLC levels (p = 1.2 × 10⁻¹⁰ and p = 2.5 × 10⁻¹¹; 1.2- and 1.3-mg/dL increase per minor A and T allele, respectively) and lower TG levels (p = 1.7 × 10⁻⁶ and p = 7.2 × 10⁻⁷; 8.8- and 9-mg/dL decrease per minor A and T allele, respectively) (Table 2). In stage 2, 7 intronic SNPs and 2 SNPs that were located in the 3' UTR were tested. It was found that rs263 and rs271 were also strongly associated with increased HDLC (p = 5.5 × 10⁻⁶ and p = 5.1 × 10⁻⁶, respectively; both showed a 1.5-mg/dL increase per minor A and T allele) (Table 2) and decreased TG levels (p = 3.3 × 10⁻³ and p = 2.2 × 10⁻³; 8.6- and 8.7-mg/dL decrease per minor A and T allele, respectively). Additionally, 4 intronic SNPs (rs253, rs326, rs327, and rs12679834) were significantly associated with increased HDLC (p = 4.2 × 10⁻³, p = 1.5 × 10⁻⁹, p = 1.6 × 10⁻⁹ and p = 3.1 × 10⁻¹⁴; increase of 0.8, 2.1, 2.1, and 3.3 mg/dL per minor allele, respectively) and decreased TG levels (p = 3.6 × 10⁻³, p = 9.1 × 10⁻⁷, p = 5.9 × 10⁻⁷ and p = 1.3 × 10⁻⁶; increase of 7.4, 12.2, 12.3, and 13.7 mg/dL per minor allele, respectively) (Supplementary Table 2). The analysis using combined data from the two stages showed that rs263 and rs271 were also significantly associated with HDLC (p = 1.7 × 10⁻¹¹ and p = 5.7 × 10⁻¹², respectively; increase in both cases of 1.2 mg/dL per minor A and T allele) and TG levels (p = 6.8 × 10⁻⁷ and p = 2.7 × 10⁻⁷; decrease of 8.1, 8.3 mg/dL per minor A and T allele, respectively) (Table 2).
Association of LPL HTs with lipid concentration
Two blocks, including SNPs located in the LPL gene, were identified (Supplementary Fig. 2), and the association of HT with lipid profiles for the two blocks was examined. The analysis using combined data from the two stages showed that block 2, which includes SNPs located in the LPL gene, including the 3' flanking region, was the region most strongly associated with lipid concentrations (Table 3). HT3 in block 2 was strongly associated with increased HDLC levels (p = 2.86 × 10⁻²²; 2.25-mg/dL increase per HT3) and reduced TG levels (p = 9.09 × 10⁻¹⁵; 13.7-mg/dL decrease per HT3), whereas HT1 was strongly associated with reduced HDLC levels (p = 1.1 × 10⁻¹⁴; 1.2-mg/dL decrease per HT1) and higher TG levels (p = 3.05 × 10⁻¹²; 8.6-mg/dL increase per HT1). There was no significant association between HT and either LDLC or TCHL.
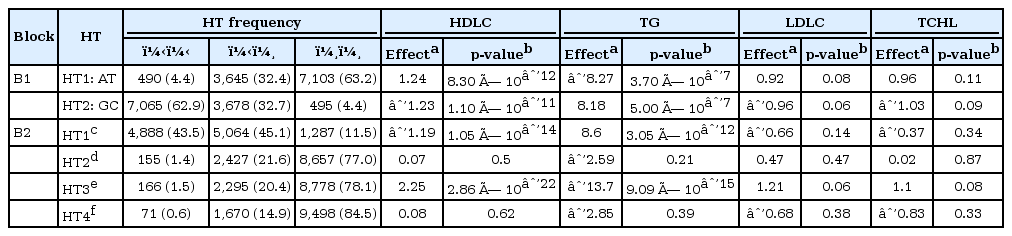
Association between haplotypes, including LPL SNPs and lipid concentrations, using combined data from stages 1 and 2
The analysis using imputed data also showed a strong association between HTs and lipid levels in the 2 blocks, including LPL SNPs (Supplementary Table 3). HT1 in block 2 was significantly associated with a reduced HDLC level (p = 4.2 × 10⁻¹⁵; 1.3-mg/dL decrease per HT1) and an increased level of TG (p = 1.9 × 10⁻⁸; 8-mg/dL increase per HT1), whereas HT3 was significantly associated with increased HDLC (p = 7.8 × 10⁻¹⁶; 2-mg/dL increase per HT3) and LDLC levels (p = 5.1 × 10⁻³; 2.3-mg/dL increases per HT3) and decreased TG levels (p = 5.6 × 10⁻¹³; 15.1-mg/dL decrease per HT3).
Effect of the interaction between polymorphisms located in the LPL gene and lifestyle on lipid concentration
We tested LPL SNPs and HTs from stage 1. All significant associations were found in the results of the dominant model for the minor allele. The association of minor alleles for 3 SNPs (rs263, rs271, rs328) with higher HDLC levels also depended on energy intake (Supplementary Fig. 3). Of these, the minor alleles of 2 SNPs (rs263, rs271) were associated with lower TG levels, also depending on energy intake. The association of the minor alleles of two SNPs (rs263, rs271) with higher HDLC levels also depended on fat intake (Fig. 1). The minor alleles of 2 SNPs (rs263, rs271) were also associated with higher HDLC levels and lower TG levels through an interaction with cigarette smoking and with lower TG levels through an interaction with alcohol consumption (Fig. 2, Supplementary Fig. 4). Interaction effects of HT1 and 2 in block 1, which were formed by two SNP (rs271, rs263) in strong LD (r2 = 0.99), with lifestyle factors on HDLC and TG levels were found to be almost same with those of rs271 and rs263 (data not shown). In block 2, HT3 was associated with higher HDLC levels and lower TG levels and depended on an interaction with energy intake (Fig. 3, Supplementary Fig. 3). HT4 in block 2 was associated with lower TG levels through an interaction with cigarette smoking (Supplementary Fig. 4). For the interaction between LPL polymorphisms and physical activity, there was no significant association with any lipid levels.

Effect of the interaction of rs271, which was in strong linkage disequilibrium with rs263 (r2 = 0.99), with daily fat intake on high-density lipoprotein cholesterol (HDLC) levels (p = 9.6 × 10⁻⁴). Subjects were divided into daily fat intake ≤ 20 g (TT or TC, 774; CC, 1,314), 21-30 g (TT or TC, 695; CC, 1,183), 31-40 g (TT or TC, 547; CC, 934), and ≥ 41 g (TT or TC, 702; CC, 1,144). Interaction p-value was calculated by linear regression analysis, which includes main and interaction effects, adjusted for residence area, age, gender, and body mass index.

Effect of the interaction of rs271, which was in strong linkage disequilibrium with rs263 (r2 = 0.99), with cigarette smoking on high-density lipoprotein cholesterol (HDLC) (A) and triglyceride (TG) (B) levels (p = 5.7 × 10⁻³ and p = 8.60 × 10⁻³, respectively). Subjects were divided into non-smokers (TT or TC, 1,629; CC, 2,689) and smokers (TT or TC, 700; CC, 1,289). Interaction p-values were calculated by linear regression analyses, which includes main and interaction effects, adjusted for residence area, age, gender, and body mass index.
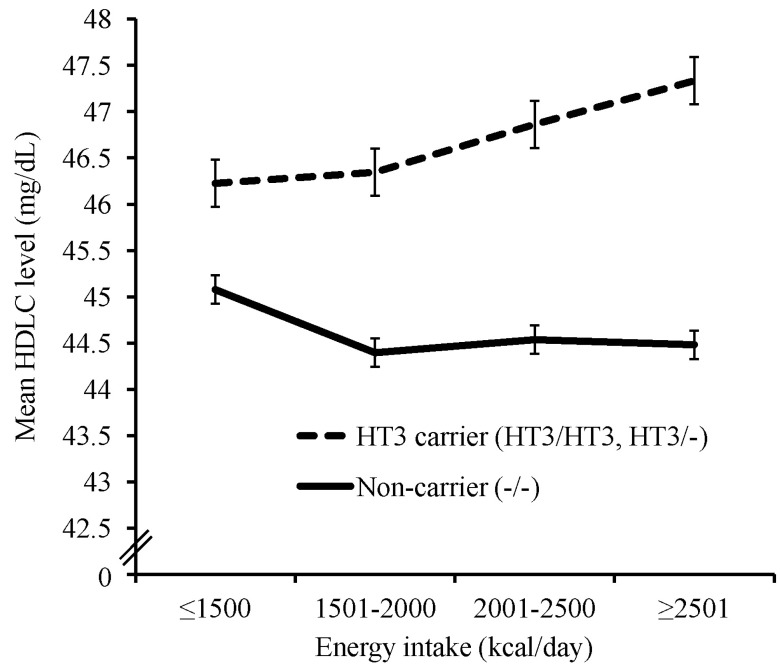
Effect of the interaction of haplotype 3 in block 2 (TGTGTAGAGCTCCTCG) with daily energy intake on high-density lipoprotein cholesterol (HDLC) level (p = 5.6 × 10⁻³). Subjects were divided into daily energy intake ≤ 1,500 kcal (HT3/HT3 or HT3/-, 387; -/-, 1,353), 1,501-2,000 kcal (HT3/HT3 or HT3/-, 646; -/-, 2,297), 2001-2,500 kcal (HT3/HT3 or HT3/-, 358; -/-, 1,216), and ≥ 2,501 kcal (HT3/HT3 or HT3/-, 235; -/-, 801). Interaction p-values were calculated by linear regression analyses, which includes main and interaction effects, adjusted for residence area, age, gender, and body mass index. HT, haplotype.
Discussion
The human LPL gene is located on chromosome 8p22 and includes 10 exons encoding 475 amino acids, of which 448 amino acids are part of the mature protein and 27 of the signal peptide [19, 20]. LPL has an essential role in the metabolism of lipids, as it hydrolyzes a number of substrates, such as long- and short-chain glycerides and phospholipids in vitro, as well as major substrates, such as CMs and VLDL in vivo [21]. Dysfunction of LPL has been reported to be associated with chylomicronemia, atherosclerosis, obesity, Alzheimer's disease, and dyslipidemia [22].
Genetic association studies have shown that some SNPs located in the LPL gene, including the 3' flanking region, are strongly associated with HDLC and TG levels, mostly in Europeans. Specifically, by performing meta-analyses of genomewide association studies, Aulchenko et al. [13] found that rs2083637 and rs10096633 were associated with HDLC and TG levels, and it was also demonstrated that rs325 and rs10105606, reported by Waterworth et al. [11], and rs12678919, reported by Kathiresan et al. [23], were associated with HDLC and TG levels. Studies using the candidate gene approach, which examines the effects of genetic variants of a putative gene in an association, have reported that some LPL SNPs are associated with HDLC and TG levels. Tang et al. [24] recently revealed that rs326 and rs328 (which convert serine to a stop codon) and rs13702 are associated with HDLC and TG levels in African-Americans and European-American populations.
Here, rs263 and rs271, located, respectively, in introns 5 and 6, were strongly associated with increased HDLC and decreased TG levels (Table 2). The two significant SNPs formed an HT block with strong LD (r2 = 0.99) in stage 1, and rs3200218, located in the 3' UTR, formed another HT block with 15 SNPs located in the 3' flanking region. At stage 2, nine SNPs in the LPL gene remained after SNP filtering, out of which six were significantly associated with HDLC levels (Supplementary Table 2). SNPs rs343, rs253, rs263, and rs271, located, respectively, in introns 3, 4, 5, and 6, formed an HT block with moderate LD (r2 > 0.3). SNPs rs326, rs327, rs12679834, rs11570892n, and rs3200218 formed another HT block with 31 SNPs located in the 3' flanking region. In the two blocks at stages 1 and 2, some HTs were found to be strongly associated with HDLC and TG levels (Supplementary Tables 4 and 5). The analysis using the combined data from both stages showed that HTs were also significantly associated with HDLC and TG levels (Table 3). Using the imputation data, we found that more LPL SNPs were included in the two blocks. HTs that were significantly associated with lipid profiles were also identified (Supplementary Table 3).
The strongest association of HT with HDLC and TG levels was observed in block 2 (from both stages). A previous study reported that one HT was associated with increased LPL activity [25]. The HT was found to be consistent with HT3 in block 2, found using stage 1 and imputed data, which was associated here with increased HDLC and decreased TG levels. In block 2, we found that one SNP, rs328, which converts serine to a stop codon, was included using imputed data. Interestingly, the minor allele G of rs328 was found only in HT3. It has been reported that this minor allele is associated with increased HDLC and decreased TG concentrations in Japanese [26] and European populations [10, 27], and our results support this finding. This truncated variant was also demonstrated to have higher catalytic activity [28-30].
SNP rs328 has been reported to be in strong LD with rs17482753 in European (r2 = 1) and African (r2 = 0.852) populations [31]. rs17482753 was genotyped in stage 1 and 2 of this study, and the SNP was found to be in strong LD with rs328, according to the imputed data (r2 = 0.993). We additionally identified strong LD (r2 = 0.93) between rs328 and rs17482753 by using genotype data of 830 Korean participants obtained from a previous study [32], in which samples in stage 1 of this study were included. Similar to the results of rs328 obtained using the imputed data in this study, the rs17482753 minor allele was found to be strongly associated with raised HDLC and reduced TG levels in a dominant manner at both stages.
In a previous study, LPL SNPs located in the 3' UTR region were considered possible targets affecting miRNA binding sites, and 5 SNPs were predicted to be putative miRNA binding sites by polymiRTS [33]. The 3' UTR region of the LPL gene was included in block 2 in this study, and two of the predicted 5 SNPs were tested (Supplementary Table 1). Rs1059611 major allele T from the imputed data was significantly associated with reduced levels of HDLC and LDLC and with increased TG levels in an additive manner. In this SNP, the major T allele was predicted to create a new miRNA (miR-136) binding site, causing abnormal repression of this gene. The major allele of another SNP, rs11570892, was predicted to disrupt a conserved miRNA (miR-592) binding site, and this could cause abnormal control of normal repression. However, this SNP showed inconsistent association with LDLC levels in stages 1 and 2 of this study.
Some environmental factors have been suggested to be associated with lipid profiles. Physical activity was reported to be associated with higher HDLC and lower TG and TCHL concentrations [34], whereas smoking was reported to be associated with higher LDLC and TG and lower HDLC levels [35, 36]. Alcohol consumption was suggested to be associated with increased HDLC levels [37, 38], whereas excessive alcohol consumption was associated with a higher TG level [39]. A low fat intake, in turn, was associated with reduced TCHL, LDLC, and HDLC and increased TG levels [40]. Some LPL SNPs have also been shown to be associated with lipid profiles through their interaction with smoking, alcohol consumption, and physical activity. Specifically, rs320 has been suggested to interact with smoking [41, 42] and physical activity [42], and rs1801177 interacts with physical activity [43]. The SNP rs328, which is a nonsense SNP included in our imputed data, has been associated with HDL through its interaction with smoking and alcohol consumption in females but not in males [44]. In a recent study, however, the interaction of several LPL SNPs, including rs328, with alcohol consumption was suggested to have no influence on HDLC levels [45].
In this study, we show that the effects of some LPL polymorphisms on lipid concentrations were regulated by several environmental factors. Carriers of each minor allele of 3 SNPs (rs263, rs271, and rs328) were associated with slightly higher HDLC levels, depending on an interaction with energy intake. This effect, however, was not observed among non-carriers (Supplementary Fig. 3). In two of these SNPs (rs263 and rs271), which were in strong LD (r2 = 0.99 in stages 1 and 2), each major genotype carrier led to higher levels of TG, whereas the TG levels of each minor allele carrier were not affected by a higher energy intake. Carriers of each minor allele, but not non-carriers, led to a higher HDLC level through an interaction with a higher intake of fat (Fig. 1). Each major genotype carrier of two SNPs (rs263 and rs271) showed lower HDLC levels and higher TG levels than minor allele carriers through an interaction with smoking (Fig. 2). In the major genotype carrier of these two SNPs, higher TG levels were also found by interacting with alcohol consumption (Supplementary Fig. 4), whereas each minor allele carrier was less affected than non-carriers by smoking or alcohol consumption.
For interactions of HTs, blocks 1 and 2 were shown to interact with inconsistent lifestyle variables. Interaction effects of HT1 and 2 in block 1 with lifestyle factors, which were formed by the two SNPs, on lipid levels were almost same with those of rs263 and rs271 (data not shown). In the LPL gene, 61 missense mutations have been identified, and interestingly, 42 of them are located in exons 5 and 6, which may be contained in block 1 [46]. Carrier of HT3 in block 2, which was reported to be associated with increased LPL activity [25], showed higher HDLC levels and lower TG levels, whereas non-carriers were not affected by a higher energy intake (Fig. 3, Supplementary Fig. 3). In the non-carrier of HT4 in block 2, higher TG levels were found by interacting with cigarette smoking (Supplementary Fig. 4). Smoking and moderate alcohol consumption were reported to be related with reduced and increased LPL activity, respectively [47, 48], but the precise mechanisms by which the interaction of LPL polymorphisms with environmental factors affects lipid concentrations have not been demonstrated yet.
In conclusion, we found that HTs are strongly associated with HDLC and TG levels in the 2 blocks in which LPL SNPs are included and that SNPs in these blocks are also strongly associated with HDLC and TG levels in stage 1. Interestingly, these results were replicated in stage 2, which consists of independent samples, and the combined analyses, including the samples of stages 1 and 2, showed the most significant results. Moreover, by analyzing the effect of the interaction of LPL polymorphisms with several lifestyle factors on plasma lipid levels, we have shown that the effects of some LPL SNPs and HTs on HDLC and TG concentrations are regulated by energy and fat intake, smoking, and alcohol consumption. Since these results have not been reported in any previous studies, they are novel findings. These interaction effects suggest that the appropriate lifestyle of each individual could be recommended according to the type of LPL polymorphism. These results should be confirmed in other populations and in a longitudinal study.
Acknowledgments
This research was performed within the Consortium for Large Scale Genome Wide Association Study III (2011E7300400), which was supported by the genotyping data (the Korean Genome Analysis Project, 4845-301) and the phenotypic data (the Korean Genome Epidemiology Study, 4851-302) from the Korea Center for Disease Control. This study was also supported by grants from Korea Health 21 R&D Project, Ministry of Health and Welfare, Republic of Korea (A080734), and the Priority Centers Program of the National Research Foundation of Korea (NRF), which is funded by the Ministry of Education, Science, and Technology (2009-0093821).
References
Supplementary materials
Supplementary data including 5 tables and 4 figures can be found with with this article online at http://www.genominfo.org/src/sm/gni-10-88-s001.pdf.