Introduction
For the past several decades, many statistical methods have been developed to detect genetic variants in genome-wide association studies (GWASs) [1], since high-throughput genotyping technologies have provided a large scale of genetic information, such as microarray expression data, single-nucleotide polymorphisms (SNP), copy number variants, and so forth. In most early GWASs, a single-SNP approach was widely used to identify genetic variations associated with common and complex diseases, because it is relatively easy and efficient to estimate and test the effect of genetic variants. However, this single-SNP approach yields the missing heritability problem [2], because many complex diseases are naturally related to multiple genes and their interactions, rather than a single-SNP. Thus, many approaches for solving the missing heritability problem have been studied, such as meta-analysis, analysis of rare variants from next-generation sequencing, and analysis of gene-gene interactions. This paper focuses on the analysis of gene-gene interactions associated with the survival phenotype in prospective studies. Since the analysis of gene-gene interactions involves high-dimension variables, the method for reducing high-dimension to lower-dimension variables is practically useful to estimate the effects of genes and their interactions with the appropriate models.
As a strategy to reduce the dimension of high-order variables, the multifactor dimensionality reduction (MDR) method has been proposed by Ritchie et al. [3], in which multi-level genotypes are efficiently reduced into a binary attribute to detect non-linear patterns of gene-gene interactions in GWASs. The MDR method originally was proposed for a binary phenotype in a case-control study, and it is a nonparametric and genetic model-free approach. The key idea of MDR is to classify multi-dimensional genotypes into one-dimensional binary attributes by pooling genotypes of multiple SNPs using a well-defined statistic, such as the ratio of cases and controls. Many modifications for MDR have been proposed by generalizing the binary phenotype to quantitative traits and survival time with various classifiers. For example, Lou et al. [4] proposed a generalized MDR (GMDR), which includes both binary and continuous phenotypes and uses a score-based residual to classify multi-level genotypes into high- and low-risk groups. In addition, the GMDR allows for the adjustment of covariates, such as many demographic variables.
In addition, the constructive induction algorithm of MDR has also been extended to investigate gene-gene interactions associated with the survival phenotype. Gui et al. [5] first proposed a novel approach, called Survival-MDR (Surv-MDR), for detecting gene-gene interactions with survival times using the combinatorial algorithm of MDR. The Surv-MDR method replaces case-control ratios by a log-rank test statistic with survival time. Thus, the balanced accuracy is replaced by a log-rank test statistic, but the other cross-validation procedure for selecting the best model is unchanged. It has been shown that Surv-MDR has better power than traditional Cox regression models through intensive simulation studies. Also, Surv-MD has successfully identified the SNP-SNP interactions associated with survival time in bladder cancer data, as shown in Andrew et al. [6]. However, there exists a weakness of Surv-MDR, which can not adjust the effect of the covariate, because it uses the log-rank test statistic as a classifier.
To overcome the disadvantage of Surv-MDR, Lee et al. [7] proposed a simple method, called Cox-MDR, which uses a martingale residual as a classifier and allows for the adjustment of covariates. Similarly, Oh and Lee [8] proposed another method, called AFT-MDR, which uses a standardized residual as a new classifier. In an accelerated failure time model, the standardized residual is the normalized difference between the observed log survival time and the expected log survival time under the assumed model. Thus, it can be interpreted that a positive standardized residual implies a longer survival effect, while a negative standardized residual implies a shorter survival effect than expected. It is reasonable to classify subjects into high- and low-risk groups by the standardized residual, since it can be interpreted as a measure of association between putative genetic factors and survival time. Furthermore, AFT-MDR can adjust for the effect of covariates under the framework of the accelerated failure time regression model, unlike Surv-MDR.
However, both Surv-MDR and AFT-MDR only provide the best pair of SNPs, which is selected by 10-fold cross-validation, and the significance of a gene-gene interaction is achieved by intensive permutations. Recently, Yu et al. [9] proposed a unified model-based MDR (UM-MDR) method to overcome the disadvantage of MDR, which needs permutation tests for the significance of the effect of the best pair of SNPs. The UM-MDR method includes two steps for investigating gene-gene interactions, in which multi-dimensional genotypes are classified into high- and low-risk groups, and then, an indicator for the high-risk group is defined in the first step. In the second step of the UM-MDR method, the indicator variable for the high-risk group is considered a covariate, with other adjusted covariates in the regression model. Then, the significance of a gene-gene interaction is obtained by testing the indicator variable of the high-risk group.
Through simulation studies, we compared the proposed method with AFT-MDR with and without the main effect using 70 different penetrance models listed by Velez et al. [10]. From the simulation results, the power of the proposed method is similar to that of AFT-MDR when the main effect is not considered, but it performs better than AFT-MDR when the censoring fraction is greater than 0.3. In addition, the power of the proposed method is much greater than that of AFT-MDR when the main effect is considered, while AFT-MDR has no power when there is a strong main effect. The power of the proposed method also decreases as the censoring fraction increases.
Methods
Let Ti denote the survival time for the ith individual and xi and zi denote the predictor variable vector coding a gene-gene and gene-environment interaction of interest and the vector coding for the covariates, respectively. Let ╬▓ and ╬│ be the corresponding parameter vectors to xi and zi, respectively. Then, we call ╬▓ the target effects and ╬│ the covariate effects. The parametric regression model represents the linear relationship between the log survival time and covariates as follows:
Here, ┬Ą is the mean value of the log survival time when X = Z = 0, Žā is a scale parameter, and W is the error distribution. When T has a Weibull distribution, W has a standard extreme value distribution. For a log-logistic distribution, W has a standard logistic distribution.
The standardized residual for the ith individual, s i = log T i ╬╝ ^ Y ^ ŌĆ▓ Z i Žā ^  , is obtained from the null model of no target effects (i.e., ╬▓ = 0). Since the standardized residual is the difference between the observed and expected survival time under the null model with no SNP effects, the magnitude and sign of the standardized residual provide a measure of the association between SNPs and survival time. Those patients who have positive standardized residuals are at low risk for the disease, because one survives longer than expected under the null model. Similarly, those patients who have negative standardized residuals are at high risk for the disease, because one dies earlier than expected. Thus, each individual with a positive standardized residual is classified as a control, whereas one with a negative standardized residual is classified as a case. In addition, for each multi-locus genotype combination of SNPs, we calculate the sum of the standardized residuals of those patients who have the corresponding genotype and replace the case-control ratios with the sum of the standardized residual to discriminate between high- and low-risk groups. We assign the cell as low-risk if the sum of standardized residuals within that cell is greater than or equal to 0 and as high-risk otherwise. The process of AFT-MDR is done by following the algorithm of the original MDR through 10-fold cross-validation to select the best pair of SNPs.
, is obtained from the null model of no target effects (i.e., ╬▓ = 0). Since the standardized residual is the difference between the observed and expected survival time under the null model with no SNP effects, the magnitude and sign of the standardized residual provide a measure of the association between SNPs and survival time. Those patients who have positive standardized residuals are at low risk for the disease, because one survives longer than expected under the null model. Similarly, those patients who have negative standardized residuals are at high risk for the disease, because one dies earlier than expected. Thus, each individual with a positive standardized residual is classified as a control, whereas one with a negative standardized residual is classified as a case. In addition, for each multi-locus genotype combination of SNPs, we calculate the sum of the standardized residuals of those patients who have the corresponding genotype and replace the case-control ratios with the sum of the standardized residual to discriminate between high- and low-risk groups. We assign the cell as low-risk if the sum of standardized residuals within that cell is greater than or equal to 0 and as high-risk otherwise. The process of AFT-MDR is done by following the algorithm of the original MDR through 10-fold cross-validation to select the best pair of SNPs.We propose to improve the process of AFT-MDR by combining the unified model-based MDR to test the significance of gene-gene interactions. In the first step of the proposed method, multi-level genotypes are classified into high-risk and low-risk groups, as done in AFT-MDR. Then, we define an indictor variable, S, as 1 for the high-risk group and 0 otherwise. In the second step, the variable S is considered with the other adjusting covariates in the accelerated failure time regression model. The testing for the significance of S implies that there is a significant gene-gene interaction associated with survival time. For testing the significance of S, a Wald-type test statistic is used, and its asymptotic distribution is a chi-square distribution under the null hypothesis of no gene-gene interaction. However, as described in Yu et al. [9], the asymptotic distribution of the Wald-type test statistic is not a central chi-square distribution, because the expectation of the test statistic is not 0 under the null hypothesis. To adjust for the bias of the test statistic, non-centrality is estimated by a small number of permutationsŌĆösay, 5 or 10 times. Based on the non-central chi-square test statistic, the significance of a gene-gene interaction can be tested for all possible pairs of SNPs without any intensive permutations. The proposed method easily tests the significance of a gene-gene interaction for all possible higher-order pairs of SNPs in the framework of a regression model. It allows for the adjustment of covariates and the main effect of SNPs, while the original MDR method cannot.
Results
A simulation study was performed to compare the power of the proposed method with that of AFT-MDR in the setting constructed similarly to that of Oh and Lee [8]. We consider two disease-causal SNPs among 10 unlinked diallelic loci with the assumption of Hardy-Weinberg equilibrium and linkage equilibrium. For the simulation study, survival time is generated from an accelerated regression model as follows: where fij = P(high risk|SNP1 = i, SNP2 = j), Z~N(0,1), W~N(0,1). Here, fij is an element from the ith row and the jth column of a penetrance function, which defines a probabilistic relationship between a status of high-risk or low-risk and SNPs. We consider 14 different combinations of two different minor allele frequencies of (0.2 and 0.4) and seven different heritabilities of (0.01, 0.025, 0.05, 0.1, 0.2, 0.3, and 0.4) and 70 epistatic models with 70 various penetrance functions, as described by Velez et al. [10]. We also consider four censoring fractions (0.0, 0.1, 0.3, and 0.5).
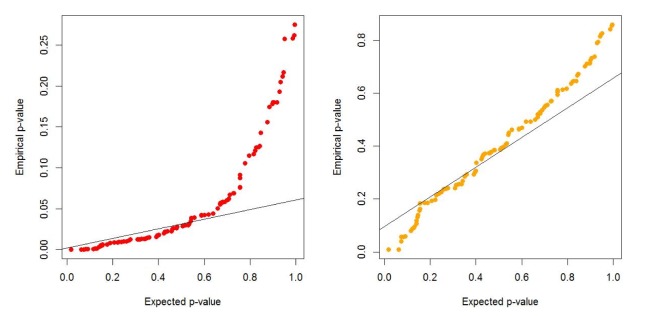
We generate 200 high-risk patients and 200 low-risk patients from each of the 70 penetrance models to create one simulated dataset, and we generate 100 datasets for each model. We set ┬Ą = 0.0, ╬▓ = ŌłÆ1.0, ╬│ = 1.0, Žā = 1.0. First, we check whether or not a type-I error is well preserved under the null hypothesis. As shown in Table 1 and Fig. 1, there are two kinds of type-I errors: uncorrected and corrected. The uncorrected type-I error is obtained from the asymptotic central chi-square distribution, whereas the corrected type-I error is calculated from the non-central chi-square distribution. For the non-centrality parameter, 5 or 10 permutations are performed when the censoring fraction is less than 0.3, but 30 permutations are needed to estimate the non-centrality under censoring heavier than 0.3. The results of Table 1 show that the type-I error is well controlled over all combinations of minor allele frequencies and censoring fractions. Fig. 1 displays the result of Table 1.
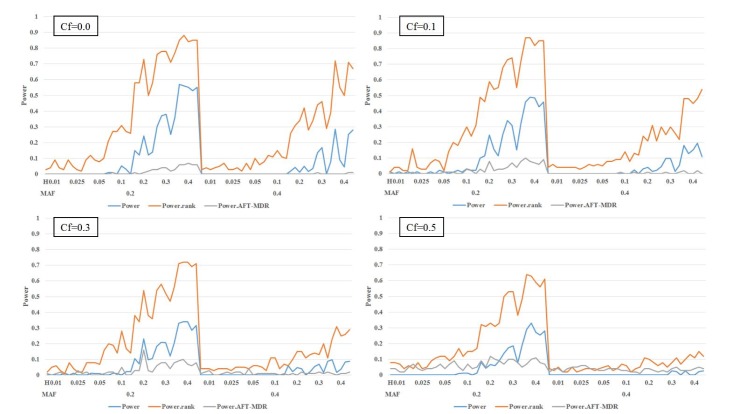
For the comparison of power, we define two powers, PBonf and PRank. PBonf is the proportion of p-values less than the nominal sizes after adjusting for multiple testing among 100 cases. However, the power of AFT-MDR is defined as the percentage of times that it correctly chooses the disease-causal model out of each set of 100 datasets. Thus, we comparably define the power of the proposed method as PRank, which is estimated as the percentage of times that the causal model has the smallest p-value out of all possible multi-locus models. We compared these three powers in the simulation study. In addition, we simulated two different scenarios according to the main effect.
In the first scenario, we consider the model without any main effect of SNPs; Fig. 2 and Table 2 display the power of the PBonf, PRank, and AFT-MDR methods over various combinations of two different minor allele frequencies, seven different heritabilities, and four different censoring fractions. As indicated in Fig. 2, PRank is greater than PBonf and the power of AFT-MDR for all cases, whereas the power of AFT-MDR is less than PBonf, although the difference is smaller, as the censoring fraction is larger than 0.5. The trend of these three powers is similar, in the sense that they increase as the heritability increases, whereas they decrease as the censoring fraction increases. In addition, it is shown that the power is relatively larger when the minor allele frequency (MAF) is 0.2 than when the MAF is 0.4. When the heritability is smaller than 0.1, the power is not larger than 0.3, but PRank rapidly increases as the heritability is greater than 0.1, but both PBonf and the power of AFT-MDR slowly increase.
On the other hand, in the second scenario, we generated the survival time by considering the main effect of SNP3 as follows:
After classifying the high-risk and low-risk groups by the standardized residual, as done in AFT-MDR, the indicator variable for the high-risk group, S, is defined, and the significance of the gene-gene interactions between SNP1 and SNP2 is tested under the following model:
From the simulation results, the power of PBonf, PRank, and AFT-MDR is similarly obtained and displayed in Fig. 3 and Table 3.
As shown in Fig. 3, the power of AFT-MDR is almost 0 for all cases, whereas PRank shows a similar trend, as shown in Fig. 2, when the main effect is not considered. However, the size of PBonf is also smaller, as shown in Fig. 2, and has almost no power when the MAF is 0.4 and censoring fraction is larger than 0.1. The effect of the censoring fraction is much larger on these three powers when the main effect is considered. Comparing PRank with the power of AFT-MDR, AFT-MDR hardly detects any interaction effect when the main effect of SNPs is considered in the model. However, PRank has slightly moderate power when MAF is 0.2 and the censoring fraction is smaller than 0.5.
Discussion
In this study, the AFT UM-MDR method was proposed by extending the UM-MDR method to the survival phenotype. In the first step, the standardized residual of the accelerated failure time model is used to classify the multi-level genotypes into high-risk and low-risk, as done in AFT-MDR, and a binary variable is defined for indicating the high-risk group. Then, in the second step, the significance test for an indicator for the high-risk group, defined in the first step, is conducted in the framework of the regression model, as done in UM-MDR. The big advantage of the proposed method over AFT-MDR is that it can test the significance of gene-gene interactions without intensive permutation procedures. Thus, the computing time is substantially reduced, and it is also flexible enough to consider the main genetic effect, as well as gene-gene interactions, in a model. Throughout the simulation studies, it is shown that the proposed method performs better than AFT-MDR for both with and without the main effect. These powers tend to increase as the heritability increases but decrease as MAF changes from 0.2 to 0.4 and the censoring fraction increases. Especially, the power of AFT-MDR is almost 0 under a model with a main effect, which implies that the gene-gene interaction can not be detected by AFT-MDR when any main genetic effect exists. On the other hand, the proposed method still detects gene-gene interactions, even when there is any main genetic effect. Interestingly, the censoring fraction critically affects the power when the main effect is considered, because the trend of the three powers seems to be robust over the censoring fraction when the main effect is not considered, as shown in Fig. 2.
As mentioned in Yu et al. [9], the UM-MDR is very flexible in the sense that various classification rules can be applied. We have an ongoing study in extending the UM-MDR to the Cox model, in which the martingale residual of a Cox model is used as a classification rule, as done in Cox-MDR.