Effect of Next-Generation Exome Sequencing Depth for Discovery of Diagnostic Variants
Article information
Abstract
Sequencing depth, which is directly related to the cost and time required for the generation, processing, and maintenance of next-generation sequencing data, is an important factor in the practical utilization of such data in clinical fields. Unfortunately, identifying an exome sequencing depth adequate for clinical use is a challenge that has not been addressed extensively. Here, we investigate the effect of exome sequencing depth on the discovery of sequence variants for clinical use. Toward this, we sequenced ten germ-line blood samples from breast cancer patients on the Illumina platform GAII(x) at a high depth of ~200×. We observed that most function-related diverse variants in the human exonic regions could be detected at a sequencing depth of 120×. Furthermore, investigation using a diagnostic gene set showed that the number of clinical variants identified using exome sequencing reached a plateau at an average sequencing depth of about 120×. Moreover, the phenomena were consistent across the breast cancer samples.
Introduction
Exome capture sequencing (simply referred to as "exome sequencing") is a next generation sequencing (NGS)-based technique which targets the genomic sequences of protein-coding regions ("exomes") of a species [1]. Although protein-coding regions constitute only 1% of the human genome, they harbor 85% of the mutations that have significant effects on disease-related traits [2]. Therefore, exome sequencing is a potential contributor to the understanding of diverse human diseases [2].
With a dramatic decrease in the cost and time required for the generation of sequences with high accuracy [3], exome sequencing is now widely used to understand many genetic diseases. For example, in the Netherlands, exome sequencing of ten blood samples from patients with severe intellectual disabilities allowed the identification of five new candidate genes associated with such disabilities [4]. Further, Ng et al. [1] sequenced the exomes of twelve human samples with or without Freeman-Sheldon syndrome (FSS), which is a rare dominantly inherited disorder, and observed an association between the MYH3 gene was responsible for FSS. Furthermore, Huh et al. [5] used exome sequencing to show that the c.234 G > A and c.1150C > T mutations in exon 18 of the HGSNAT gene were common in mucopolysaccharide patients. Exome sequencing techniques have also been used to understand the risks of various cancers, including those of the breast [67], prostate [8], pancreas [9], and others [101112]. Therefore, exome sequencing techniques have become a new primary paradigm for research on genetic diseases and cancers.
One important issue that needs to be addressed for the clinical utilization of NGS-based sequencing data is the adequate depth of sequencing. Sequencing depth is directly related to the cost and time required for the generation, processing, and maintenance of sequencing data [13]. In this vein, several studies have been performed to investigate the impact of sequencing depth on NGS data intended to identify genomic variants. For example, Hou et al. [14] investigated the discovery rates of single nucleotide polymorphisms (SNPs) and structural variants in healthy samples using whole genome sequencing (WGS) at an average sequencing depth of 180×. They observed that most of the variations were identified at an average depth of 100×. Meanwhile, Ajay et al. [15] calculated the genome coverage and discovery rates of variants in healthy samples using WGS data at 100× average mapped depth. The callable portion of the genome was 90% at a depth of 40×, and that of the protein-coding exome region was about 88% at a depth of 100×. However, these studies analyzed sequencing data derived from healthy individuals; the adequate depth required to discover clinically significant variations still needs to be addressed.
In this study, we investigated for the first time the effect of exome sequencing depth on the discovery of genomic variations for clinical use. Toward this, we performed exome sequencing in ten germ-line blood samples from breast cancer patients using the Illumina platform GAII(x) at a high depth of ~200×. We also checked the discovery rates of diverse variations as a function of the sequencing depth, using total and diagnostic gene sets.
Methods
Samples and sequencing
Total ten subjects were included in this study. They were enrolled from the Seoul National University Hospital and Seoul National University Bundang Hospital in Korea. They were all diagnosed with breast cancer, with a history of two or more affected family members and/or other risk factors, like bilateral breast cancer or young age of onset. Exome capture was carried out with the blood samples of the ten subjects using Agilent exome capture kits (SureSelect V2) and sequencing was performed on the (Illumina, San Diego, CA, USA).
Sequence alignment and variant calling
The raw reads in the prepared datasets were aligned to the hg19 reference genome, which was downloaded from the University of California Santa Cruz (UCSC) genome browser (http://genome.ucsc.edu/), using BWA (bwa-0.6.2) [16] with default parameters and a seed length of 45 bp. The Sequence Alignment and Mapping (SAM) files were converted to Binary Alignment and Mapping (BAM) files using SAMtools [17]. Picard (http://picard.sourceforge.net/) was used to mark and remove the polymerase chain reaction duplicates detected from the BAM files. The Genome Analysis Toolkit (GATK) [18] was then used for base quality recalibration and local realignment around the potential indel sites. The UnifiedGenotyper [19] in the GATK was used in the final step for variant calling using a Bayesian model. Variants were filtered by three types of filtering methods: (1) HARD_TO_VALIDATE: MQ0 ≥4 and [(MQ0/(1.0 × DP)] >0.1; (2) QualFilter: QUAL <10; and (3) Additional: QUAL <30.0 || MQ <20.0 || DP <7.
Annotation of genetic variants
We annotated variants using diverse tools and databases. The region information of variants (such as coding or intron regions and splice sites) was annotated using SnpEff [20]. Further, we predicted the functional effects of variations on genes (such as silent, nonsense, or missense SNPs) using SnpEff [20]. We also predicted whether an amino acid substitution significantly affects protein function (such as deleterious or tolerated SNPs) using SIFT [21]. In addition, we checked previously known SNPs using the dbSNP database [22]. We also checked clinical SNPs using the ClinVar database [23].
Analysis of depth of coverage in the diagnostic gene set
We extracted information for the positions of the 175 diagnostic genes from the hg19 reference genome, which was downloaded from the UCSC genome [24]. Based on this, we analyzed the depth of coverage and mapped mean depth according to increasing sequencing depths using Samtools "mpileup" with default parameters [17].
Count analysis of diverse variants
We calculated counts of the number of diverse clinical variants including nonsense, missense, and deleterious SNPs in coding regions of the total genome and diagnostic genes using in-house scripts.
Results and Discussion
Effect of exome sequencing depth on the discovery of variants for clinical use
To investigate the effect of exome sequencing depth on the discovery of clinically meaningful variants, we first sequenced the whole blood DNA samples from ten breast cancer patients using the Illumina platform GAII(x) at a high sequencing depth of ~200× (Fig. 1A). The platform covers 95% of the human exonic regions (http://www.gemomics.agilent.com). We then extracted data at depths of 20× to 200× by random selection and shuffling (Fig. 1B). Next, we performed read mapping, local realignment, duplicate marking, and base quality recalibration for each sample (Fig. 1C). Diverse variations such as SNPs, and insertions and deletions (indels) were called by using the GATK [16]. We also called function-related variations after the annotation of functional and regional information using various open databases and tools (Methods). Finally, we analyzed counts, positions, reading depths, and genomic coverage of the identified variations as a function of the sequencing depth using total or diagnostic gene sets (Fig. 1D).
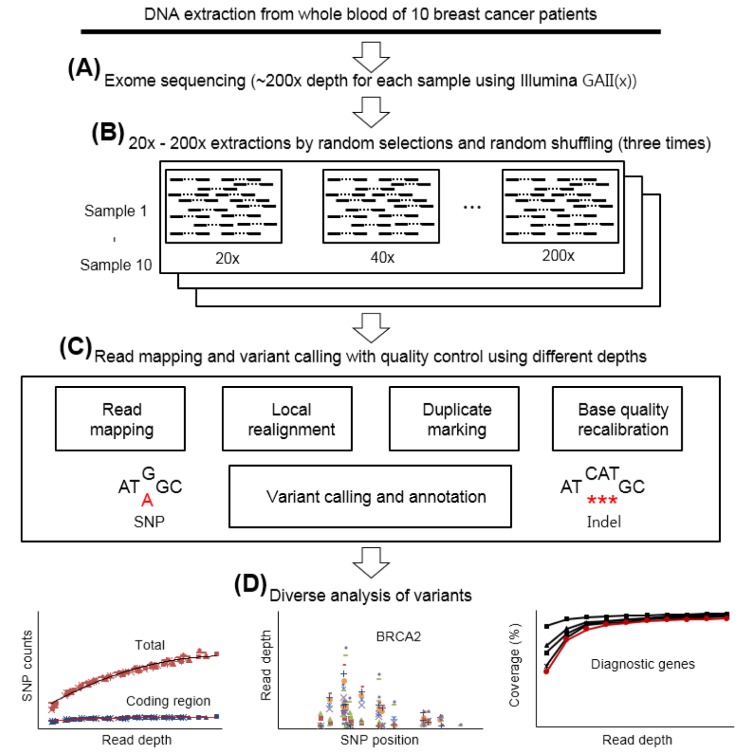
Study overview. (A) Whole exome deep sequencing of whole blood DNA samples from ten breast cancer patients at ~200× depth using the Illumina GAII(x). (B) Generation of ten datasets from 20× to 200× depths. Each dataset was selected independent of the others. (C) Read mapping and variant calling with quality control. Variations such as indels and single nucleotide polymorphisms (SNPs) were annotated with related functional and regional information. (D) Various analyses of identified variants, such as number of variants, read depth, and genomic coverage according to the mapped depths using both the whole genome and diagnostic genes.
We first checked the numbers of called SNPs in protein-coding (denoted as "coding SNPs") and total genomic regions (denoted as "total SNPs") of the platform in order to assess the effect of sequencing depth on the discovery of SNPs (Fig. 2A). As expected, the numbers of the identified total SNPs increased at higher average sequencing depths. For example, the median number of total SNPs for the ten samples gradually increased from 33,765 at 20× to 114,707 at 200× (an increase of 80,942 for the total SNPs). However, the median number of SNPs in the coding regions increased more rapidly in the first half (an increase of 59,073 from 20× to 120×), and reached a plateau at an average sequencing depth of around 120×. The increase in the number of coding SNPs was significantly smaller after that (an increase of 827 from 120× to 200×). This also means that the number of non-coding SNPs detected, both intronic and intergenic, increased rapidly after a depth of 120× was achieved. This phenomenon was more or less consistent across the sequencing data, from the first sample to the last. This trend was also preserved in the indel variants (Supplementary Fig. 1). Further, the number of indels in the total region of the platform (denoted as "total indels") increased steadily, but the increasing ratio of indels in the coding regions ("coding indels") leveled off after a depth of 120× was achieved.
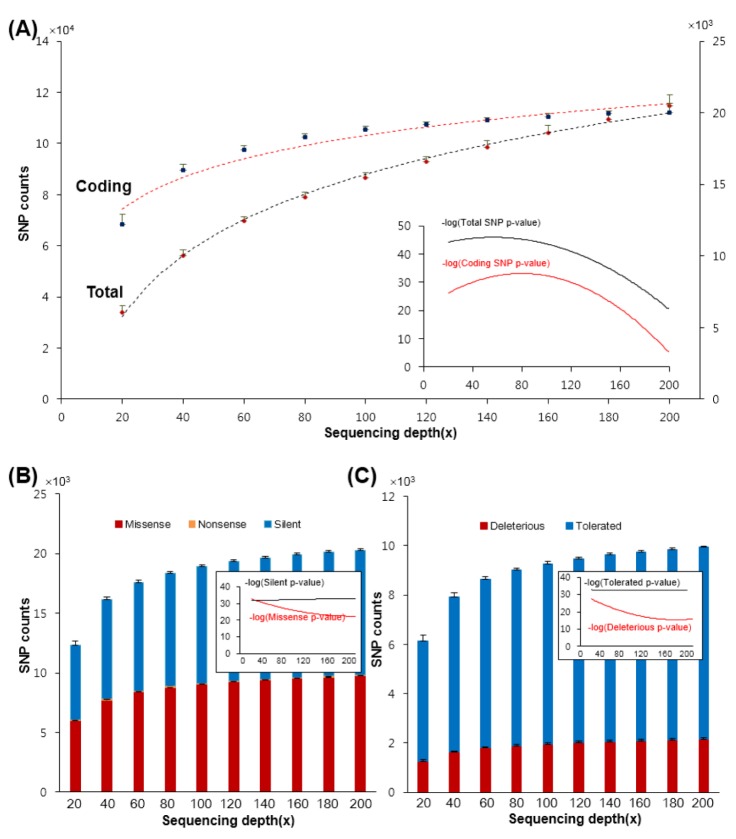
Numbers of called functional single nucleotide polymorphisms of human genes according to sequencing depths. (A) Numbers of called coding (blue) and total single nucleotide polymorphisms (SNPs) (red) with different sequencing depths: dashed lines are trend lines of means and their error ranges are represented. Solid lines in the inner chart represents how numbers of SNPs are significantly different from each own preceding. (B) The bar chart illustrates the numbers of called silent (blue), nonsense (orange), and missense (red) SNPs. (C) The bar chart illustrates the numbers of called tolerated (blue) and deleterious (red) SNPs in the SIFT database. (B) and (C) represent median values of the ten samples.
After functional annotation using the SnpEff database [20], we analyzed the numbers of functional SNPs (nonsense, missense, and silent) while increasing the sequencing depth. The results indicate that the median number of missense SNPs detected in the ten samples increased from 6,015 to 9,731 (Fig. 2B). However, the rate of increase was sharp in the first half, slowing significantly after 120×. We observed a similar trend for the nonsense SNPs as well. In addition, this phenomenon was also observed for the deleterious SNPs using the SIFT [21] (Fig. 2C). In summary, the number of deleterious SNPs detected, such as missense and nonsense, increased with the sequencing depth, but the ratio of this increase reduced significantly after 120×.
Mutations in splice sites are associated with many diseases [252627]. Therefore, we next analyzed the number of SNPs detected near splice sites with respect to the sequence depth (Fig. 3). We found that the number of called SNPs increased with increasing depth. However, many of the SNPs were detected in intronic regions around the splice sites, about twice the number of those detected in exonic regions, when increasing the sequencing depth. The number of detected SNPs, though, was lowest at the splice sites. This might imply that the sequences of the exonic regions surrounding the splice sites are well conserved than those of the intronic regions. However, researchers who wish to detect susceptible SNPs in splice sites might have to sequence at depths of more than 120×. Similarly, all the variations reported in the dbSNP database were also more common in the intronic, rather than the exonic regions (Supplementary Fig. 2).
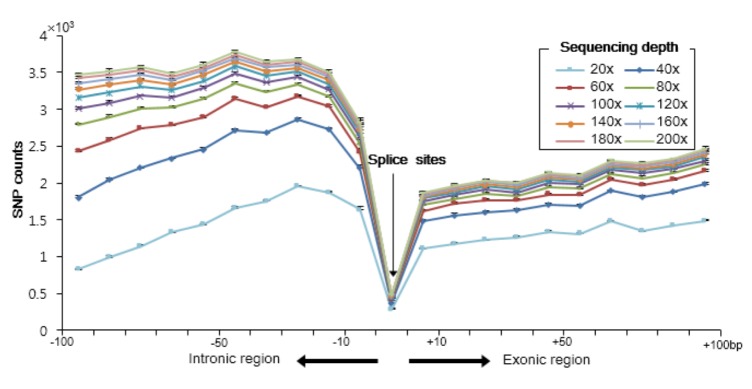
Numbers of single nucleotide polymorphisms (SNPs) near splice sites. Median numbers of SNPs for the ten samples are depicted. Different colors indicate increasing sequencing depths.
To summarize, the number of deleterious SNPs and indels detected in the coding regions (which are widely used in clinical diagnostics) was only weakly increased a depths more than 120×. In other words, a sequencing depth of 120× can be considered reasonable when using the exome capture sequencing technique to identify significant variations in diagnostic studies.
Exome sequencing depth for diagnostic genes
Next, we analyzed the genomic coverage and mean depths for 175 diagnostic genes (Supplementary Table 1) with respect to the diverse depths used. These genes have been widely used for diagnostic, prognostic, and therapeutic purposes at the Seoul National University Hospital in Korea. Specifically, these diagnostic genes are a subset of genes from the exome dataset. The percentage of mapped sequences in the coding regions of the 175 genes was almost constant for each depth in the individual samples, although there were slight variations across the samples (Supplementary Table 2). We further observed that the distributions of the average mapped depths between all human genes in the platform and the diagnostic genes were similar (Supplementary Fig. 3). Moreover, with increasing depths, as expected, the median average mean depth of the ten samples increased almost constantly from a depth of 13.3× to 125.1× (on average, an increase of 12.4× per depth) (bar charts in Fig. 4). In contrast, the coverage curves for the coding regions of the diagnostic genes followed logarithmic trends, regardless of the thresholds of the minimum read depths (line charts in Fig. 4). For example, based on the regions with more than 1× mapped depth, the coverage increased from 99.3% to 99.7% (0.4% increase) at 120× depth compared to that at 20×. However, the coverage increased by only 0.1% at a depth of 80× (totally, 200×). Similarly, at 25× minimum mapped depth, over 77.9% of the genomic regions were covered when 120× was used. Moreover, a 64.6% increase in coverage was observed in the first half (from 13.3% at 20× to 77.9% at 120×), whereas a 7.6% increase was observed in the latter (from 77.9% at 120× to 85.5% to at 200×). It is known that a 25× mapping depth is the minimum for detecting heterozygous alleles [2829]. In other words, the genomic coverage of the diagnostic genes was not increased significantly after 120×.

Mean mapped depth and coverage of diagnostic genomic regions according to sequencing depth. Lines indicate the coverage proportion of the genomic regions of 196 diagnostic genes with specific minimum depths, according to the sequencing depths. Red line: genomic coverage >25×. Bars indicate mean mapped depths (mean depth).
We next checked the number and positions of SNPs that have been detected in the early onset breast cancer 2 gene (BRCA2), one of the major risk factors in the development of this cancer [3031]. The results indicate that the read depths of SNPs in BRCA2 increased with increasing sequencing depths (Fig. 5A). However, most of the SNPs had been identified by the time 120× depth was reached, and no more were identified after 140× depth was used (Fig. 5B). Only mapped read depths increased with increasing sequence depths. Similar phenomena were also observed in the early onset breast cancer 1 gene (BRCA1) (Supplementary Fig. 4), another major risk factor in this cancer type [32].
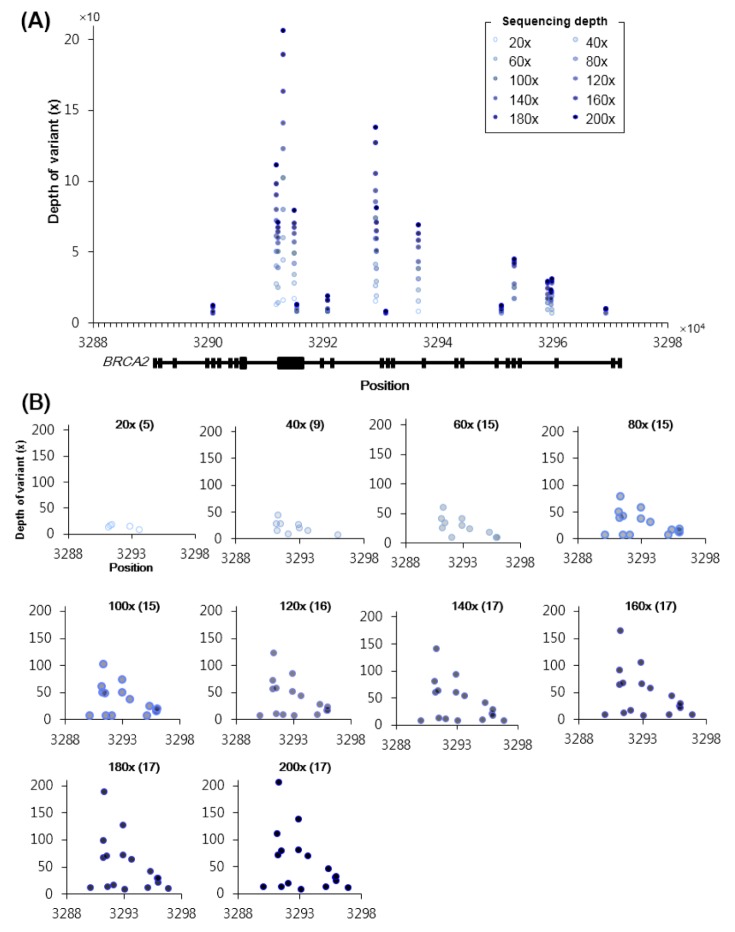
Mapped depths and positions of the called single nucleotide polymorphisms (SNPs) in BRCA2. (A) Mapped depths (y-axis) of called coding SNPs in BRCA2 (x-axis) according to increasing sequencing depths. The figure at the bottom indicates the exonic regions of BRCA2. (B) Different views of panel (A) based on increasing sequencing depths. The number of called SNPs is presented in parenthesis. For example, 120× (16) indicates that 16 SNPs were successfully called in the 120× dataset.
Further, we validated our depth recommendation for diagnostic variant detection using exome sequencing. To this end, we analyzed the numbers of non-synonymous (NS) SNPs, splice site acceptor or donor site (SS), and coding indel (I) variants in the diagnostic genes as a function of the diverse depths used (Fig. 6). The numbers of NS/SS/I variants of all human genes in the platform increased with increasing sequencing depths (Fig. 6A). However, the numbers of NS variants in the diagnostic genes converged sooner; there was least increase in the NS variants after 60× was used (Fig. 6B). We analyzed the numbers of NS variants using the variations in the ClinVar database [23], which is well known for clinical variants. Although there was an increase in the numbers of NS clinical variants, the rate of increase was quite low after 120× was used (Fig. 6C). We also checked the variations related to breast cancer using only the clinical variants in the ClinVar database (Fig. 6D). The results indicate that all variations associated with breast cancer were detected at 140× depth, regardless of the sample. In summary, with exome capture sequencing technique, the most significant clinical variations can be detected at an average depth of 120×.
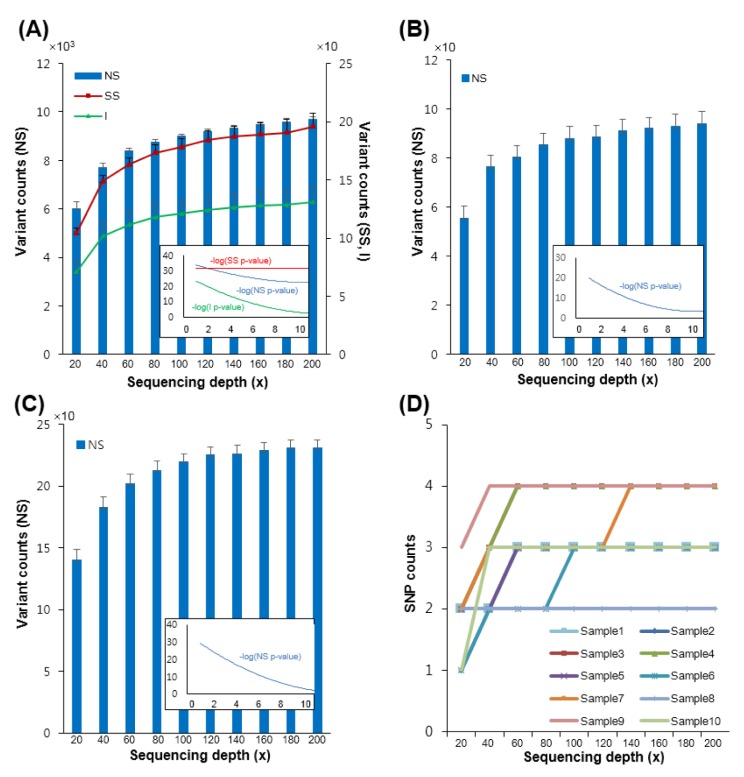
Numbers of called non-synonymous (NS)/splice site acceptor or donor site (SS)/coding indel (I) in the diagnostic gene set and the ClinVar database according to different sequencing depths. (A, B) Numbers of NS/SS/I per depth used in the human genome (A) or in the 175 diagnostic genes (B). (C) Numbers of NS for the diagnostic genes in the ClinVar database per number of depth used. (D) Numbers of variants in the genes associated with breast cancer among the diagnostic genes in the ClinVar database. The x-axis represents increasing sequencing depths.
Finally, we measured the discovery rates of variants at different sequencing depths using Sanger sequencing (Fig. 7). The results show that more than 90% variations were validated when 120×. Hence, we conclude that, using the exome capture sequencing technique, the most reliable variants are detected at an average depth of 120×.
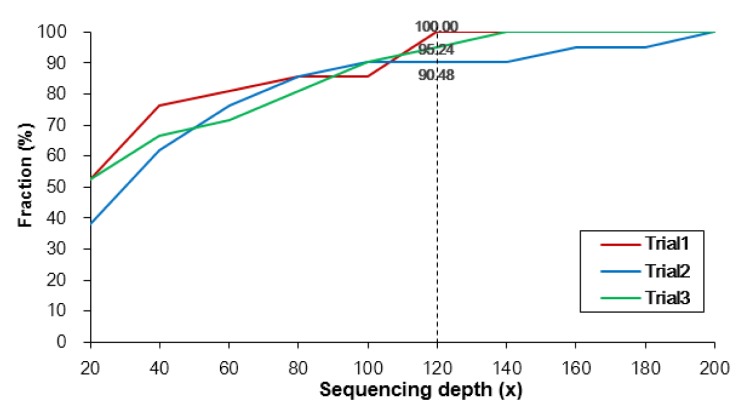
Fraction of 21 validated single nucleotide polymorphisms (SNPs) in the called SNP set according to different sequencing depths. The median numbers of called SNPs are depicted for the ten samples. Different colors indicate independent trials.
In this study, we determined the effects of exome sequencing depth on the discovery of function-related diverse variants of human genes and diagnostic genes, especially for clinical use. For this purpose, we investigated the exome deep-sequencing data for whole blood DNA samples obtained from ten breast cancer patients using an Illumina platform GAII(x) as a function of sequencing depth.
The number of genomic variants identified using exome sequencing reached a plateau at an average sequencing depth of ~120×, and this depth allowed detection of most variations in the human genes. The results were also consistent with a diagnostic gene set and were similar across samples. Considering the diverse costs and time related to generation, processing, and maintenance of sequencing data, this suggests that a feasible depth for clinically relevant exome sequencing is about 120×. These findings can be used to address important questions on the adequate depth for exome sequencing techniques for clinical use.
Acknowledgments
This research was supported by a grant from the Korea Health Technology R&D Project through the Korea Health Industry Development Institute (KHIDI), funded by the Ministry of Health and Welfare, Republic of Korea (grant number: HI14C32010100). It was also supported by grants from the National Research Foundation of Korea (NRF-2011-0030049, NRF-2014M3C9A3064552), Next-Gen Bio-Green21 (PJ008019, PJ008068), and the KRIBB initiative program.
References
Supplementary Material
Supplementary data including two tables and four figures can be found with this article online at http://www.genominfo.org/src/sm/gni-13-31-s001.pdf.
Supplementary Table 1
List of diagnostic genes
Supplementary Table 2
Percentages of mapped depths in coding regions of the 175 diagnostic genes per data set per sample
Supplementary Fig. 1
Numbers of called functional indels of human genes according to mapped depths. Numbers of indels in coding (blue) and total (red) regions according to average mapped depths per sample (denoted by different shapes) are depicted: dashed lines are trend lines of means, and error ranges are represented. Solid lines in the inner chart represents how numbers of indels are significantly different from each own preceding.
Supplementary Fig. 2
Numbers of single nucleotide polymorphisms (SNPs) in the dbSNP database. Coverage of all SNPs n the dbSNP database in intronic (orange) and exonic (blue) regions are depicted.
Supplementary Fig. 3
Fractions of genes according to average mapped depth. Each panel indicates the fraction of total genes in the platform (black) and diagnostic genes (red), according to average mapped depth for each data set with a different depth. Median values of the ten samples were used.
Supplementary Fig. 4
Mapped depths and positions of identified single nucleotide polymorphisms (SNPs) in BRCA1 (A) Mapped depths (y-axis) of called coding SNPs in BRCA1 (x-axis) according to increasing sequencing depths. The figure at the bottom indicates the exonic regions of BRCA1. (B) Different views of (A) based on increasing sequencing depths.