Comparison of SNP Variation and Distribution in Indigenous Ethiopian and Korean Cattle (Hanwoo) Populations
Article information
Abstract
Although a large number of single nucleotide polymorphisms (SNPs) have been identified from the bovine genome-sequencing project, few of these have been validated at large in Bos indicus breeds. We have genotyped 192 animals, representing 5 cattle populations of Ethiopia, with the Illumina Bovine 8K SNP BeadChip. These include 1 Sanga (Danakil), 3 zebu (Borana, Arsi and Ambo), and 1 zebu × Sanga intermediate (Horro) breeds. The Hanwoo (Bos taurus) was included for comparison purposes. Analysis of 7,045 SNP markers revealed that the mean minor allele frequency (MAF) was 0.23, 0.22, 0.21, 0.21, 0.23, and 0.29 for Ambo, Arsi, Borana, Danakil, Horro, and Hanwoo, respectively. Significant differences of MAF were observed between the indigenous Ethiopian cattle populations and Hanwoo breed (p < 0.001). Across the Ethiopian cattle populations, a common variant MAF (≥0.10 and ≤0.5) accounted for an overall estimated 73.79% of the 7,045 SNPs. The Hanwoo displayed a higher proportion of common variant SNPs (90%). Investigation within Ethiopian cattle populations showed that on average, 16.64% of the markers were monomorphic, but in the Hanwoo breed, only 6% of the markers were monomorphic. Across the sampled Ethiopian cattle populations, the mean observed and expected heterozygosities were 0.314 and 0.313, respectively. The level of SNP variation identified in this particular study highlights that these markers can be potentially used for genetic studies in African cattle breeds.
Introduction
Ethioipian cattle breeds are the core to sustain the livelihoods of most of the farming and pastoral communities. Indigenous breeds are known for their better adaptation for low input systems, heat tolerance, disease resistance, local preferences, and cultural and aesthetic values. The unique genetic background of Ethiopian cattle and their adaptation to the low input system support their conservation and breed development. However, common for developing countries, the genetic diversity and the genetic merits of most Ethiopian indigenous cattle populations are not yet well understood and exploited. Consequently, some of the indigenous cattle populations are already extinct and endangered, while the risk status of many of them is unknown. A recent microsatellite based study revealed that most Ethiopian cattle breeds are under threat from uncontrolled breeding practices and are at high risk of becoming genetically homogenous [1].
Studies on genetic diversity of Ethiopian cattle have focused on limited cattle breeds, and all of these studies employed low-density microsatellite, mitochondrial, or Y-chromosome markers [1, 2]. A wide range of molecular markers has been developed and used for molecular characterization of populations. Among these, single nucleotides polymorphisms (SNPs) are the most abundant molecular markers in the genome. They are widely dispersed throughout genomes, with a variable distribution among species; genotyping results are easy to reproduce in different laboratories and are simple to score. The usefulness of SNPs in population diversity and structure studies has been demonstrated in several studies in livestock species [3-6].
Although a large number of SNPs have been identified from the bovine genome-sequencing project, few of these have been validated at large in Bos indicus breeds. Yet, the level of polymorphism in Ethiopian cattle population has not been known and analyzed. Prior to this study, no SNPs have been described for these populations. Hence, we report the first preliminary findings on SNP variation in Ethiopian indigenous cattle populations and Hanwoo breed. This study is part of the collaborative project between the Korean Government, the Ethiopian Institute of Agricultural Research, and the International Livestock Research Institute, designed with the objectives to estimate genetic diversity between and within populations using SNP markers. We also evaluated the level of SNP polymorphisms in selected Ethiopian cattle populations and compared to the Hanwoo cattle breed.
Methods
Sampling and DNA sample collection
Nasal samples were collected using Performagene LIVESTOCK's nasal swab DNA collection kit (DNA Genotek Inc., Kanata, ON, Canada) from 5 cattle populations-Ambo, Borana, Arsi, Horro, and Danakil-inhabiting different agro-ecologies. Sampling was carried out by considering potential geo-environmental gradients (highland, low-lands), production systems (mixed-crop livestock, pastoral/agro-pastoral), and ethnic groups raising predominantly the populations (Table 1, Fig. 1). Representative sites were selected based upon secondary data obtained from livestock departments and expertise. Herdsmen and owners of the animals were contacted to ensure that the animals were not genetically related. Animals were randomly sampled from multiple herds. Genomic DNA was extracted from nasal samples based on laboratory protocols. In addition, DNA samples from Hanwoo cattle were included for comparison purposes.
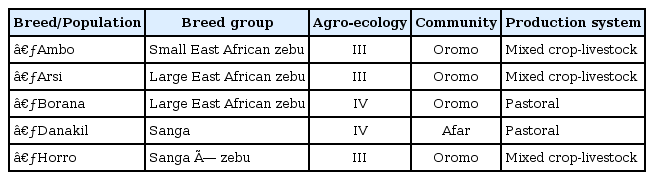
Summary of sampled populations and their characteristics with respect to breed group, distribution over ecological zones, and affinity to ethnic communities
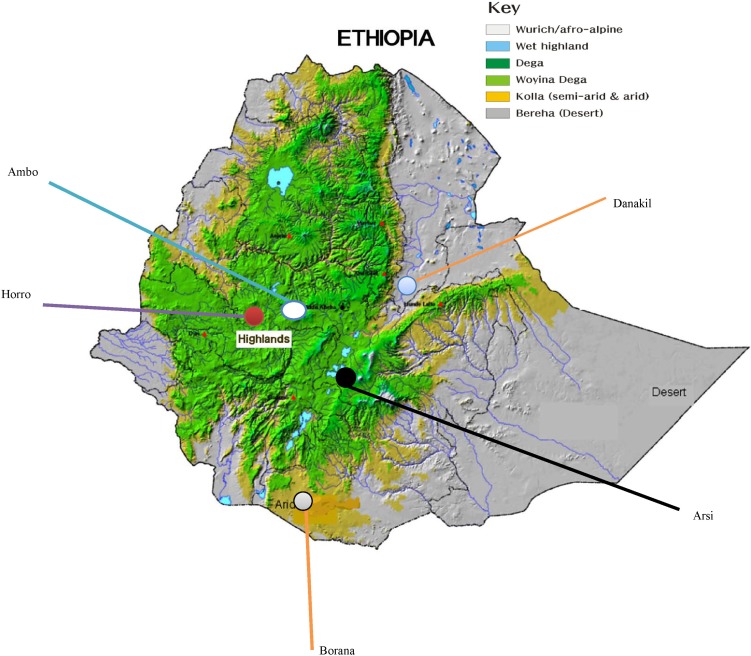
Map of Ethiopia showing location of sampled populations.
Breeds/populations descriptions
The Danakil cattle breed is grouped under Sanga and originated in East and Northeast Africa, where Sanga cattle evolved. The Horro breed was formed as a result of interbreeding between zebu-Sanga and Sanga-zebu admixture populations. The large-sized Borana breed descended from secondary cattle domestication in the arid areas of the 'Fertile Crescent' about 5000 BP [7]. The breed is predominantly distributed in arid and semi-arid agro-ecologies of the Borana plateau. The small-sized Arsi cattle probably developed from a group of small short-horned Abyssinian zebu by the highland Oromo people. The Ambo cattle is grouped under Small East African zebu and is believed to have descended from the recent introductions of zebu into Africa [8]. Pictures of sampled animals are depicted in Fig. 2.
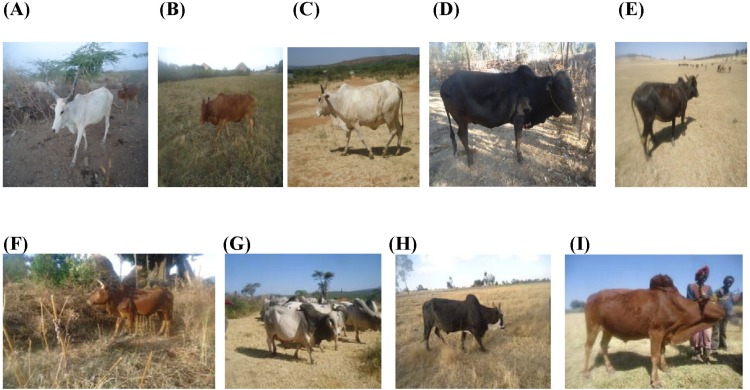
Pictures of sampled Ethiopian cattle populations. (A) Danakil adult female. (B) Horro adult female. (C) Borana adult female. (D) Arsi adult female. (E) Ambo adult female. (F) Horro adult male. (G) Borana adult males. (H) Arsi adult male. (I) Ambo adult male.
Genotyping and quality control
In total, 192 animals representing 5 cattle populations of Ethiopia were genotyped for 8,773 SNPs with the Illumina Bovine 8K SNP BeadChip (Illumina, San Diego, CA, USA) according to Illumina protocols [9]. Over the loci, the average GenTrain score, 10% GenCall (10% GC) score, and 50% GenCall (50% GC) score were 0.86, 0.87, and 0.83, respectively. In this experiment, about 99.91% of the markers identified had a GenTrain score greater than the minimum acceptable value (0.25) (http://www.illumina.com). All of the samples had at least a 0.20 or greater 10% GC score, while the 50% GC score ranged from 0.75 to 0.91, with the average call rate of 0.913. For Hanwoo cattle, about 51,162 SNPs were genotyped using the Illumina Bovine 50K SNP BeadChip [10]. 8K and 50K genotypes were merged using Golden Helix SNP Variation Suite software version 7 (Golden Helix, Inc., Bozeman, MT, USA). To ensure the highest quality of data from the 8K and 50K SNP BeadChips, duplicate marker genotypes were identified and dropped. Finally about 7,045 SNPs that were common for both Bead-Chips were subjected to analysis. Markers selected for diversity analysis were all located on autosomal chromosomesand had at least an 80% call rate.
Data analysis
Frequency of minor allele frequency (MAF), distribution, and deviation from Hardy-Weinberg equilibrium (HWE) were estimated using Golden Helix SNP Variation Suite version 7 (Golden Helix, Inc.). The SAS GLM package version 9.1 (SAS Institute Inc., Cary, NC, USA) procedure was used to test the effect of breed on MAF variation. Observed and expected heterozygosities and hierarchical F-statistics were estimated using GENALEX software [11].
Results and Discussion
MAF variation
The MAF for each SNP was calculated from the genotypic data and is presented in Table 2. Analysis of 7,045 markers revealed that the mean MAF was 0.23, 0.22, 0.21, 0.21, 0.23, and 0.29 for Ambo, Arsi, Borana, Danakil, Horro, and Hanwoo cattle, respectively. A significant difference was observed between the Ethiopian indigenous cattle populations and Hanwoo (p < 0.001). The average value for Hanwoo was 32% higher than the value for Ethiopian cattle populations. The overall MAF in the present finding for indigenous Ethiopian cattle breeds is higher than an earlier report for indicine breeds but lower than the average value reported for most taurine breeds [3]. The value found for Hanwoo cattle was comparable with the previous results for taurine breeds but higher than the reported average for the same breed [10, 12]. This could be attributed to the different marker density used, and a higher density marker (Illumina Bovine 50K SNP BeadChip) was used in the previous study. The higher values for taurine breeds can be explained by the fact that SNP loci used in this study were detected in taurine breeds, and their average minor allele frequency was much lower in indicine breeds.
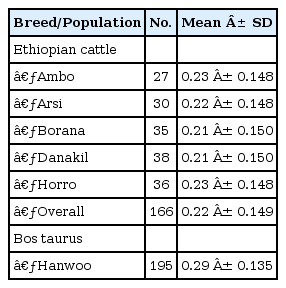
Mean MAF values in indigenous Ethiopian cattle populations and in Korea Hanwoo cattle
Across the Ethiopian cattle populations, common variant MAFs (≥0.10 and ≤0.5) accounted for 74% of the total SNPs (Table 3). Hanwoo cattle displayed a higher proportion of common variant SNPs (90%). Rare variant MAFs were observed in about 9% and 4% of markers in the Ethiopian and Hanwoo breeds, respectively. The relatively higher proportion of fixed alleles in Ethiopia cattle populations could be attributed to the inbreeding as a result of uncontrolled breeding practices. A common variant MAF proportion of 83% was reported in sheep breeds [5]. The distribution of MAFs revealed that nearly 34.08% of the markers in Ethiopian cattle populations and 53% in Hanwoo cattle displayed a high degree of polymorphisms (0.3 ≤ MAF ≤ 0.5). Yet, this value was higher than an earlier report both for Hanwoo (25%) and Holstein (28%) [12]. Much higher MAFs were detected in Bos taurus breeds than in Bos indicus breeds [3]. The proportion of fixed markers varied among the sampled populations. Among the Ethiopian cattle populations, the highest (8.96%) and lowest (6.30%) were obtained in the Borana and Ambo populations, respectively. The Hanwoo breed displayed a lower level of fixed SNPs (1.10%).
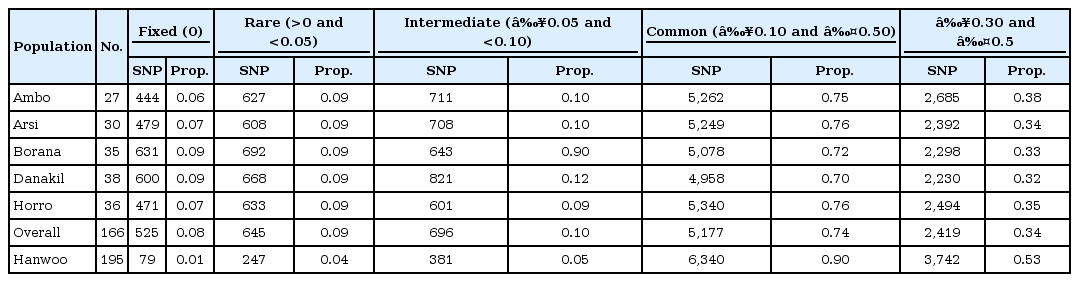
Minor allele frequency distribution of 8K BeadChip SNP in Bos taurus and in Ethiopian cattle breeds
On average, 83.36% of the markers displayed polymorphisms (MAF > 0.05) within Ethiopian cattle populations, and the remaining 16.64% of the SNPs considered as monomorphic. The Hanwoo breed showed the highest proportion of polymorphisms (94%) (Fig. 3). The level of polymorphic SNPs in the present study was higher than what was previously reported for taurine breeds [10]. But, it was in close agreement with the value reported for sheep breeds using genome-wide SNPs [5]. Similarly, Gautier et al. [13] reported a lower rate of polymorphisms using 696 SNPs localized in BTA03 from European and West African cattle breeds (94.6% and 81.8%), respectively. The higher observed polymorphisms in Hanwoo cattle could explained by the fact that most of the bovine sequence data available in the database are from Bos taurus breeds.
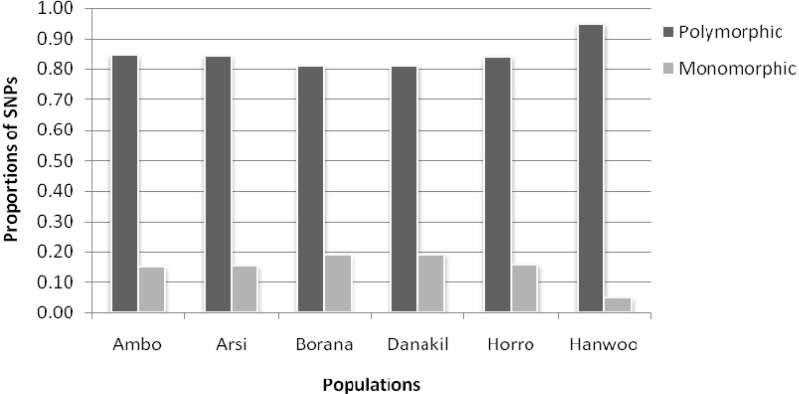
Polymorphic and monomorphic dynamics of single nucleotide polymorphism (SNPs).
Genetic diversity among Ethiopian cattle populations
An examination of the variability within breeds was carried out to compare the level of hererozygosity between the populations, and the results are presented in Table 4. Across the sampled Ethiopian cattle populations, the mean observed and expected heterozygosities were 0.314 ± 0.001 and 0.313 ± 0.001, respectively. The mean values were lower than the values reported from a microsatellite markers analysis [1]. However, they were in concurrence with the values reported using SNPs for the Angus breed (0.332) [14] and for sheep breeds [5].
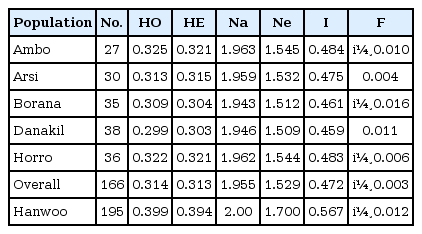
Observed (HO) and expected heterozygosities (HE), mean number of different alleles (Na), mean number of effective alleles (Ne), Shannon's information index (I) and fixation index (F) in indigenous Ethiopian and Korean cattle populations
The overall estimated F-statistics were FIS = -0.003 (within-population inbreeding estimates) and FIT = 0.016 (total inbreeding). Among the Ethiopian cattle populations, genetic differentiation (FST) was estimated at 0.019. Genetic characterization of Ethiopian cattle breeds using microsatellites reported within-population inbreeding of 0.071, total inbreeding of 0.083, and genetic differentiation of 0.013 [1]. The FST for Ethiopian cattle populations was low, which could be due to their common ancestral origin.
There were loci significantly deviating from HWE. Overall, significant deviation from Hardy-Weinberg proportions (p < 0.05) was observed for 405 markers in Ethiopian cattle populations (Ambo, 441; Arsi, 475; Borana, 314; Danakil, 314; and Horro, 481) and in 549 of the markers in Hanwoo. The highest number of SNPs that departed from HWE was observed in Hanwoo cattle, whereas within the Ethiopia cattle populations, Borana displayed lower proportions of markers (SNPs) deviating from HWE. The variation in proportion of SNPs displaying deviation from HWE among the sampled populations could be explained by selection pressure and population structure (stratification, admixture).
In conclusion, a significant difference was detected for the rate of polymorphisms and MAFs between the Hanwoo and the Ethiopian cattle populations. The level of variation identified in this particular study highlights that these markers can be potentially used for genetic studies in African cattle populations. The high within-breed diversity observed in Ethiopian indigenous cattle populations could be an opportunity and allow improvements through within-population selection schemes.
Acknowledgments
This study was funded by the Africa & International Organization Programs under the National Research Foundation of Korea and the Ministry of Education and Human Resource Development. Participant framers and pastoralists are highly thanked for their willingness to allow us to collect samples from their animals and for their indisputable cooperation. We are grateful to officials from livestock departments in Ethiopia for their guidance and facilitation of the sample collection process. We would like to express our gratitude to ILRI-Addis for providing logistical support.