Semantic Modeling for SNPs Associated with Ethnic Disparities in HapMap Samples
Article information
Abstract
Single-nucleotide polymorphisms (SNPs) have been emerging out of the efforts to research human diseases and ethnic disparities. A semantic network is needed for in-depth understanding of the impacts of SNPs, because phenotypes are modulated by complex networks, including biochemical and physiological pathways. We identified ethnicity-specific SNPs by eliminating overlapped SNPs from HapMap samples, and the ethnicity-specific SNPs were mapped to the UCSC RefGene lists. Ethnicity-specific genes were identified as follows: 22 genes in the USA (CEU) individuals, 25 genes in the Japanese (JPT) individuals, and 332 genes in the African (YRI) individuals. To analyze the biologically functional implications for ethnicity-specific SNPs, we focused on constructing a semantic network model. Entities for the network represented by "Gene," "Pathway," "Disease," "Chemical," "Drug," "ClinicalTrials," "SNP," and relationships between entity-entity were obtained through curation. Our semantic modeling for ethnicity-specific SNPs showed interesting results in the three categories, including three diseases ("AIDS-associated nephropathy," "Hypertension," and "Pelvic infection"), one drug ("Methylphenidate"), and five pathways ("Hemostasis," "Systemic lupus erythematosus," "Prostate cancer," "Hepatitis C virus," and "Rheumatoid arthritis"). We found ethnicity-specific genes using the semantic modeling, and the majority of our findings was consistent with the previous studies - that an understanding of genetic variability explained ethnicity-specific disparities.
Introduction
Tremendous efforts have been made to identify ethnicity-specific single-nucleotide polymorphisms (SNPs) in human diseases [1, 2]. Dosage effect or disease susceptibility is not equal among ethnic groups. Type 2 diabetes prevalence is 12.8%, 8.4%, and 6.6% in non-Hispanic blacks, in Mexican-Americans, and in non-Hispanic whites aged 20 years or older [3]. Ethnic differences were causes of environmental exposure and experiences with health care, and these ethnic disparities likely influence different outcomes in people with certain diseases [4]. Genetic differences also cannot ignore its important role in determining ethnic disparities. Despite recent advances in the genetic studies for ethnic disparities, little is known about how ethnic genetic differences contribute to inter-ethnic disparities in disease risk or disease-related complex traits [5].
Recently, semantic modeling has gained attention as a powerful tool for organizing and integrating biological big data [6]. Semantic technology is needed to provide the knowledge to gain an adequate interpretation of integrated biological systems [7]. Recent advances in ontology development, like semantic modeling, are considered to contribute to the next-generation approach by enabling the researcher to actually ask scientific questions instead of constructing complicated databases for scientific questions and answers [8]. This combination of data integration and visualization could provide important insights into heterogeneous data on millions of genes, chemical compounds, diseases, and pathways [9, 10].
To model a semantic network, the BioXM software is a customizable knowledge management program for large scientific data, and the latest solution is designed to provide meaningful interactions through graphical browsing [11]. Through an advanced query builder, the knowledge consisting of many different and connected queries is flexibly examined. In this way, models for a research project can be constructed and extended effectively. Many data modeling studies and software developments have been advanced, but there are relatively few studies using semantic modeling for ethnicity-specific SNPs.
To evaluate the ethnic disparities, in the current study, we identified ethnicity-specific SNPs for three populations, including North Americans with European ancestry (CEU), Japanese from Tokyo (JPT), and Yorubans from Ibadan (YRI) from HapMap, and constructed a semantic model for ethnicity-specific SNPs. We expect that semantic model-based research will provide valuable information on ethnicity-specific gene-based SNPs and strongly affect useful knowledge in ethnic disparities.
Methods
Study subjects
We downloaded the SNPs data from Haplotype Map (HapMap) phase 3 (http://www.hapmap.org) for CEU (Utah residents with Northern and Western European ancestry), JPT (Japanese in Tokyo, Japan), and YRI (Yoruba in Ibadan, Nigeria). We focused on the gene-based SNP associations in the three ethnicities, because ethnicity is a highly heritable polygenic quantitative trait of biomedical importance. Ethnicity-specific SNPs were obtained by eliminating common SNPs.
Enrichment analysis for SNP-based gene set
Ethnicity-specific HapMap SNPs were mapped to genes from UCSC RefGene (http://genome.ucsc.edu; ver. hg18) [12]. For the mapped genes, gene set enrichment analysis (GSEA) was performed using the Database for Annotation, Visualization, and Integrated Discovery (DAVID ver. 6.7) [13] with Gene Ontology (GO) terms, including biological process (BP), cellular component (CC), and molecular function (MF). The p-values were calculated for the probability of getting a set of genes within a given GO group.
Semantic modeling
To look for diverse interactions of ethnicity-specific SNPs, we constructed a semantic model using BioXM [7], which efficiently manages knowledge, such as complex scientific research data. The model provides semantic networks with useful relationship information between participating entities. Our semantic model consists of seven entities, including "Gene [14]," "Pathway [14]," "Disease [14]," "Chemical [14]," "Drug [15]," "SNP [12]," and "ClinicalTrials (http://www.clinicaltrials.gov)", and 10 relations, including "Pathway-Gene," "Disease-Pathway," "Disease-Chemical," "Gene-Disease," "Gene-Chemical," "SNP-Gene," "Chemical-Pathway," "Chemical-Drug," "ClinicalTrials-Disease," and "Drug-ClinicalTrials." Conversion of all data to entity input format was parsed using Python.
Results and Discussion
Discovery of ethnicity-specific SNPs
We identified ethnicity-specific SNPs by eliminating common SNPs from HapMap samples and mapped the SNP positions to the UCSC RefGene lists. 22, 25, three 332 genes were identified in the CEU, in the JPT individuals, and in the YRI individuals, respectively (Fig. 1). Comparison of the three sets showed that YRI individuals had a biased order of SNP-based genes. This result was a consensus among previous evolutionary findings. CEU and JPT belong to the same cluster, together with Amerindians and Australopapuan, while YRI belongs to a separate cluster showing the first split between Africans and non-Africans [16, 17]. African populations subdivided from other sub-Saharan African populations, and a small subset of this population migrated out of Africa in the past 100,000 years. African and non-African populations divided in the past 40,000 years. Phylogenetic analysis of Y chromosomal haplotypes, mtDNA, and autosomes are indicative of the longest history of population subdivision in Africa. Africans are the most ancestral population in human and have fewer sites in linkage disequilibrium, compared with non-African populations [18].

Visualization of the physical location for the ethnicity-specific genes from HapMap samples (CEU, red; JPT, blue; and YRI, green). The horizontal axis is the genomic location and the vertical axis is the number of chromosomes. The colored figure shows a total number of ethnicity-specific single-nucleotide polymorphisms on the chromosome.
To explore the meaningful biological information of structural variations, we performed GSEA for the SNP-based genes using GO categories (BP, CC, and MF) in the DAVID tool. The significantly categorized functions (p < 0.01) of SNP-based genes for YRI are shown as pie charts in Fig. 2, but none was significantly enriched for CEU and JPT. Six groups of BP and four groups of MF had significant enrichment score ranges of 1.67-4.85 and 7.16E-04-0.002, respectively. The top pie chart in BP presents G-protein-coupled receptor protein signaling pathway, including chemotaxis, and defense response to bacterium (Fig. 2A). In the enriched region, 8% of BP was chemotaxis (GO: 0006935) with an enrichment score of 3.88. Chemotaxis contributes to enhancement of disease aggressiveness in African-Americans [19]. The MFs that were significantly enriched were G-protein-coupled receptor activity and binding, olfactory receptor activity, and transmembrane receptor activity (Fig. 2B). Enriched functions in cellular components were keratin filament (GO:0045095) with an enrichment score of 5.86, which contained the KRTAP gene family (KRTAP12-3, KRTAP4-11, KRT14, KRTAP4-4, KRTAP9-8, KRTAP10-7, KRTAP10-8). KRTAP genes are up-regulated in white hair than in black hair by a microarray analysis. Immunoreactivity for KRTP genes in white hair follicles was increased compared with black hair. Therefore Choi et al. [20] suggested that greying hair, a sign of aging, is associated with hair growth rate.
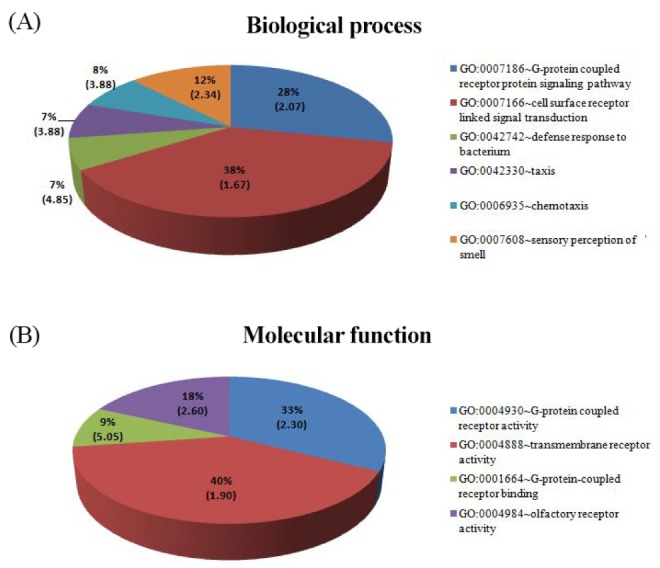
Gene ontology (GO) enrichment analysis for YRI-specific single nucleotide polymorphism-based genes. Biological process (A) and molecular function (B). GO groups having significant enrichment scores less than 0.01 are shown. YRI, Yorubans from Ibadan.
Semantic modeling for ethnicity-specific SNPs
Semantic modeling is an emerging method for comprehensively understanding complicated BPs and spacious networks [7]. The continuous production of increasingly large-scale data in biology needs better visualization of complex and huge biological data. We constructed a semantic network model in order to analyze biologically functional implications for ethnicity-specific SNPs. Overall, network entities were used, such as "Gene" (records, 46,354), "Pathway" (records, 362), "Disease" (records, 9,647), "Chemical" (records, 153,021), "Drug" (records, 6,712), "ClinicalTrials" (records, 1,273), and "SNP" (records, 379), and pairwise relationships between entity-entity were curated as "Gene-Pathway" (records, 46,354), "Gene-Disease" (records, 18,391,755), "Gene-Chemical" (records, 308,405), "Disease-Chemical" (records, 401,145), "Disease-Pathway" (records, 43,139), "Chemical-Pathway" (records, 196,073), "Chemical-Drug" (records, 1,702), "SNP-Gene" (records, 379), "ClinicalTrials-Drug" (records, 1,419), and "ClinicalTrials-Disease" (records, 1,210). Entities, including "Pathway," "Chemical," and "Disease," were collected from the Comparative Toxicogenomics Database (CTD) [14, 21], which is a public database to promote the understanding of the interaction of genes, chemical compounds, and disease networks in human health. Drugs were mapped from DrugBank [15, 22], which provides detailed drug action information. We linked a novel relationship for "Chemical-Drug" and "Gene-SNP" by curating the relationship of entities using Python ver. 2.6, and the remaining relations were collected from the CTD. Fig. 3 shows that semantic modeling of ethnicity-specific SNPs is dynamic and flexible. Hierarchy structure is where the parent can have one child, while in Directed Acyclic Graph (DAG) networks, like BioXM, the parent can have more than one child. For example, Gene A is associated with Chemical B or Pathway C. Also, Gene A is associated with Drug C, because Gene A is a curated interaction with Disease B, and Disease B is a curated association with Drug C.
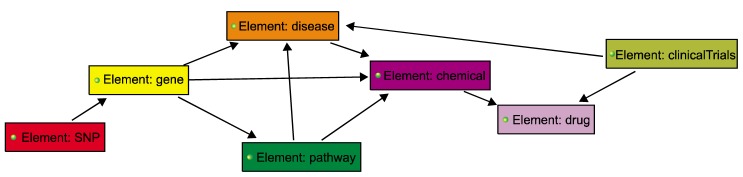
Scheme of the semantic model for ethnicity-specific single nucleotide polymorphisms (SNPs). The colored boxes represent entities, such as "SNP," "Gene," "Pathway," "Chemical," "Disease," "Drug," and "ClinicalTrials." The black lines indicate interactions between entity-entity, such as "Gene-SNP," "Disease-Pathway," and "Disease-Chemical-Drug."
Ethnicity-specific SNPs reveals association with 3 diseases and 1 drug
Diseases and drugs are very clinically important for understanding ethnic disparities. Many diseases and drugs have been reported to be involved in ethnic disparities, disease susceptibility, drug response, and disposition [23, 24, 25]. We curated "SNP-Gene-Disease-Chemical-Drug" interactions in the semantic networks for ethnicity-specific SNPs. Using these semantic "Gene-Disease" networks, we analyzed the functional implications of ethnic variants. There were 123 diseases associated with ethnicity-specific SNPs in common populations, 3 CEU-specific, and 46 YRI-specific, but JPT had no specified disparity between different ethnic populations (Supplementary Fig. 1A). Three diseases associated with CEU-specific SNPs were shown as phantom limb (MESH:D010591), trochlear nerve diseases (MESH: D020432), and vulvitis (MESH:D014847), while diseases associated with YRI-specific SNPs were observed, such as acquired immune deficiency syndrome (AIDS)-associated nephropathy (AIDSAN), hypertension, primary amyloidosis, and pelvic infection. AIDSAN (MESH:D016263) rates are higher in African-Americans than whites. Although the mortality and morbidity from AIDS infection are reduced, AIDSAN remains a major complication of AIDS infection (http://statgen.ncsu.edu/). Hypertension (MESH:C537095) is a disease threatening the public health in sub-Saharan Africa. In some areas, blacks exhibit higher rates of hypertension than whites. Increased salt intake and obesity are the leading causes of the prevalence of hypertension in Africa [26]. Pelvic infection (MESH:D034161) is a kind of inflammatory disease that blacks are more prone to take than other ethnic groups [27].
By applying the "SNP-Gene-Disease-Chemical-Drug" model, 2 and 14 drugs were revealed with CEU-specific and YRI-specific groups, but JPT-specific drugs had no results (Fig. 4, Supplementary Fig. 1B). One drug (methylphenidate, DB00422) was reported to have ethnic disparities in previously drug studies. The mean dose of methylphenidate is about 1.5 times higher in African-Americans than whites [28], and its use is steadily increasing in South Africa [29].

(A) Smart query: find drugs associated with ethnicity-specific single nucleotide polymorphisms (SNPs). (B) Visualizing the semantic network for ethnicity-specific SNP model. For example, drug (pink) DB00422 is influenced by chemical (purple) MESH:D008774, and MESH:D000082 is caused by diseases (orange), such as MESH:D015746, MESH:D000405, MESH:D000544, and disease MESH:D015746 is associated with genes (yellow), such as 91304, 713, and 114898, and Gene 114898 is located in SNPs (red) 5_159776853 and 5_159778786.
Ethnicity-specific associations with 5 pathways
Analysis using the semantic model for ethnicity-specific SNPs identified 5, 7, and 100 CEU-specific, JPT-specific, and YRI-specific biochemical pathways, respectively. In hemostasis (REACT:604), associated with cardiovascular diseases, plasminogen activator inhibitor-1 activity levels of Africans are lower compared to Caucasians. These negative effects can be seen already at a young age. If addressed in early life, it is possibly adjustable through behavior and optimal dietary changes [30]. Systemic lupus activity measure (SLAM; KEGG:05322) scores were higher in African-Americans (mean = 12.6) and Hispanics (11.0) than in Caucasians (8.5). It caused lack of health insurance, onset of abrupt disease, presence of anti-Ro (SSA) antibody, absence of HLA-DRB, high levels of helplessness, and abnormal illness behaviors. Caucasians lived under less crowded conditions, had less abnormal illness behaviors, and had more education. The results of the regression analyses were showed significant association between higher SLAM scores and higher helplessness, absence of HLA-DRB1*0301, and presence of HLA-DRB*0201 (p < 0.01) [31]. Prostate cancer (KEGG:05215) is a diagnosed male reproductive system cancer. Incidence of prostate cancer in African-American men is higher than in European men (1.6 times). Amundadottir et al. [32] identified that the chromosomal 8q24 region is most frequently gained in prostate cancers, and this gained region has been correlated with aggressive tumors [33]. Estimated population attributable risk is greater in Africans than in European populations. Hepatitis C virus (HCV; KEGG:05160) is a major cause of chronic liver disease in humans. Rates of HCV prevalence in sub-Saharan Africa are the highest in central Africa (3.0%) compared with the median (2.2%). Conjeevaram et al. [34] showed that African-Americans with chronic HCV have lower response to interferon-based antiviral therapy than Caucasian Americans [35]. Rheumatoid arthritis (RA; KEGG:05323) is an autoimmune disease and may affect many organs. The RA prevalence in urban South Africans is similar in Caucasians [36].
In the current study, the pathways shared between all populations were signal transduction (REACT:111102), olfactory transduction (KEGG:04740), and metabolic pathways (KEGG:01100). These pathways were common disease-pathway interactions in previous research. Although ethnicity-specific genes are identified in each population, it is generally observed that genes that are associated with a trait or disease can converge to the same pathway [37]. Those genes are also supposed to converge to common pathways shared between all populations. Therefore, a pathway-based approach allows us to systematically evaluate multiple polymorphic genes from different populations with respect to pathways as a biological unit [38]. Moreover, the pathway-based approach has more capability to detect rare genetic variants with a small effect that do not survive at the stringent significance level [39].
We identified ethnicity-specific SNPs from HapMap data and constructed a semantic network model for the HapMap SNP dataset. Functional studies were analyzed with genebased ethnicity-specific SNPs. Our semantic network model showed robust interactions between ethnic-specific SNPs and public data. However, this model is still in the early stage, and greater data connection and development of more flexible algorithms are required. We expect that our semantic network model is useful for ethnicity-specific SNPs, and our findings will provide prioritization of ethnicity-specific gene-based SNP candidates.
Acknowledgments
This work was supported by the IT R&D program of MKE/KEIT (KI0018-10039594, Development of Molecular Diagnostic System for Personalized Cancer Treatment).
References
Supplementary Material
Supplementary data including one figure can be found with this article online at http://www.genominfo.org/src/sm/gni-12-35-s001.pdf.
Supplementary Fig. 1
Venn diagrams of ethnic disparities for disease (A), drug (B), and pathway (C) between North Americans with European ancestry (CEU), Japanese from Tokyo (JPT), and Yorubans from Ibadan (YRI).