Introduction
Effective population size (Ne) is the theoretically useful population size of an ideal population, in which the influence of random genetic drift is identical to that of the actual population [1]. Therefore, the effective population size is a good representative of the genetic potential of the actual population; yet, it is easier to handle population genetic problems. There are several kinds of effective population size, depending on the focus of measurement [2, 3, 4, 5], and the most representative ones are the inbreeding effective population size, the variance effective population size, and the eigenvalue effective population size. The variance effective population is easy conceptually, and it can be estimated based on the gene (or allele) frequencies [6, 7] or heterozygote excess [8]. In addition, the estimation can be based on linkage disequilibrium (LD) [9], and advanced related methods based on LD have been applied to human genome data to infer the past population history of human populations [10, 11, 12].
Recently, new methods have been developed to estimate the current Ne and recent changes in Ne [13, 14]. In studies, the effective population size of the current generation was estimated based on deviations from Hardy-Weinberg equilibrium (HWE), and an effective population size of recent generations was estimated using the linkage equilibrium (LE) between variants in different chromosomes [13]. The past population changes can be inferred from the LD decay, depending on recombination rate [14]. Different from previous methods using regressive methods [10, 11, 12], the relationship between the effective population size of the previous generation and that of the current generation [14] was presented by improving a recurrence formula of previous studies [15, 16]. The applications of these studies to human genome data showed excellent agreement with the actual recent changes of various human populations [13, 14].
HapMap Phase III data were used for studies to infer the past population histories of various human populations. There were similar data for Korean populations (the Korean HapMap data) [17, 18]; however, for the continuity of the results, the data were not included for the analyses in previous studies [13, 14]. In 2007, right after the Korean HapMap data, the Korea Association Resource (KARE) was initiated to enable genomewide analyses for 8,842 individuals from the population-based cohorts [19]. The effort was successful in revealing new and population-specific genetic factors of various traits [19, 20, 21, 22]. The KARE data were also provided to many other researchers, which yielded many novel findings [23, 24, 25, 26, 27, 28, 29, 30]. In the current study, the current and recent effective population sizes of Koreans were estimated, and the past changes in effective population sizes were studied using the KARE data. Different from the HapMap data, the KARE data contain many more individuals with their age information. In addition to the analyses of the total population, region-specific and age-specific analyses were conducted in the current study.
Methods
Estimating Ne based on HWE deviations, LE deviations, and LD decay
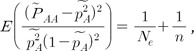
Based on the formula for testing HWE [31], estimating the effective population sizes of current populations utilizes the deviations of HWE, as shown in Eq. (1) from a previous study [13]. where n is the sample size, and the expectation indicates the mean value of HWE deviations.  AA is the observed genotype frequency of a variant, and
  AA is the observed allele frequency of a variant. The same as the HapMap data, the KARE data excluded variants that deviated from HWE for a significance level of 0.001. Therefore, similar to the previous study, the mean of the HWE deviations should be adjusted by dividing the mean by the correction term of 0.9873 [13].
 AA is the observed genotype frequency of a variant, and AA is the observed allele frequency of a variant. The same as the HapMap data, the KARE data excluded variants that deviated from HWE for a significance level of 0.001. Therefore, similar to the previous study, the mean of the HWE deviations should be adjusted by dividing the mean by the correction term of 0.9873 [13].
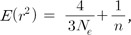
A variant in a chromosome is in LE with a variant in another chromosome; however, the random genetic drift induces deviation from LE. The deviations depend on the effective population size of recent generations, and the recent effective population size can be estimated using the deviations. Assuming a constant population size, the effective population size that reflects recent changes in population size (the recent Ne) can be estimated based on Eq. (2), which was derived in a previous study [13]. The estimate is different from the inbreeding Ne estimate using unlinked loci [9, 32]. where n indicates the sample size. As indicated previously [13], the correction due to sampling involves 1/2Ne, in addition to 1/n, because the haplotype frequencies were estimated using maximum likelihood estimation [9, 33, 34]. If the haplotypes are derived directly from the genotyping or sequencing, the correction term due to sampling should be 1/n.
The decay of LD between linked loci is different, depending on the recombination rate. Based on this information, the past population history can be inferred. The LD estimates at a certain recombination rate contain the influences of all Ne values from the current to a certain number of past generations [14]. Therefore, the previous study showed that the changes of Ne estimates, depending on recombination rate, just represent an overall picture of past population history by comparing the actual estimates to the estimates of various past population histories. Similar to the previous study, the effective population sizes were estimated using the linked variants, depending on the recombination rates, between the variants (Eqs. 1 and 3-5). Following the previous assumptions [13, 34], constant population sizes and LD at equilibrium were assumed.
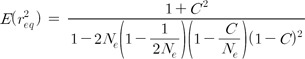
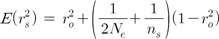
Eq. (3) presents the relationship between LD estimates at equilibrium (r2eq), Ne, and recombination rate (C). The LD estimates in Eq. (3) indicate the estimates of the original population, excluding the sampling bias. Sampling causes more complicated relationships in the LD estimates of the linked variants than the LD estimates of unlinked variants, due to the maximum likelihood estimation of haplotype frequencies [14]. Therefore, as shown in Eq. (4), the LD estimates of sampled populations (r2s) include the influence of the Ne of the original population instead of a simpler factor, 1/(2ns), in addition to the influence of sample size (ns) and the LD estimates of the original population (r2o).
To eliminate sampling bias, the Ne of the original population should be known. It is possible to combine and solve Eqs. (3) and (4) for a given ns and r2s. A better way is to use the Ne estimate of the current generation (Eq. 1) in the recurrent formula in a previous study [14]. By doing so, Eq. (5) was derived.
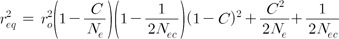
In Eq. (5), Ne indicates the effective population size at equilibrium for recombination rate (C); Nec indicates the effective population size of the current generation from Eq. (1); r2o indicates the LD estimates of the original population; and r2eq indicates the LD estimates at equilibrium from the generation when the LD estimates reached equilibrium to the previous generation right before the current generation -i.e., the parent generation. Therefore, to estimate Ne at equilibrium for a certain recombination rate, Nec should be estimated first. The estimated Nec is incorporated into Eq. (4) to derive r2o. In Eq. (5), substituting r2eq with the expression in Eq. (3) provides a cubic equation of Ne in which Ne can be solvable. The Ne estimates could be examined, depending on various recombination rates, to infer past population histories in which the impact of current Ne was excluded.
Data
The KARE data were generated and kindly provided through a grant program by the Korea Centers for Disease Control and Prevention. The data consisted of a total of 8,842 individuals: 4,637 from Ansan (an urban area) and 4,205 from Anseong (a rural area) in Gyeonggi province. There were 32 groups depending on ages from 39 to 70, and the numbers of individuals in each of the 32 groups were: 21, 421, 469, 489, 485, 473, 426, 400, 368, 291, 325, 268, 215, 207, 241, 242, 259, 197, 225, 238, 231, 255, 239, 230, 232, 254, 270, 210, 254, 200, 194, and 13, respectively. Because there were small numbers of individuals for the ages of 39 and 70, they were combined with the age groups of 40 and 69, respectively. Therefore, the total number of age groups was 30. It is neither necessary nor efficient to use all single-nucleotide polymorphisms (SNPs), because estimating Ne does not require many variants. Only 10,000 SNPs or 1,000 pairs of SNPs were enough to estimate the correct Ne in the simulations of previous studies [13, 14]. In the simulation studies, the variances were least biased for the most frequent variants. Therefore, the same as in previous studies [13, 14], SNPs with minor allele frequencies higher than 0.4 and without missing genotypes were used for the analyses. The estimates of LD were the r2 estimates-i.e., the squared correlation coefficient between two variants.
Results
The current effective population size was 100,778 using the total population. The estimate was much larger than the estimates using the HapMap data. The largest Ne in the populations of the HapMap data was 10,437 using CEUp (the parents of Utah, USA residents with ancestry from northern and western Europe). The estimate of the Korean population was approximately 10 times larger than the largest estimates using the HapMap data. From the definition, the effective population size is influenced by many factors, such as mating structure, migration, and admixture [1]. No big difference is expected in the mating structure between KARE and HapMap. Because Korean populations were relatively rarely admixed, the inflation of Ne due to admixture could be excluded. The effects of migration on Ne estimates were studied previously [35, 36]. The Ne, based on LD, which is more robust than the joint estimation of Ne and migration rate, could be overestimated to be close to the global (metapopulation) Ne when the migration rate is high [35].
After the Korean War, the Republic of Korea (South Korea) experienced severe urbanization and extreme population concentration in a metropolitan area [37]. The percentage of the population in an urban area was more than 70% of the total population in the late 1980s [37]. A high population density due to migration introduces good opportunities to meet a diverse partner within the population, which increases Ne. The population density of the Republic of Korea is among the highest among nations, ranking 20th among a total of 265 countries or areas (https://data.un.org/Data.aspx?d=PopDiv&f=variableID%3A14). Due to the Korean War and urbanization, the Gyeonggi province, located in the middle of the Korean peninsula, has experienced severe migration. Because the capital, Seoul, is located in the middle of Gyeonggi province, the region has also experienced a severe concentration of the population. These factors might explain the large effective population size.
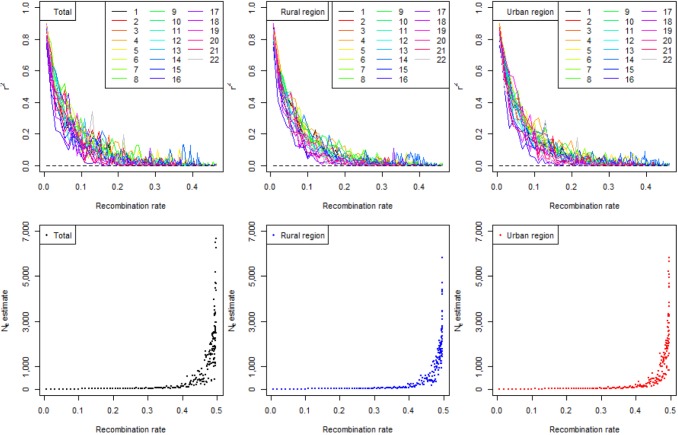
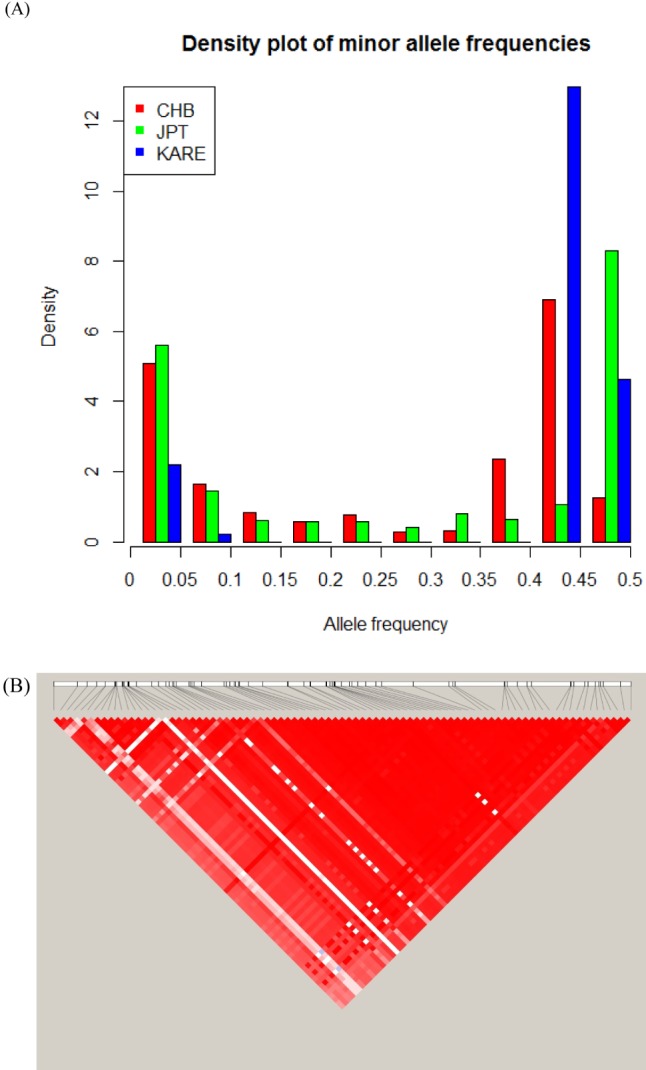
Fig. 1 shows the LD status of the total population, the population of the urban area, and the population of the rural area, depending on recombination rates. In the previous study, the r2 decay plots of chromosome 14, depending on recombination rates, were prominently higher than the plots of other chromosomes [14]; however, in the current study, none of the Korean populations showed increases in the r2 estimates of chromosome 14 (Fig. 1 and Supplementary Fig. 1 for the age groups). However, when the region from 65,700 kb to 6,800 kb, which is responsible for the increases in the r2 estimates in the previous study, was examined, similar allele frequency spectra were seen (Fig. 2A). The frequency spectra show significant concentrations of specific minor allele frequencies (higher than 0.4), indicating selection pressures in the region. Other populations in the HapMap data showed similar trends of selection pressures, but the concentrated frequencies usually were less than 0.4 [14].
The most similar spectra among the HapMap data were JPT (Japanese in Tokyo, Japan) and CHB (Han Chinese in Beijing, China), and the frequency spectrum of KARE looked like a mixture of the spectra of JPT and CHB. In a previous study [14], CHD (Chinese in metropolitan Denver, CO, USA) was almost the same as CHB. Although the distributions were more dispersed, ASW (African ancestry in southwest USA) and MEX (Mexican ancestry in Los Angeles, CA, USA) were similar to CHB. The genotype data were generated using Affymetrix Genome-Wide Human SNP array 5.0 [19]; however, the genotype data of the HapMap project were generated using two platforms of the Illumina Human 1M and the Affymetrix SNP 6.0 [38]. Because of the difference in the platforms used, the current study showed a smaller number of SNPs in the region (Fig. 2A). If the same platforms were used for genotyping, similar increases in the r2 estimates of chromosome 14 to JPT and CHB might be observed in Fig. 1 [14]. The region contains the complete gephyrin gene (GPHN). In Fig. 2B, a huge LD block of the region was observed using Haploview [39], similar to a previous study [14].
The past population history of the total population is shown in Fig. 1. Excluding the influence of current effective population size, the past population history of Koreans was similar to the CHB of the HapMap data. The results looked reasonable, considering the similarity of the modern histories between Korea and China, which include the resistance to Western civilizations and the short period of colonization. However, there is a huge difference between the current Ne of Korean populations and the current Ne of CHB. The current Ne of CHB was 2,926 [14]. The Chinese government has enforced a one-child policy since 1978; however, the Korean government encouraged a two-child policy without any forcible action [40]. These differences in policy might have resulted in significant differences in the current Ne sizes of the Korean and Chinese populations. The populations of both the urban and rural areas showed similar past population histories as that of the total population (Fig. 1).
Fig. 3 shows the estimates of the current and recent effective population sizes of various age groups. Because the initial sample collection was conducted from 2001 to 2003, the year of birth for individuals aged 69 to 40 would be 1933 to 1962, respectively, if the baseline year of collection were assumed to be 2002. Therefore, there could be inaccuracies of 1 or 2 years in assigning the year of birth. The recent Ne involves recent changes in the effective population sizes, usually within a few generations. Therefore, the recent effective population sizes were larger than the current effective population sizes in Fig. 3, because the current Ne of individuals born in a certain year merely represents the effective population size of the population born in a certain year. However, the recent Ne represents the effective population sizes of several previous generations. The current effective population sizes were mostly between 5,000 and 30,000, and the recent effective population sizes were usually higher than the current Ne and increased as the year of birth increased.
The current and recent Ne of samples with age 69 or older (born in 1933) was 9,457 and 20,165, respectively. For comparison, the maximum estimate of the current Ne of the HapMap data was 10,437. The current Ne of Koreans born in 1933 was already large, probably because of the high population density in Korea. The recent Ne, which is double the current Ne, indicates that the population growth of Korea lasted long before the colonial domination by Japan in 1910. There were two age groups of 58 and 63, for which the current Ne estimates were less than 5,000. The corresponding years are 1944 and 1939, respectively. World War II began in 1939 and ended in 1945, and comparatively fewer births would be expected during the period. However, there was a large increase of the current Ne in 1943, presenting a nettlesome question. There were several large increases of the current Ne in 1943, 1947, 1952, and 1958. The increases in 1947 and 1958 could be explained by the baby boom right after the wars; however, 1943 and 1952 were the 2 years and 1 year, respectively, before the end of the wars, which lasted for 6 and 3 years, respectively. The current and recent Ne estimates were compared to the number of the total population and to the rates of population growth recorded in the Korean Statistical Almanac of the Korean Statistical Information Service (http://kosis.kr). The rates of population growth fit with the increased current Ne in 1943 if the 1-year inaccuracies in assigning the year of birth are considered. The increments of the current Ne in 1943 and 1952 could be due to the decreased crude death rate and increased migration rates [37].
Discussion
Using the KARE data, the current and recent effective population sizes of Korea were estimated, based on HWE and LE deviations, and the past changes in population sizes were derived, based on the pattern of LD decay. The results showed clear exponential growth of the Korean population, similar to CHB of the HapMap data. The population growth of China has been positive continuously since 1400, except for the period from 1683 to 1700 [41]. The censuses in the Joseon Dynasty period of Korea showed low rates of population growth in the 1800s [37]. The large recent Ne of the 69-year-old age group (born in 1933) indicates that Korea might have experienced continuous population growth at least in 1873, assuming a generation time of 20 years for the 3 most recent generations. A simulation result of rapid growth (Ne changes: 1000, 2000, 4000, 10,000) showed half (5,212) the current Ne [13]; however, the recent Ne of the 69-year-old age group was double the current Ne. Therefore, it is likely that the population growth started much earlier than 1873 [13, 14]. In the metropolitan area, people from all over the country might have increased the Ne. The migration effects and the discrepancy between the census and the results need more explanations.
The age-dependent Ne estimates showed good concordance with the actual modern history of Korea, although several of them require more explanation. Because of the inaccuracies in assigning the year of birth, a sample of the 58-year-old age group might be mixed with a sample of the age groups of 57 and 59. Although it is a rare occasion, individuals having genomic potential to increase current Ne in the 57 and 59 age groups might have been assigned to the 58-year-old age group accidently during the sample collection. In any case, the population growth in war time needs more explanation. In Fig. 3, the trend of recent Ne followed the trend of current Ne in many cases. Especially, the increased current Ne in 1943 contributed to the rapid increase in the recent Ne in the late 1950s as the individuals born in 1943 could contribute to reproduction. The recent Ne decreased rapidly in the 42-year-old age group (born in 1960), which needs explanation. The baby-boom individuals born in 1958 were 2 years old and could not contribute to giving birth. The recent Ne increased again in 1961 and 1962, possibly due to the contributions of individuals who were born in the previous baby-boom period and reached reproductive age.
In the previous studies, it was not necessary to analyze a large number of variants. However, the current study showed that the number of genotypes, as well as the number of individuals, might be important for the quality of the results to infer the past population history. In Supplementary Fig. 2, the estimates of many age groups were less consistent, even with larger numbers of samples than the sample sizes of the HapMap data. The smallest sample size for the former was 197, and the largest sample size for the latter was 143. However, the number of genotypes would not have had much influence much on the estimations of the current and recent Ne, as indicated in previous simulation studies [13]. Therefore, the possibility of lower genotype quality could not be excluded, either. It is also possible that inconsistent estimates were seen more in the CHB than in other populations, which showed the most rapid population growth. Because Korean populations showed more rapid population growth than CHB, the rapid growth might be the reason for the inconsistent estimates. With more genotypes, the increases in r2 estimates in chromosome 14 could also be seen clearly in Fig. 1, similar to CHB and JPT of the HapMap project.
The recent Ne of the total population was 2,518,501, which was incredibly large. Considering that the current Ne of the total population was 100,778, the KARE data showed that the population is under serious deduction of effective population size. The ratio of the current to recent Ne was 0.04. This small ratio might be due to migration and extreme population concentration to a metropolitan area. Migration might have had more influence on the recent Ne rather than the current Ne, because the recent Ne reflects the population that moved from all over the country. In addition, the division of the Korean peninsula after the Korean War might have resulted in the extreme ratio. The population moved to the metropolitan area from all over the country, but they could not move back to the northern part of the Korean peninsula. The ratio was not comparable to any of the HapMap data, in which 0.64 of JPT was the lowest, and all populations were concordant with their recent population changes. In Fig. 3, the tendency started in 1933 for the eldest ones in the data, and it became more severe as the age of the sampled individuals decreased. The total sample contains more relatively young individuals than elders; however, the ratio of 0.04 was too small. If the ratios were correct, as shown in the HapMap data, Fig. 3 shows that the significant reduction in effective population size began in 1953, right after the Korean War, probably due to migration and the division of the Korean peninsula. As indicated previously [13], the Ne estimates do not represent the actual population size exactly. Further studies for the effects of migrations and confinements with refined samples and data could be helpful.
The estimates of the current effective population size were 91,433 in the rural area and 76,097 in the urban area. The result was surprising, because the urban area is more populated than the rural area. The age distributions of each region differed significantly (Supplementary Fig. 3A). The sample of the urban area contains a smaller number of elders and a larger number of relatively young individuals; however, the sample of the rural area shows relatively even distribution, with a slightly larger number of elders (Supplementary Fig. 3A). If the current effective population sizes, depending on age, were examined (Supplementary Fig. 3B), the current effective population sizes of the rural area were relatively even compared to the current effective population sizes of the urban area. Some of the estimates were negative, which generally indicate large Ne values and sampling failures, considering the results of previous studies [13]. For the current Ne estimates of the urban area, the estimates were usually small, except for several estimates of relatively younger ages. The overall small uneven estimates and the uneven age distribution of the urban area might have resulted in the smaller current Ne estimate than the estimate of the rural area. The recent Ne of the rural area was 495,871, but the estimate of the recent Ne of the urban area was a negative value. As mentioned previously, the negative value might have come from a large Ne and sampling failure. Therefore, the negative recent Ne estimate of the urban area probably indicates an extremely large recent Ne. More studies are necessary to determine the effects of uneven age distributions, rapid population fluctuations, migrations, and population confinements on the Ne estimates.