Genome-Wide Association Study of Metabolic Syndrome in Koreans
Article information
Abstract
Metabolic syndrome (METS) is a disorder of energy utilization and storage and increases the risk of developing cardiovascular disease and diabetes. To identify the genetic risk factors of METS, we carried out a genome-wide association study (GWAS) for 2,657 cases and 5,917 controls in Korean populations. As a result, we could identify 2 single nucleotide polymorphisms (SNPs) with genome-wide significance level p-values (<5 × 10⁻⁸), 8 SNPs with genome-wide suggestive p-values (5 × 10⁻⁸ ≤ p < 1 × 10⁻⁵), and 2 SNPs of more functional variants with borderline p-values (5 × 10⁻⁵ ≤ p < 1 × 10⁻⁴). On the other hand, the multiple correction criteria of conventional GWASs exclude false-positive loci, but simultaneously, they discard many true-positive loci. To reconsider the discarded true-positive loci, we attempted to include the functional variants (nonsynonymous SNPs [nsSNPs] and expression quantitative trait loci [eQTL]) among the top 5,000 SNPs based on the proportion of phenotypic variance explained by genotypic variance. In total, 159 eQTLs and 18 nsSNPs were presented in the top 5,000 SNPs. Although they should be replicated in other independent populations, 6 eQTLs and 2 nsSNP loci were located in the molecular pathways of LPL, APOA5, and CHRM2, which were the significant or suggestive loci in the METS GWAS. Conclusively, our approach using the conventional GWAS, reconsidering functional variants and pathway-based interpretation, suggests a useful method to understand the GWAS results of complex traits and can be expanded in other genomewide association studies.
Introduction
Metabolic syndrome (METS) is a disorder of energy utilization and storage and increases the risk of developing cardiovascular disease and diabetes. METS includes multiple clinical traits, as follows: increased plasma glucose, abdominal obesity, dyslipidemia, and high blood pressure [1]. METS is a great concern in developing countries, because the prevalence of METS is gradually increasing, especially in countries where it follows obesity trends, sedentary lifestyle, and high consumption of calories [2, 3, 4]. A Korean twin study showed that the METS has 51%-60% heritability, indicating a significant role of genetic factors in the development of METS [5]. Therefore, understanding the genetic factors underlying the syndrome and their correlation is clinically important.
Recent advances in high-throughput genomics technologies have allowed massive testing of genetic variants in minimal time [6, 7]. The reductions in cost and time have made it feasible to conduct large-scale genome-wide association studies (GWASs) that genotype many thousands of single nucleotide polymorphisms (SNPs) in thousands of individuals. So far, approximately 1,900 reports with 13,000 SNPs (GWAS catalog; Apr 14, 2014) have been published to identify the gene-disease or -non-disease trait associations. The quantitative traits related to METS have already been studied by the conventional GWAS in the Korean population [8], but there is no Korean GWAS report about METS cases and controls.
On the other hand, relatively little trait heritability can be explained by the conventional GWAS [9]. These phenomena, called missing heritability problems, are hard to solve by conventional GWAS, in part because of the extensive multiple testing correction in GWAS analysis, low effect size of common variants, and the difficulty of detecting low-frequency or rare variants in conventional GWAS. Multiple testing correction is necessary to exclude false-positive loci, but simultaneously, it discards many true-positive loci [10]. Also, most SNPs in these GWASs lie in intergenic and intron regions and do not appear to affect protein sequence. Thus, these SNPs are likely functionally neutral or just proxies of causal variants located in the same linkage disequilibrium (LD). To understand the amount of true-positive signals in the discarded association results, we computed the proportion [V(G)/V(P)] of the phenotypic variance [V(P)] that is explained by the genotype variance [V(G)] using the significant and discarded SNP results [11].
Recently, Fransen et al. [10] reported a GWAS using expression quantitative trait loci (eQTL) information. They selected eQTL among the GWAS results for Crohn's disease and conducted follow-up replication studies [10]. They showed that eQTL-based pre-selection for follow-up is a useful approach for identifying risk loci from a moderately sized GWAS.
Based on previous knowledge, we applied an alternative analysis strategy to understand the genetic components of METS. First of all, we conducted a conventional GWAS for METS cases and healthy controls to discover the top significant signals. Thereafter, we tried to uncover the functional variants, such as nonsynonymous SNPs (nsSNPs) and eQTLs, among the SNPs to be discarded using the stringent criteria of the conventional GWAS. Finally, we drew a pathway of the significantly associated GWAS SNPs and the remaining less significantly associated functional SNPs. The overall study design is schematically described in Supplementary Fig. 1.
Methods
Study subjects
The study subjects were originally derived from a part of the Korean Genome and Epidemiology Study (KoGES) project, which was the national project to establish genome epidemiology cohorts of Korean dwellers or immigrants/emigrants [12]. Among the KoGES cohorts, the Korean Association Resource Consortium (KARE) has established a public GWAS dataset by using the Ansan-Anseong cohort, which is an ongoing biennially followed-up cohort in the KoGES [13]. The KARE dataset consists of the individual SNP chip genotypes and the epidemiological/clinical phenotypes for studying the genetic components of Korean public health. Written informed consent was obtained from all participants at the KoGES, and this research project was approved by the Institutional Review Board of Korea National Institute of Health (KNIH). The obtained KARE dataset passed the quality control criteria and was reported in previous GWAS reports [8, 13]. Briefly, the subjects with genotype accuracies below 98% and high missing genotype call rates (≥5%), high heterozygosity (>30%), or inconsistency in sex were excluded from subsequent analysis. Individuals who had a tumor were excluded, as were related individuals whose estimated identity-by-state values were high (>0.80). Based on these criteria, 8,842 samples were selected; these quality control steps have been described in a previous GWAS [13].
Study phenotypes and covariates
We used the general information on resident areas (Anseong or Ansan), sex, and age as the covariates and past disease history of diabetes, hypertension, and lipidemia as exclusion criteria for non-METS healthy controls. The height and body weight were used to calculate the body mass index (BMI) as another covariate, and waist circumference (WC), systolic and diastolic blood pressures (SBP and DBP), fasting plasma glucose levels (GLU0), high-density lipoprotein (HDL) cholesterol, and triglyceride (TG) were used to diagnose METS. METS was defined by the presence of three or more of the following five components according to the NCEP-ATPIII criteria using WC for Asians [14, 15]: WC (≥90 cm for men and ≥80 cm for women), HDL (<40 mg/dL for men, <50 mg/dL for women), TG (≥150 mg/dL), SBP (≥130 mm Hg) and/or DBP (≥85 mm Hg), and GLU0 (≥100 mg/dL).
Study genotypes
The genotyping of the cohort population was previously described for the KARE study [16]. Most DNA samples were isolated from the peripheral blood of participants and genotyped using Affymetrix Genomewide Human SNP array 5.0 (Affymetrix, Inc., Santa Clara, CA, USA). The quality control steps of the genotypes have been described elsewhere [13]. Briefly, the calling of the genotyping was determined by Bayesian Robust Linear Modeling using the Mahalanobis Distance genotyping algorithm [17]. Consequently, 352,227 SNPs had a missing genotype call rate below 0.1, a minor allele frequency greater than 0.01, and no deviation from Hardy-Weinberg equilibrium (p > 1 × 10⁻⁶). Additionally, the previous GWAS reported no population stratification between the Anseong and Ansan cohorts [13].
Statistical analysis
The GWAS for METS cases and controls was conducted by logistic regression analysis, adjusting for residential area, sex, age, and BMI as covariates, implemented in PLINK version 1.07 [18]. The significant associations were defined by genomewide significance level p-values (<5 × 10⁻⁸) and genome-wide suggestive p-values (5 × 10⁻⁸ ≤ p < 1 × 10⁻⁵).
The LD between the previously reported GWAS SNPs and the SNPs of the current GWAS was investigated with SNAP web-based software (http://www.broadinstitute.org/mpg/snap) and GWAS catalog (http://www.genome.gov/gwastudies/). For example, we entered our top significant SNPs in the SNAP input panel and found high LD SNPs with r2 > 0.9 and D' = 1 around 1 Mbp. The high-LD SNPs were investigated in the GWAS catalog (http://www.genome.gov/gwasstudies) as to whether they were previously reported or not.
To maximize the candidate risk factors of METS, we selected additional functional SNPs in the eQTLs or nsSNP loci (5 × 10⁻⁵ ≤ p < 1 × 10⁻⁴). Among the Affymetrix 5.0 SNPs, we investigated the eQTL SNPs from regulomeDB (http://regulomedb.org) and the nsSNPs from BioMart (http://www.biomart.org).
The genetic variances of the top association SNPs were estimated by GCTA v1.24 [16], which is a tool for estimating the proportion [V(G)/V(P)] of phenotypic variance [V(P)] explained by SNPs [V(G)] for complex traits. We selected the SNP sets based on the GWAS p-values from 100 to 1,000 SNPs with 10-SNP intervals and from 1,000 to 5,000 SNPs with 1,000-SNP intervals. We decided the number of SNPs in the maximum set based on the genetic variance approximated the METS heritability reported from the Korean twin study [5]. The pair-wise genetic relationships were estimated using the make-grm option, and the proportion of the phenotypic variance explained by the associated SNPs was estimated by the grm-test option with the restricted maximum likelihood [11].
In silico analysis
The functional relevance of the associated SNP sites was analyzed by overlapping the gene-coding sequence or the Encyclopedia of DNA Element (ENCODE) regulatory element positions in the University of California Santa Cruz (UCSC) genome browser (http://genome.ucsc.edu). Thereafter, regulomeDB (http://regulome.stanford.edu/) was utilized to extract eQTL information. In addition, Pathway Studio version 9.0 software (Ariadne Genomics, Rockville, MD, USA) was utilized to analyze the functional interactions and possible pathways among genes/proteins in our data. It provides an interpretation of the biological implications from gene/protein expression data, the establishment of molecular pathways, and an identification of protein interaction maps and their association to cellular process [19].
Results and Discussion
Genome-wide association study
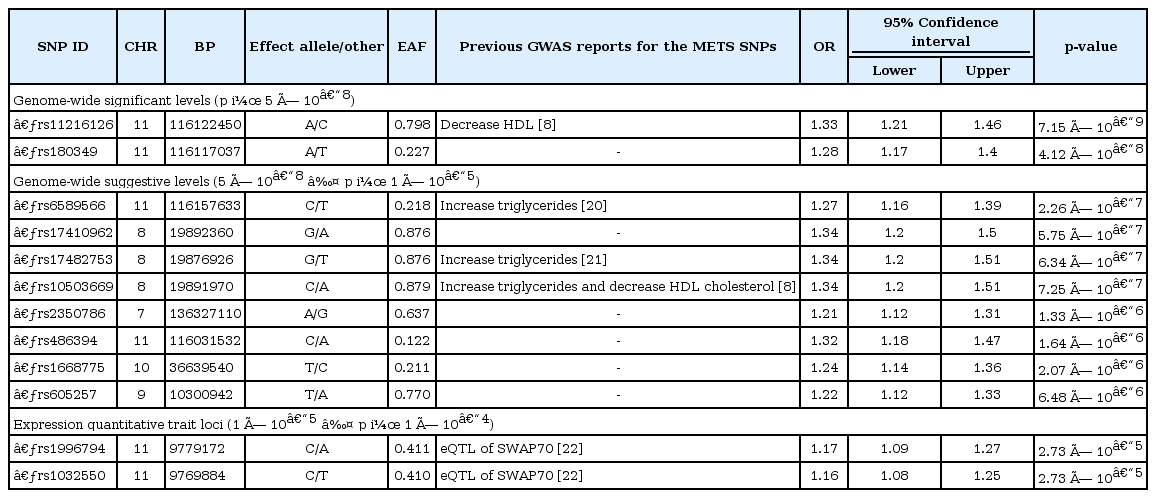
Table 1 describes the clinical characteristics of Ansung and Ansan regarding the METS criteria: BMI, WC, SBP, DBP, GLU0, HDL, and TG. Based on the NCEP-ATPIII METS criteria for Asians [14], 2,657 KARE subjects were included in the METS cases. The SNPs showing strong and moderate evidence of association (p < 1 × 10⁻⁵) are indicated in the Manhattan plot of the GWAS (Fig. 1). In addition to these SNPs, we identified several functional SNPs with suggestive evidence of association (5 × 10⁻⁸ ≤ p). In this study, we selected 12 SNPs, of which 2 had genome-wide significant associations (p < 5 × 10⁻⁸), 8 had suggestive associations (5 × 10⁻⁸ ≤ p < 1 × 10⁻⁵), and 2 had functional variants (1 × 10⁻⁵ ≤ p < 1 × 10⁻⁴) (Table 2) [8, 20, 21, 22]. The top SNP (rs11216126) and 3 suggestive SNPs (rs6589566, rs174 82753, and rs10503669) were previously reported as being associated with METS-related traits, such as serum cholesterol levels or TG levels [8, 20, 21].

Manhattan plot of metabolic syndrome genome-wide association study -log10(p-values). All black and grey circles indicate the individual single nucleotide polymorphisms (SNPs). The red horizontal line is the genome-wide significance level (p = 5 × 10⁻⁸), and the blue horizontal line is the genome-wide suggestive level (5 × 10⁻⁸ ≤ p < 1 × 10⁻⁵). The top significant SNPs are depicted on the right site of the SNP.
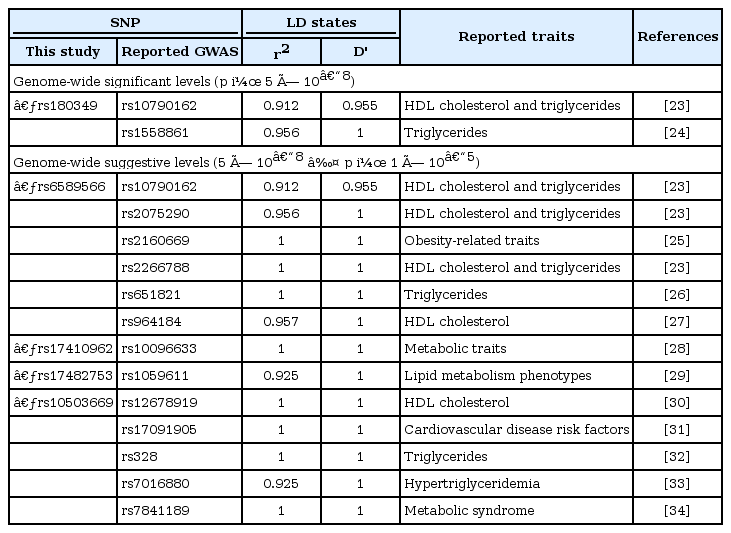
LD analysis using 10 SNPs was conducted with the previously reported GWAS SNPs. As a result, 5 SNPs had strong LD with the 15 highly linked GWAS SNPs (Table 3) [23, 24, 25, 26, 27, 28, 29, 30, 31, 32, 33, 34]. Among the 6 remaining SNPs associated with METS in our GWAS results, 2 SNPs (rs180349 and rs17410962) showed high LD with the previously reported SNPs (r2 > 0.9 and D' = 1) even though the 2 SNPs have not been reported regarding metabolic traits.
Therefore, we discovered 10 significant or suggestive associated SNPs in the METS GWAS, but 6 of them were already reported or linked to the reported SNPs. The remaining 4 suggestive signals and 2 functional variants have been first reported in the current study, and a replication study should be performed in other independent populations.
In silico annotation of the linked genes and functional relevance
The 10 associated SNPs and the LD SNPs were located in six functional gene regions, and one SNP was located in the intergenic region. The top signals were located downstream of a functional spliceosome-associated protein, named BUD13, a homolog of yeast (BUD13) gene chromosome 11 and near the BUD13 gene. BUD13 has been reported to be associated with lipid, metabolic syndrome X [23], TG [32], and metabolic traits in East Asians [8], demonstrating that it is putatively functionally associated with METS in the Korean population (Supplementary Table 1).
The second significant SNP was rs6589566, which has 6 high-LD SNPs. Notably, in silico annotation of the SNP's function showed that rs651821 was located in the 5' untranslated region (UTR) of the APOA5 gene, and also, the SNP was reported as an eQTL of the transgelin (TAGLN) gene (Table 4). The results indicate that the remaining SNPs are surrogate markers of rs6589566. Among them, rs651821 and rs964184 are associated with TG level, as one component of METS evaluation, in Chinese populations [26] and in Mexicans [35]. Both SNPs exhibit eQTL of the TAGLN gene. TAGLN has been documented as a repressive regulator of matrix metalloproteinase 9 (MMP9) gene expression [36] and is considered a putative tumor suppressor due to suppression of MMP-9, which harbors tumor metastatic properties [37]. However, MMP-9 is also involved in the progression of METS via chymase activity [38] and has been suggested to be used a diagnostic marker of METS [39]. Thus, it can be explained that the functional eQTL TAGLN of rs651821 and rs964184 could be a novel marker for the evaluation of METS in terms of strong regulation of MMP-9.
The third most significant signals were located in the lipoprotein lipase (LPL) gene region. Three SNPs (rs10503669, rs17482753, and rs17410962) located in chr 8 were eQTL that contributed to LPL expression in monocytes. LPL is a critical protein of lipid metabolism and is significantly associated with METS in Asian Indians [40], indicating that the functional eQTL-SNP of LPL expression could be a marker for the evaluation of METS in Korean populations. Those three SNPs were in strong LD with rs328, which is a stop-gain mutation of the LPL coding sequence [41] (Supplementary Table 1). Although the remaining 14 SNPs were non-eQTL-SNPs, those SNPs have been reported as being in association with HDL cholesterol, low-density lipoprotein cholesterol, TG, and obesity, indicating that they are putative candidate markers for the evaluation of METS.
Although the remaining 6 SNPs and their nearest genes have not been functionally studied regarding METS-associated traits, further studies are required to elucidate for their role in METS.
Pathway network analysis
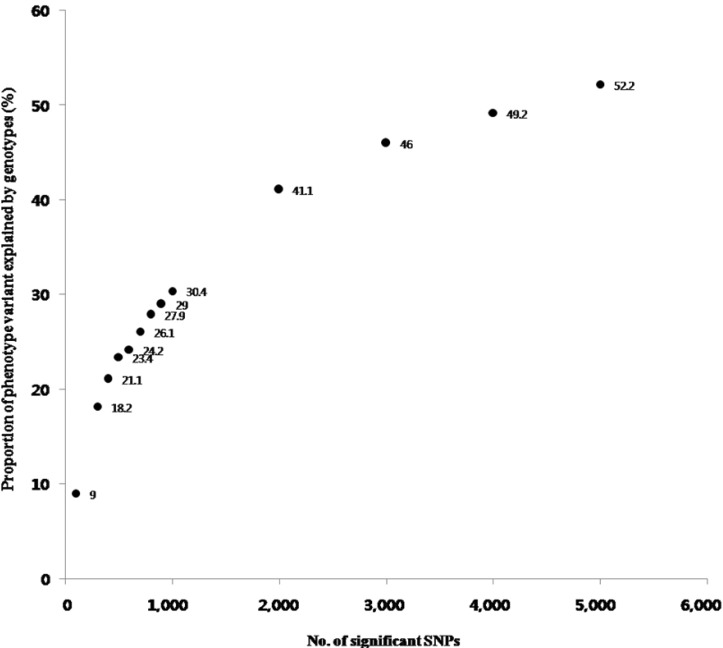
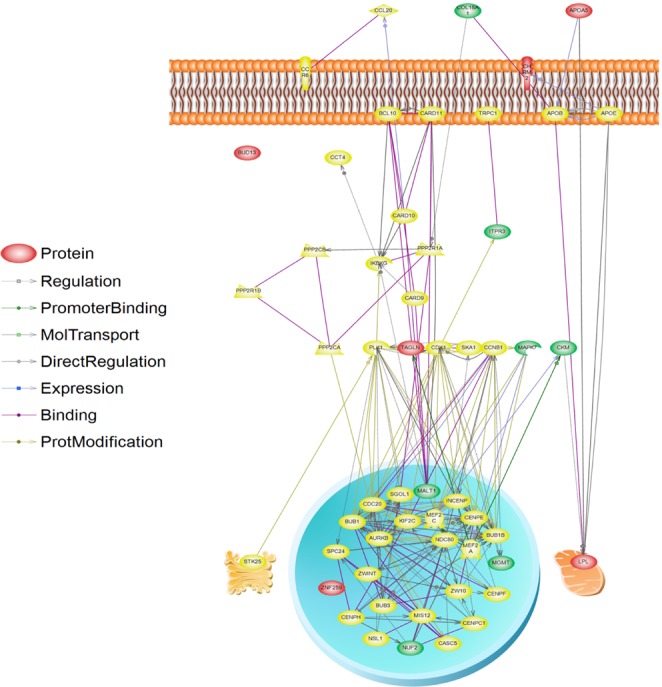
The results of the V(G)/V(P) for 100 to 5,000 SNPs were plotted in Fig. 2. When we used 5,000 SNPs, V(G)/V(P) approximated 50%, and we extracted functional SNPs, such as eQTLs and nsSNPs, from the 5,000 SNPs. We could extract 159 eQTLs and 18 nsSNPs among the 5,000 SNPs (Supplementary Table 2). Notably, 6 eQTL genes and 2 nsSNP genes consisted of LPL and the apolipoprotein A-V (APOA5) pathway through the interaction of a number of mediated genes (Table 4). Among them, muscle creatinine kinase (CKM) has been documented to regulate LPL activity [42], demonstrating that it is putatively associated with METS. Those additionally identified genes might be candidate targets of METS for further study (Fig. 3).

The proportion of phenotypic variance [V(P)] explained by the genotypic variance [V(G)]. The horizontal axis denotes the number of single nucleotide polymorphisms (SNPs). Approximately 50% of phenotypic variance could be explained by the top 5,000 SNPs.

Illustration of molecular pathway for significantly associated single nucleotide polymorphism (SNP) loci in the metabolic syndrome genome-wide association study (GWAS). The molecules depicted by the significant GWAS loci (reds), functional SNPs (expression quantitative trait loci or nonsynonymous SNPs) loci (green), and the other intermediate molecules (yellow) are illustrated on the cell organelles.
eQTLs and nsSNPs provide insights into the regulation of transcription and aid in the interpretation of GWASs [22]. Most of the eQTL resources are available in online databases, such as RegulomeDB (http://regulome.stanford.edu/), including several published resources in various cell types, such as monocytes [43], human brain [44], lymphoblastoid cell lines [45, 46], and human liver [47]. Probably, RegulomeDB is one of the most useful eQTL databases, because it contains rich information about the products of the ENCODE project, such as transcription factor binding sites, chromatin structure, histone modification, and eQTLs. Our pathway results suggest an internal mechanism of LPL, APOA5, and muscarinic acetylcholine receptor M2 (CHRM2) functions in METS. Therefore, we suggest that 6 eQTLs and 2 nsSNP loci might be additional targets for further association studies and functional analysis.
Conclusively, our approach using the conventional GWAS, reconsidering functional variants and the pathway-based interpretation, suggests a useful method to understand the GWAS results of complex traits and can be expanded in other GWASs.
Acknowledgments
This work was supported by grants from the Korea Centers for Disease Control and Prevention (KCDC), Republic of Korea (4845-301, 4851-302, 4851-307). This study was also supported by an internal project, "Construction of databases and an analysis system for Korean reference genomes for disease researches" (2013-NG72001-00), of the Korea National Institute of Health, KCDC.
Notes
This is 2014 KNIH KARE best paper awarded.
References
Supplementary materials
Supplementary data including two tables and one figure can be found with this article online at http://www.genominfo.org/src/sm/gni-12-187-s001.pdf.
Supplementary Table 1
In silico annotation of the associated SNPs with METS
Supplementary Table 2
The list of functional SNPs among the top 5,000 SNPs associated with METS
Supplementary Fig. 1
Overall study design to understand the metabolic syndrome (METS) risk genetic factors in Korean. SNP, single nucleotide polymorphism.


