Genomics Inform Search

CLOSE


Genomics Inform > Volume 12(4); 2014 > Article
Hong, Chung, and Cho: Replication of Interactions between Genome-Wide Genetic Variants and Body Mass Index in Fasting Glucose and Insulin Levels

Abstract

The genetic regulation of glucose and insulin levels might be modified by adiposity. With regard to the genetic factors that are altered by adiposity, a large meta-analysis on the interactions between genetic variants and body mass index with regard to fasting glucose and insulin levels was reported by the Meta-Analyses of Glucose- and Insulin-related trait Consortium (MAGIC), based on European ancestry. Because no replication study has been performed in other ethnic groups, we first examined the link between reported single-nucleotide polymorphisms (SNPs) and fasting glucose and insulin levels in a large Korean cohort (Korean Genome and Epidemiology Study cohort [KoGES], n = 5,814). The MAGIC study reported 7 novel SNPs for fasting glucose levels and 6 novel SNPs for fasting insulin levels. In this study, we attempted to replicate the association of 5 SNPs with fasting glucose levels and 5 SNPs with fasting insulin levels. One SNP (rs2293941) in PDX1 was identified as a significant obesity-modifiable factor in Koreans. Our results indicate that the novel loci that were identified by MAGIC are poorly replicated in other ethnic groups, although we do not know why.

Introduction

The rapid socioeconomic developments in developing countries have led to a shift in infrastructure, technology, and food supply, promoting overnutrition and sedentary lifestyles [1]. Consequently, the prevalence of metabolic diseases, such as obesity and type 2 diabetes, has risen dramatically [2, 3]. In particular, Asian countries have experienced a notable increase in metabolic disease; thus, prevention and control of metabolic diseases should be the top public health priorities in Asian populations [3].
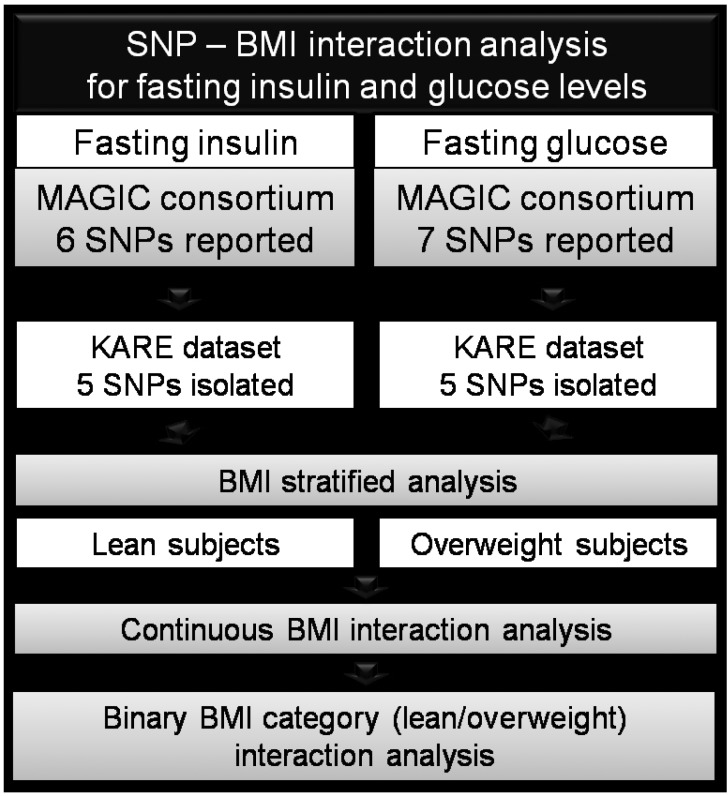
Glucose and insulin levels after overnight fasting are important indicators of glucose tolerance, insulin resistance, and type 2 diabetes [4]. Adiposity is believed modulate the genetic determinants of fasting glucose and insulin levels [5]. To identify genetic determinants that could be modified by body mass index (BMI), the interactions between genome-wide single-nucleotide polymorphisms (SNPs) and BMI with regard to fasting glucose and insulin levels were analyzed by the Meta-Analyses of Glucose- and Insulin-related traits Consortium (MAGIC) [6]. MAGIC identified several novel genetic variants: 7 SNPs (ARAP1, FOXA2, DPYSL5, PCSK1, PDX1, PPP1R3B, and OR4S1) for fasting glucose level and 6 SNPs (COBLL1-GRB14, IRS1, PPP1R3B, PDGFC, UHRF1BP1, and LYPLAL1) for fasting insulin level [6]. The MAGIC study comprised approximately 70,000 nondiabetic individuals of European ancestry, and its results should be confirmed in other ethnic groups [7].
Because no replication study has been performed in other ethnicities, we examined these SNPs and their association with fasting glucose and insulin levels and determined whether they are modified by obesity in the Korean population. The study design can be found in Fig. 1.

Methods

Study subjects and genotypes

The subjects and their genotypes in the original study have been reported [7]. The initial subjects were obtained from a subset of the Korean Genome and Epidemiology Study cohort (KoGES), known as Korean Association Resource (KARE, n = 8,842) [7]. Written informed consent was obtained from all participants, and this project was approved by the institutional review board at Korea National Institute of Health (KNIH).

Phenotypes and quantitative traits

Past diabetes history was obtained through structured questionnaires by interviewers. Anthropometric measurements, including weight and height, were also obtained, and BMI was calculated as weight (kg)/height (m2) [2]. Biochemical assessments were performed, including fasting serum glucose, 2-h 75 g oral glucose tolerance test, and fasting serum insulin (FSI). A total of 3,028 subjects with prevalent hyperglycemia (fasting glucose ≥ 110, 2-h glucose level after 75 g oral glucose challenge ≥ 140), or self-reported diabetes history were excluded. Of the 8,842 individuals who were examined in the previous genomewide association study [7], 5,814 nondiabetic individuals were selected.

SNP genotypes

The genotypes were obtained using the Affymetrix Genome-Wide Human SNP array 5.0 (Affymetrix Inc., Santa Clara, CA, USA). The genotype quality control criteria have been reported in a previous genome-wide association study [7]. Briefly, every 500 ng of genomic DNA was genotyped on the Affy 5.0, and the Bayesian robust linear genotyping algorithm using Mahalanobis distance was used for genotype calling [8]. Samples with a high missing genotype call rate (≥4%), high heterozygosity (>30%), inconsistency in sex, and any tumor were excluded from subsequent analyses.

Genotype imputation

Of the 13 SNPs that were reported by the MAGIC consortium, 4 SNPs were genotyped in the original KARE genotype data using the Affy 5.0. To maximize the validation SNPs in Koreans, the Chinese-Japanese HapMap dataset was imputed to obtain 6 additional SNPs. Thus, 10 SNPs were analyzed in this study. The detailed imputation procedure has been published. Briefly, the KARE dataset, comprising 351,677 SNPs in 8,842 individuals, was merged with that of the international HapMap Phase II Japanese (JPT) + Chinese (HCB) panel 2 [9]. The genotypes of the KARE individuals were imputed using IMPUTE [10]. Using the following filtering scheme-INFO ≥ 0.5 and posterior probability ≥ 0.9-1,827,004 SNPs were imputed, and 6 SNPs that matched among the 13 SNPs that were reported by MAGIC were selected for study.

Statistical analysis

Glucose and insulin levels were natural log-transformed. To examine the effects of SNP-BMI interactions on them, we conducted 4 statistical tests for each SNP. In all analyses, residential area, age, sex, and BMI were the covariates. The first 2 tests were linear regression analyses of lean (BMI < 25) and overweight subjects (BMI ≥ 25). The overall interactions between SNPs and BMI were analyzed using continuous BMI values and dichotomized BMI (lean subjects were coded with 1, and overweight subjects were coded with 2). Continuous BMI-SNP interaction analyses were performed using QUICKTEST (http://toby.freeshell.org/software/quicktest.shtml), and the dichotomized BMI-SNP interactions were analyzed using PLINK, version 1.07 [11].

Results and Discussion

The fasting serum glucose and insulin levels of our subjects are shown in Table 1. We divided subjects into 4 groups, based on BMI; most Korean subjects lay in the 20 ≤ BMI < 25 and 25 ≤ BMI < 30 categories. The MAGIC study had BMI cutoffs of < 25 and ≥ 30, and 237 of our subjects (4%) had BMI ≥ 30. Asians have lower rates of overweightedness and obesity than Western populations, per conventional definitions (BMI ≥ 25 for overweightedness and ≥ 30 for obesity) [3]. Despite having lower BMIs, Asian countries have a similar or greater prevalence of diabetes versus Western countries [12]. Thus, we used BMI < 25 and BMI ≥ 25 to analyze the effects of SNPs and SNP-dichotomized BMI interactions by stratum.
Of the 6 SNPs that were associated with FSI levels in the MAGIC studies, 5 SNPs could be tested in the current study, and no SNP was replicated in all 3 statistical tests (stratified BMI, continuous BMI interaction p-values, and dichotomized BMI interaction p-values) (see Table 2). Of the 7 reported SNPs that were linked to fasting plasma glucose levels, 5 SNPs could be tested in the current study, and 1 SNP (rs2293941) in pancreatic and duodenal homeobox 1 (PDX1) was significantly associated in lean subjects (beta ± SE, 0.007 ± 0.002; p = 0.001) but not in overweight subjects. The SNP-continuous BMI interaction was not significant, but the SNP-dichotomized BMI interaction was marginal (p = 0.04).
Our results indicate that the novel loci that were identified by MAGIC are poorly replicated in other ethnic groups, although we do not know why. We have identified an important genetic factor of glucose metabolism, PDX1, which regulates pancreatic beta-cell function and survival by governing expression of the insulin-encoding INS gene [13].
This study was limited by its exclusion of 3 other SNP-BMI interactions from MAGIC. These SNPs could not be extracted from the imputation data using the original Affy 5.0 in the KARE study. Another limitation of this study was the relatively weak significance of its association results compared with those of MAGIC. We do not know whether this lack of significance is due to the relatively smaller sample size of this study compared with MAGIC, the inaccuracy of imputation genotypes, or ethnic differences in the SNP-BMI interactions. These issues should be addressed in other Asian populations.
Although the replication of gene-environment interactions in other ethnic groups is difficult, interethnic conservation of the interaction results might help us determine the underlying mechanisms of the target phenotypes. Further, the rs2293941 SNP might help us understand individual differences in beta-cell function.

Acknowledgments

The genotypes and epidemiological traits were provided with biospecimens and data from the Korean Genome Analysis Project (4845-301, 2013-NG72001-00), the Korean Genome and Epidemiology Study (4851-302), and the Korean Biobank Project (4851-307, KBP-2013-000), which were supported by the Center for Disease Control and Prevention, Republic of Korea.

References

1. den Boer AT, Herraets IJ, Stegen J, Roumen C, Corpeleijn E, Schaper NC, et al. Prevention of the metabolic syndrome in IGT subjects in a lifestyle intervention: results from the SLIM study. Nutr Metab Cardiovasc Dis 2013;23:1147–1153. PMID: 23462149.
crossref pmid
2. Katzmarzyk PT. Physical activity, sedentary behavior, and health: paradigm paralysis or paradigm shift. Diabetes 2010;59:2717–2725. PMID: 20980470.
crossref pmid pmc
3. Chan JC, Malik V, Jia W, Kadowaki T, Yajnik CS, Yoon KH, et al. Diabetes in Asia: epidemiology, risk factors, and pathophysiology. JAMA 2009;301:2129–2140. PMID: 19470990.
crossref pmid
4. Sims EA, Danforth E Jr. Expenditure and storage of energy in man. J Clin Invest 1987;79:1019–1025. PMID: 3549776.
crossref pmid pmc
5. Kahn SE, Hull RL, Utzschneider KM. Mechanisms linking obesity to insulin resistance and type 2 diabetes. Nature 2006;444:840–846. PMID: 17167471.
crossref pmid
6. Manning AK, Hivert MF, Scott RA, Grimsby JL, Bouatia-Naji N, Chen H, et al. A genome-wide approach accounting for body mass index identifies genetic variants influencing fasting glycemic traits and insulin resistance. Nat Genet 2012;44:659–669. PMID: 22581228.
crossref pmid pmc
7. Cho YS, Go MJ, Kim YJ, Heo JY, Oh JH, Ban HJ, et al. A large-scale genome-wide association study of Asian populations uncovers genetic factors influencing eight quantitative traits. Nat Genet 2009;41:527–534. PMID: 19396169.
crossref pmid
8. Rabbee N, Speed TP. A genotype calling algorithm for affymetrix SNP arrays. Bioinformatics 2006;22:7–12. PMID: 16267090.
crossref pmid
9. Hong KW, Lim JE, Kim YJ, Cho NH, Shin C, Oh B. KARE genomewide association study of blood pressure using imputed SNPs. Genomics Inform 2010;8:103–107.
crossref
10. Howie BN, Donnelly P, Marchini J. A flexible and accurate genotype imputation method for the next generation of genome-wide association studies. PLoS Genet 2009;5:e1000529. PMID: 19543373.
crossref pmid pmc
11. Purcell S, Neale B, Todd-Brown K, Thomas L, Ferreira MA, Bender D, et al. PLINK: a tool set for whole-genome association and population-based linkage analyses. Am J Hum Genet 2007;81:559–575. PMID: 17701901.
crossref pmid pmc
12. Yoon KH, Lee JH, Kim JW, Cho JH, Choi YH, Ko SH, et al. Epidemic obesity and type 2 diabetes in Asia. Lancet 2006;368:1681–1688. PMID: 17098087.
crossref pmid
13. Macfarlane WM, Frayling TM, Ellard S, Evans JC, Allen LI, Bulman MP, et al. Missense mutations in the insulin promoter factor-1 gene predispose to type 2 diabetes. J Clin Invest 1999;104:R33–R39. PMID: 10545530.
crossref pmid pmc
Fig. 1
Schematic of the study design. SNP, single-nucleotide polymorphism; BMI, body mass index; MAGIC, Meta-Analysis of Glucose and Insulin Consortium; KARE, Korean Association Resource consortium.
gni-12-236-g001.jpg
Table 1.
Clinical characteristics
Characteristic Body mass index (BMI) strata
BMI < 20 20 ≤ BMI < 25 25 ≤ BMI < 30 30 ≤ BMI
No. 366 3,143 2,068 237
Residential area (Anseong/Ansan) 223/143 1511/1632 964/1,104 131/106
Sex (male/female) 216/150 1,495/1,648 981/1,087 67/170
Age (y) 53.7 ± 10.1 51.0 ± 8.8 50.8 ± 8.3 52.0 ± 8.1
Body mass index (kg/m2) 18.9 ± 0.9 22.8 ± 1.3 26.7 ± 1.2 31.6 ± 1.7
Fasting glucose levels (mmol/L) 4.42 ± 0.42 4.52 ± 0.41 4.60 ± 0.42 4.65 ± 0.48
Fasting serum insulin levels (pmol/L) 39.5 ± 17.8 46.8 ± 20.0 57.0 ± 25.2 68.0 ± 30.0

Values are presented as number or mean ± standard deviation.

Table 2.
Replication results of MAGIC-reported SNPs for fasting insulin levels and fasting glucose levels
Parameter Nearest gene
Fasting insulin levels
Fasting glucose levels
COBLL1-G RB14 IRS1 PPP1R3B PDGFC UHRF1BP1 LYPLAL1 ARAP1 FOXA2 DPYSL5 PCSK1 PDX1 PPP1R3B OR4S1
MAGIC [6]
 SNP rs7607980 rs2943634 rs4841132 rs4691380 rs4646949 rs2785980 rs11603334 rs6048205 rs1371614 rs13179048 rs2293941 rs4841132 rs1483121
 R T C A C T T G A T C A A G
 Freq 0.88 0.66 0.10 0.67 0.75 0.67 0.83 0.95 0.25 0.69 0.22 0.10 0.86
 BMI < 25
  Beta 0.023 0.018 0.021 0.016 0.014 0.016 0.022 0.040 0.020 0.022 0.019 0.027 0.021
  SE 0.003 0.003 0.004 0.003 0.003 0.003 0.003 0.005 0.003 0.003 0.003 0.005 0.004
 BMI ≥ 30
  Beta 0.039 0.025 0.031 0.021 0.020 0.017 0.030 0.029 0.022 0.018 0.016 0.030 0.015
  SE 0.004 0.004 0.006 0.004 0.004 0.004 0.004 0.007 0.004 0.004 0.004 0.007 0.005
 Joint-meta analysis p-value 4.3 × 10⁻²⁰ 2.5 × 10⁻¹⁴ 1.7 × 10⁻¹⁰ 5.3 × 10⁻⁹ 3.7 × 10⁻⁸ 2.0 × 10⁻⁸ 2.4 × 10⁻¹⁴ 1.6 × 10⁻¹² 2.3 × 10⁻¹² 1.6 × 10⁻¹⁰ 5.3 × 10⁻¹⁰ 7.6 × 10⁻⁹ 1.6×10⁻⁸
KARE
 G/I - G I G G G I I - I I I -
 R - C A C T T G A - C A A -
 Freq - 0.92 0.01 0.71 0.41 0.67 0.94 0.85 - 0.70 0.47 0.01 -
 BMI < 25
  Lean - 3,508 3,503 3,509 3,508 3,507 3,439 3,495 - 3,488 3,485 3,497 -
  Beta - 0.001 -0.017 - 0.010 - 0.015 0.009 0.001 0.008 - - 0.002 0.007 0.006 -
  SE - 0.021 0.047 0.013 0.012 0.013 0.005 0.003 - 0.002 0.002 0.008 -
  p-value - 9.7E-01 7.2E-01 4.6E-01 2.0E-01 4.6E-01 9.1E-01 1.0E-02a - 3.7E-01 1.1 E-03b 5.1E-01 -
 BMI ≥ 25
  Obese - 2,303 2,303 2,305 2,302 2,305 2,262 2,287 - 2,291 2,290 2,303 -
  Beta - 0.004 -0.013 -0.009 0.008 0.015 0.005 0.005 - 0.002 0.000 0.017 -
  SE - 0.027 0.069 0.016 0.015 0.016 0.005 0.004 - 0.003 0.003 0.013 -
  p-value - 8.8E-01 8.5E-01 5.7E-01 5.7E-01 3.5E-01 3.2E-01 1.7E-01 - 5.6E-01 8.7E-01 1.8E-01 -
Interaction p-value
 Continuo us BMI - 0.88 0.81 0.90 0.11 0.44 0.92 0.87 - 0.60 0.24 0.52 -
 Dichotom ized BMI - 0.76 0.97 0.96 0.24 0.71 0.44 0.56 - 0.44 0.04c 0.73 -

MAGIC, Meta-Analyses of Glucose- and Insulin-related trait Consortium; SNP, single-nucleotide polymorphism; R, trait-rising allele Freq, R allele frequency; BMI, body mass index; SE, standard error of beta; KARE, Korean Association Resource; G/I, genotyped SNP/imputed SNP; the replicated SNPs are in bold; FDR, false discovery rate.

a Adjusted p-value: FDR = 0.05, Bonferroni = 0.10;

b FDR = 0.011, Bonferroni = 0.011;

c FDR = 0.40, Bnferroni = 0.40.


ABOUT
ARTICLE CATEGORY

Browse all articles >

BROWSE ARTICLES
FOR CONTRIBUTORS
Editorial Office
Room No. 806, 193 Mallijae-ro, Jung-gu, Seoul 04501, Korea
Tel: +82-2-558-9394    Fax: +82-2-558-9434    E-mail: kogo3@kogo.or.kr                

Copyright © 2024 by Korea Genome Organization.

Developed in M2PI

Close layer
prev next