Genomics Inform Search

CLOSE


Genomics Inform > Volume 11(1); 2013 > Article
Lee, Lim, and Kim: Annotation of Genes Having Candidate Somatic Mutations in Acute Myeloid Leukemia with Whole-Exome Sequencing Using Concept Lattice Analysis

Abstract

In cancer genome studies, the annotation of newly detected oncogene/tumor suppressor gene candidates is a challenging process. We propose using concept lattice analysis for the annotation and interpretation of genes having candidate somatic mutations in whole-exome sequencing in acute myeloid leukemia (AML). We selected 45 highly mutated genes with whole-exome sequencing in 10 normal matched samples of the AML-M2 subtype. To evaluate these genes, we performed concept lattice analysis and annotated these genes with existing knowledge databases.

Introduction

Acute myeloid leukemia (AML) is one of the most wellstudied diseases in the genomic research area [1, 2]. AML occurs usually in middle-aged people and is diagnosed by increasing leukemic myeloblasts in blood over 30% [3]. AML is a genetically heterogeneous disease, since 1/3 of AML patients have chromosomal rearrangements, like t(8;21) and t(15;17), but other AML patients have normal karyotypes [4]. With recent advances of high-throughput genomic technology, a favorable prognosis has been observed with some genetic changes in cytogenetically normal AML [5]. These results were reflected by the World Health Organization (WHO) diagnostic criteria; the NMP1 and CEBPA mutations were included in the 2008 revision of these criteria [6]. The molecular change of AML is considered to be the accumulation of somatic mutations in hematopoietic progenitor cells [7]. Next-generation sequencing technology gave us new insights into the clonal heterogeneity of leukemic mutations so that we can make an explanation why some of these mutations are highly reproducible but others are very rare [8]. Still, in 30% of cytogenetically normal AML, the genetic causality origin or strongly associated genetic changes have not yet been discovered [9, 10].
With advances of high-throughput technology, discovery of disease-associated genes is growing [11]. As a consequence, the genetic knowledge databases are growing rapidly. Accordingly, the annotation of candidate causal genes in genetic studies is a very challenging process for researchers. We propose a workflow of the detection of somatic mutation candidates in 10 normal matched AML samples and introduce concept lattice analysis for clustering the samples that have highly mutated genes in common.

Methods

Primacy sequence analysis

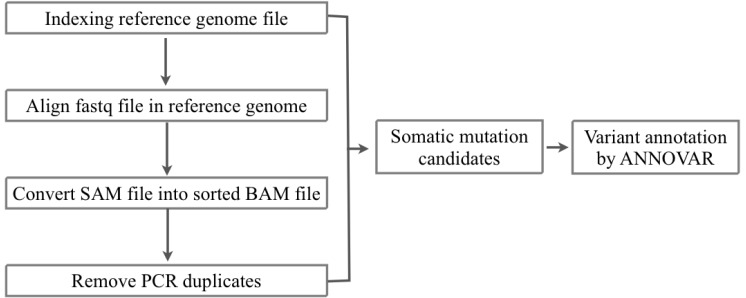
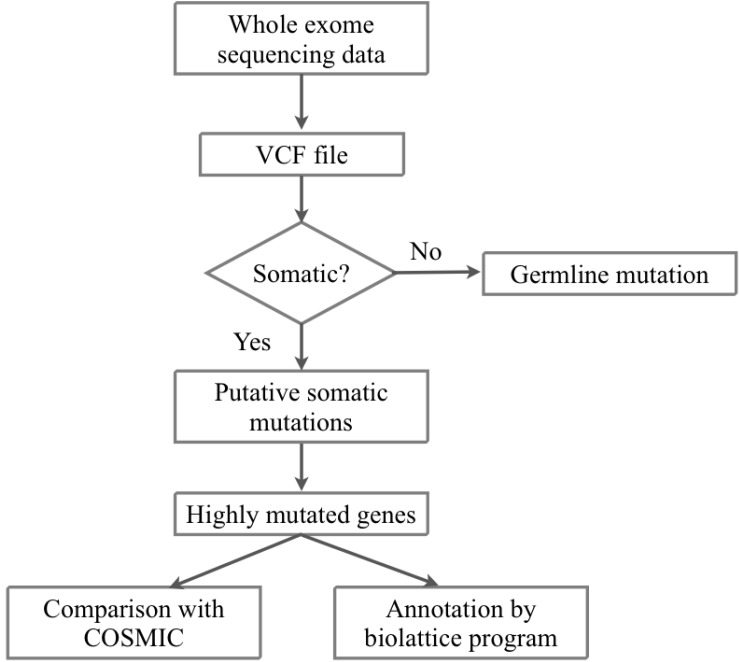
We received the fastq files of whole-exome sequencing results of tumor and matched normal sample data of 10 AML patients from the Korea Genome Organization in December 2012. There were no patient-related medical or characteristic data. We aligned the sequencing reads to the human reference genome (hg 19, GRCh37) from USCC by BWA 0.6.2 [12] (Figs. 1 and 2). To filter the known single nucleotide polymorphisms (SNPs), we used dbSNP bulid 137. We removed PCR duplicates and filtering low-quality SNPs by Samtools 0.1.18 [13], Picard 1.68 [14], and GATK 2.3.4 [15]. After the filtering process, the SAM file was converted to VCF file by VCF Tools 0.1.10 [16]. For detecting somatic mutation candidates, we obtained the difference in VCF files between tumor and normal samples. For annotation of these somatic mutation candidates, we used the ANNOVAR tool [17].

Formal concept analysis

We used formal concept analysis (FCA) for the construction of hierarchical relationships among samples sharing highly mutated genes [18]. FCA is a useful method in conceptual clustering of objects, attributes, and their binary relationship. In FCA, the sets of formal objects and formal attributes together with their relation to each other form a "formal context," which can be represented by a crosstable. In our case, the objects are 10 AML samples, and the attributes are 45 highly mutated genes. We defined the formal context as K = (G, M, I), where G is a set of objects (i.e., samples), M is a set of attributes (i.e., mutated genes), and I ⊆ G × M is the incidence relations where (g, m) ⊆ I if object g has attribute m. For A ⊆ G and B ⊆ M, we define the operators A' = {m ∈ M|gIm for all g ∈ A} (i.e., the set of attributes common to the objects in A) and B' = {g ∈ G|gIm for all m ∈ B} (i.e., the set of objects common to the attributes in B). A pair of (A, B) is a formal concept of k(G, M, I) if and only if A ⊆ G, B ⊆ M, A' = B, and A = B'. A is called the extent and B is the intent of the concept (A, B). The extent consists of all objects belonging to the concept while the intent contains all attributes shared by the objects. The concept of a given context is naturally ordered by the subconcept-superconcept relation, defined by (A1, B1) ≤ (A2, B2): <=> A1A2 (<=> B2B1).
The ordered set of all concepts of the context (G, M, I) is denoted by C(G, M, I) and is called the concept lattice of (G, M, I). We represent the structure of this concept lattice with a Hasse diagram, in which nodes are the concepts and the edges correspond to the neighborhood relationship among the concepts. All concepts above an object label (below the attribute label) include that object (attribute). The top element of a lattice is a unit concept, representing a concept that contains all objects. The bottom element is a zero concept having no object.

Results

Overview of mutations

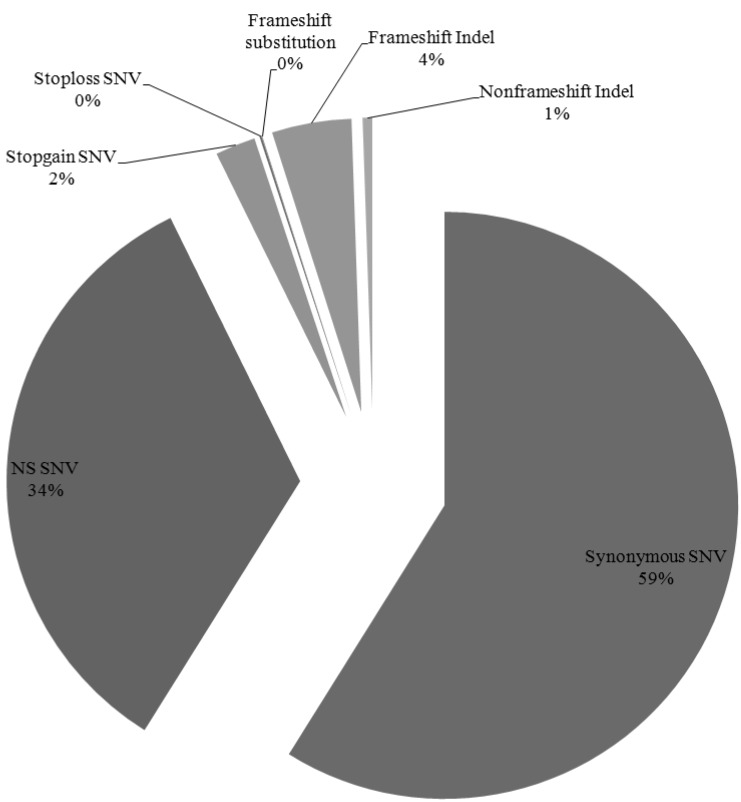
We have identified 12,908 somatic mutation candidates in 10 AML sequenced exomes, including 1,281 point mutations, 625 insertion/deletions (Indels) (Table 1, Fig. 3). The point mutations include 7,483 synonymous single nucleotide variations (SNVs), 4,297 nonsynonymous SNVs, 282 stopgain SNVs, 14 stoploss SNVs, and 5 frameshift substitutions, and the Indels include 247 frame shift insertions, 310 frameshift deletions, and 68 nonframe shifts (Fig. 4). For each patient, the average nonsynonymous mutation count was 429.7 (SD, 97.16).
About 342 to 665 genes have nonsynonymous somatic mutation candidates at least once in each AML sample (Table 2). Recurrent mutated genes were observed in all samples.

Mutation analysis

The most frequently mutated genes across all samples were USP9Y and MUC5B; these genes were mutated in 5 samples. These genes were also highly mutated in each sample; for USP9Y genes, it had 6 nonsynonymous mutations in sample 3. We have selected 45 highly mutated genes (1.5%) from 2981 mutated genes. We defined highly mutated genes as genes having 3 or more nonsynonymous mutations in each sample (Table 3). In a comparison of mutations with the COSMIC database [19], among 45 highly mutated genes, 21 genes matched to hematopoietic and lymphoid tissue malignancy terms, and 21 genes matched to other cancer types. In 3 genes, there was no matched term in COSMIC (Table 4).
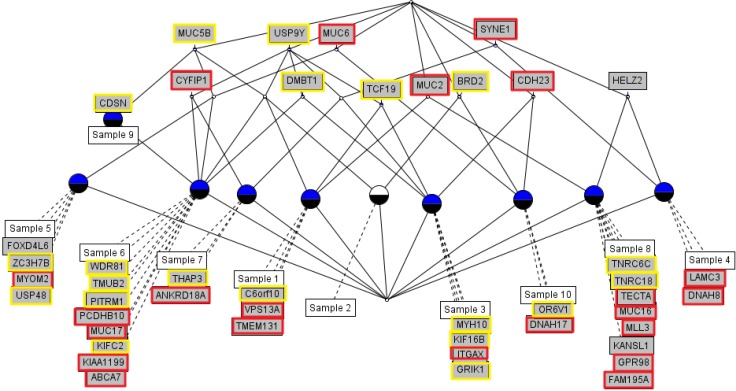
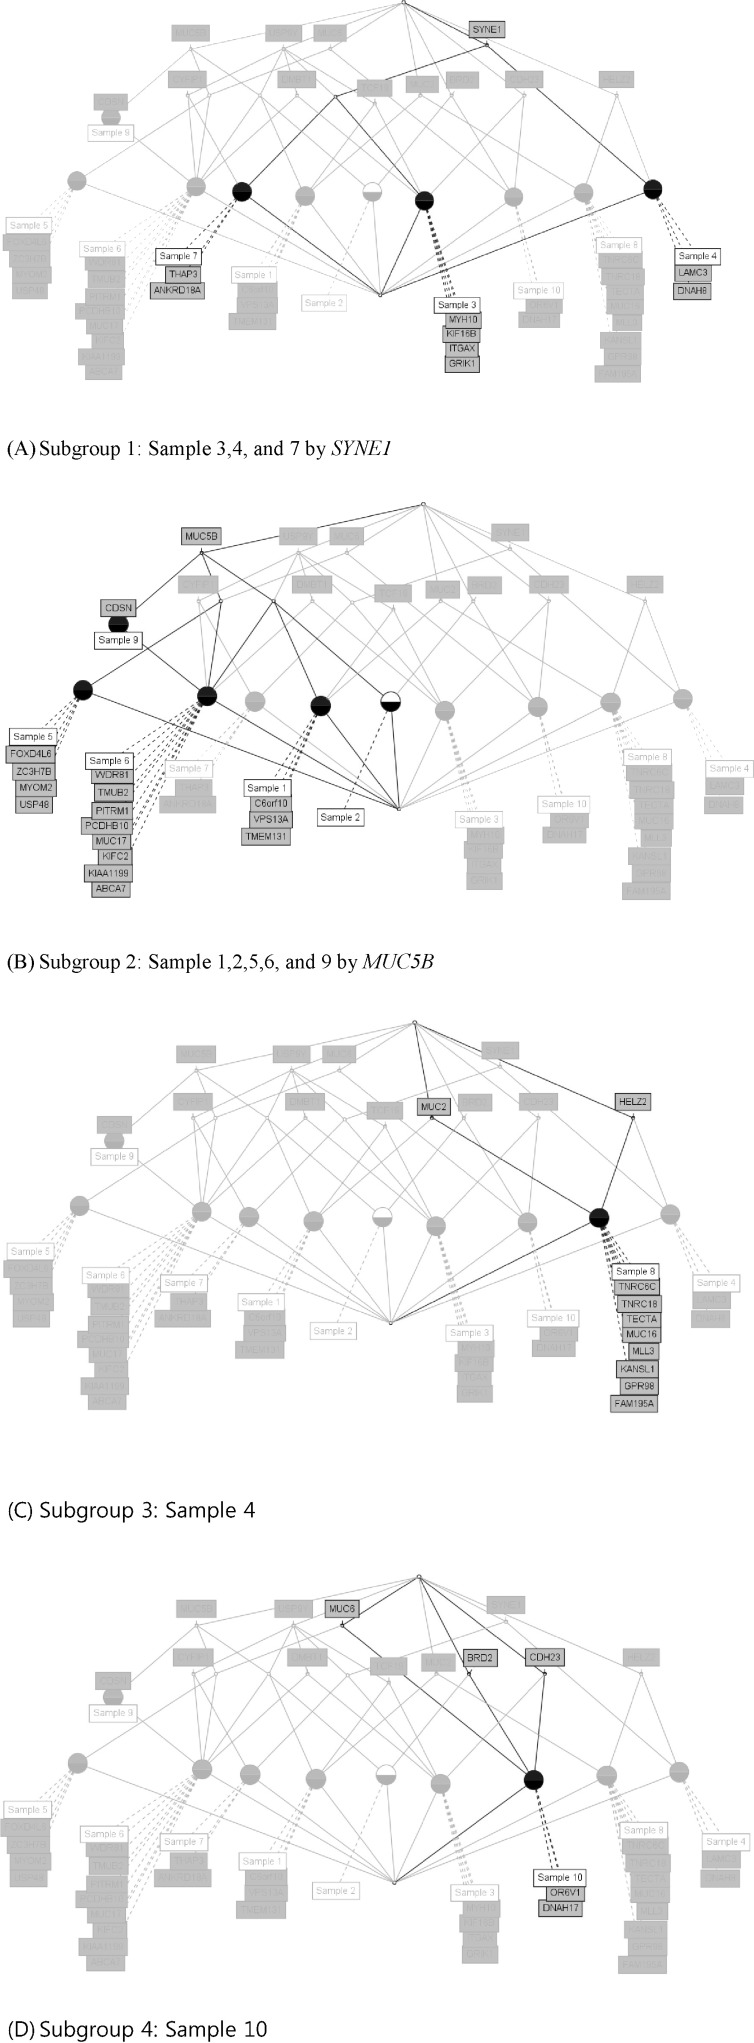
We used the concept lattice to construct the hierarchical relationship between the samples that had 45 highly mutated genes. Concept Biolattice analysis is a mathematical framework based on concept lattice analysis for better biological interpretation of genomic data. The top element of a lattice is a unit concept, representing a concept that contains all objects. The bottom element is a zero concept having no object [20, 21]. For comparing with the Concept lattice (Fig. 5), we also performed hierarchical clustering analysis by Ward method. In hierarchical clustering, cluster 1 has 5 samples (nos. 1, 2, 5, 9, and 10), cluster 2 has 2 samples (nos. 4 and 7), and others have 1 sample each (Fig. 6). We divided the samples into 4 subgroups by interpretation of the concept lattice result (Fig. 7). Lattice subgroup 1 shared SYNE1 gene mutation, and samples 3, 4, and 7 were included in this subgroup. Subgroup 2 was comprised of 5 samples (nos. 1, 2, 5, 6, and 9) that had MUC5 gene mutations in common. Samples 10 and 8 could be isolated by the uniqueness of their mutated gene sharing pattern.

Discussion

In this study, we proposed a workflow of matched normal AML exome sequencing analysis and the framework for defining sample subgroups. We observed every sample having a nonsynonymous mutation associated with hematological and lymphoid malignancy genes, but the candidate oncogenes showed diverse characters.
We selected 45 genes that had 3 or more nonsynonymous mutations and performed hierarchical clustering analysis of the samples by these genes. In classic hierarchical clustering analysis by Ward's method, we could not identify the genetic relationship of those clusters. On the other hand, the result of concept lattice analysis gave us insight into the mutational pattern of each sample.
In subgroup 1, samples 3, 4, and 7 shared SYNE1 gene mutations. SYNE1 gene encodes a spectrin repeat-containing protein expressed in skeletal and smooth muscle and peripheral blood lymphocytes that localizes to the nuclear membrane [21]. This gene is not a well-known leukemic gene but is observed in some hematological malignancies and other cancer types [22]. In glioblastoma, SYNE1 mutation is significantly correlated with the overexpression of several known glioblastoma survival genes [23]. In the case of sample 3, the ITGAX gene, encoding ankyrin repeat domain 18A, was mutated. This gene is well known by the association with leukemia [24] and lung cancer [25]. For sample 4, the possible oncogene is LAMC3. LAMC3 gene encodes laminins, which are the major non-collagenous constituent of basement membrane. LAMC3 mutations are associated with several cancers, including colon cancer, lung cancer, and melanoma, and candidate tumor suppressor genes in bladder transitional cell carcinoma [26]. LAMC3 is involved in the phosphatidylinositol 3-kinase.Akt signaling pathway, since it has a role in cell adhesion. The ANKRD18A gene is the oncogene candidate for sample 7 and is a novel epigenetic regulation gene in lung cancer [25]. Therefore, it is possible that the pair relationship of those genes (ITGAX-SYNE1, LAMC3- SYNE1, and ANKRD18A-SYNE1) could contribute together to evolve the leukemic cell transformation.
The major limitation of our study is that we could not validate the mutation results by Sanger method or deep sequencing. We selected highly mutated genes having 3 mutations or more, but this definition is arbitrary, so we might have lost candidate oncogenes in some patients.
In this study, we suggest the concept of clustering samples that have diverse mutated genes. AML is very heterogeneous genetic disease. Despite the small number of samples we have studied, the genetic variation patterns were not common for all samples. It could have been better to evaluate more sample data for analysis by clustering analysis.

Acknowledgments

This work was supported by the basic science research program through the National Research Foundation of Korea (NRF), funded by the Ministry of Education, Science and Technology (2012-0000994). This material is based upon work supported by the Korea Genome Organization.

References

1. Ley TJ, Mardis ER, Ding L, Fulton B, McLellan MD, Chen K, et al. DNA sequencing of a cytogenetically normal acute myeloid leukaemia genome. Nature 2008;456:66–72. PMID: 18987736.
crossref pmid pmc
2. Hebestreit K, Gröttrup S, Emden D, Veerkamp J, Ruckert C, Klein HU, et al. Leukemia gene atlas: a public platform for integrative exploration of genome-wide molecular data. PLoS One 2012;7:e39148. PMID: 22720055.
crossref pmid pmc
3. Löwenberg B, Downing JR, Burnett A. Acute myeloid leukemia. N Engl J Med 1999;341:1051–1062. PMID: 10502596.
crossref pmid
4. Fröhling S, Scholl C, Gilliland DG, Levine RL. Genetics of myeloid malignancies: pathogenetic and clinical implications. J Clin Oncol 2005;23:6285–6295. PMID: 16155011.
crossref pmid
5. Patel JP, Gönen M, Figueroa ME, Fernandez H, Sun Z, Racevskis J, et al. Prognostic relevance of integrated genetic profiling in acute myeloid leukemia. N Engl J Med 2012;366:1079–1089. PMID: 22417203.
crossref pmid pmc
6. Vardiman JW, Thiele J, Arber DA, Brunning RD, Borowitz MJ, Porwit A, et al. The 2008 revision of the World Health Organization (WHO) classification of myeloid neoplasms and acute leukemia: rationale and important changes. Blood 2009;114:937–951. PMID: 19357394.
crossref pmid
7. Marcucci G, Haferlach T, Döhner H. Molecular genetics of adult acute myeloid leukemia: prognostic and therapeutic implications. J Clin Oncol 2011;29:475–486. PMID: 21220609.
crossref pmid
8. Ley TJ, Ding L, Walter MJ, McLellan MD, Lamprecht T, Larson DE, et al. DNMT3A mutations in acute myeloid leukemia. N Engl J Med 2010;363:2424–2433. PMID: 21067377.
crossref pmid pmc
9. Graubert TA, Mardis ER. Genomics of acute myeloid leukemia. Cancer J 2011;17:487–491. PMID: 22157292.
crossref pmid pmc
10. Tiu RV, Gondek LP, O'Keefe CL, Huh J, Sekeres MA, Elson P, et al. New lesions detected by single nucleotide polymorphism array-based chromosomal analysis have important clinical impact in acute myeloid leukemia. J Clin Oncol 2009;27:5219–5226. PMID: 19770377.
crossref pmid pmc
11. Jostins L, Barrett JC. Genetic risk prediction in complex disease. Hum Mol Genet 2011;20:R182–R188. PMID: 21873261.
crossref pmid pmc
12. Li H, Durbin R. Fast and accurate short read alignment with Burrows-Wheeler transform. Bioinformatics 2009;25:1754–1760. PMID: 19451168.
crossref pmid pmc
13. Li H, Handsaker B, Wysoker A, Fennell T, Ruan J, Homer N, et al. The Sequence Alignment/Map format and SAMtools. Bioinformatics 2009;25:2078–2079. PMID: 19505943.
crossref pmid pmc
14. Picard. Souceforge.net 2009. Accessed 2012 Nov 30. Available from: http://picard.sourceforge.net/.
pmid
15. McKenna A, Hanna M, Banks E, Sivachenko A, Cibulskis K, Kernytsky A, et al. The Genome Analysis Toolkit: a Map-Reduce framework for analyzing next-generation DNA sequencing data. Genome Res 2010;20:1297–1303. PMID: 20644199.
crossref pmid pmc
16. Danecek P, Auton A, Abecasis G, Albers CA, Banks E, DePristo MA, et al. The variant call format and VCFtools. Bioinformatics 2011;27:2156–2158. PMID: 21653522.
crossref pmid pmc
17. Wang K, Li M, Hakonarson H. ANNOVAR: functional annotation of genetic variants from high-throughput sequencing data. Nucleic Acids Res 2010;38:e164. PMID: 20601685.
crossref pmid pmc
18. Ganter R, Wille R. Formal Concept Analysis: Mathematical Foundations. 1999. Berlin: Springer Verlag.

19. Forbes SA, Bindal N, Bamford S, Cole C, Kok CY, Beare D, et al. COSMIC: mining complete cancer genomes in the Catalogue of Somatic Mutations in Cancer. Nucleic Acids Res 2011;39:D945–D950. PMID: 20952405.
crossref pmid
20. Kim J, Chung HJ, Jung Y, Kim KK, Kim JH. BioLattice: a framework for the biological interpretation of microarray gene expression data using concept lattice analysis. J Biomed Inform 2008;41:232–241. PMID: 18093880.
crossref pmid
21. Stelzer G, Dalah I, Stein TI, Satanower Y, Rosen N, Nativ N, et al. In-silico human genomics with GeneCards. Hum Genomics 2011;5:709–717. PMID: 22155609.
crossref pmid pmc
22. Forbes SA, Tang G, Bindal N, Bamford S, Dawson E, Cole C, et al. COSMIC (the Catalogue of Somatic Mutations in Cancer): a resource to investigate acquired mutations in human cancer. Nucleic Acids Res 2010;38:D652–D657. PMID: 19906727.
crossref pmid
23. Masica DL, Karchin R. Correlation of somatic mutation and expression identifies genes important in human glioblastoma progression and survival. Cancer Res 2011;71:4550–4561. PMID: 21555372.
crossref pmid pmc
24. Scott CS, Richards SJ, Master PS, Kendall J, Limbert HJ, Roberts BE. Flow cytometric analysis of membrane CD11b, CD11c and CD14 expression in acute myeloid leukaemia: relationships with monocytic subtypes and the concept of relative antigen expression. Eur J Haematol 1990;44:24–29. PMID: 1689668.
crossref pmid
25. Liu WB, Han F, Jiang X, Yang LJ, Li YH, Liu Y, et al. ANKRD18A as a novel epigenetic regulation gene in lung cancer. Biochem Biophys Res Commun 2012;429:180–185. PMID: 23131552.
crossref pmid
26. Amira N, Cancel-Tassin G, Bernardini S, Cochand-Priollet B, Bittard H, Mangin P, et al. Expression in bladder transitional cell carcinoma by real-time quantitative reverse transcription polymerase chain reaction array of 65 genes at the tumor suppressor locus 9q34.1-2: identification of 5 candidates tumor suppressor genes. Int J Cancer 2004;111:539–542. PMID: 15239131.
crossref pmid
Fig. 1
Primary sequence analysis pipeline.
gni-11-38-g001.jpg
Fig. 2
Workflow of detection of somatic mutation candidate from exome sequencing of normal matched samples from 10 acute myeloid leukemia.
gni-11-38-g002.jpg
Fig. 3
Distribution of somatic mutation candidates in all samples. NS SNV, nonsynonymous single nucleotide variation.
gni-11-38-g003.jpg
Fig. 4
Distribution of nonsynonymous somatic mutations in 10 acute myeloid leukemia samples. NS SNPs, nonsynonymous single nucleotide polymorphisms.
gni-11-38-g004.jpg
Fig. 5
Concept lattice of 45 genes and 10 acute myeloid leukemia patients having 3 or more nonsynonymous mutations, annotated by COSMIC database. Red rectangles represent annotated hematopoietic and lymphoid tissue malignancy; yellow rectangles represent other cancer type annotated in the COSMIC database.
gni-11-38-g005.jpg
Fig. 6
Hierarchical clustering of samples by binarized score of 45 highly mutated gene states.
gni-11-38-g006.jpg
Fig. 7
Subgroup analysis by concept lattice. (A) Subgroup 1 shares SYNE1 mutation in samples 3, 4 and 7. (B) Subgroup 2 shares MUC5B mutation in samples 1, 2, 5, 6, and 9. (C) Subgroup 3 sample 8 only has mutated genes, such as MUC2 and HELZ2. (D) Subgroup 4 has sample 10, having only mutated genes, like MUC6, CDH23, BRD2, OR6V1, and DNAH17.
gni-11-38-g007.jpg
Table 1.
The distribution of somatic mutation candidates in 10 AML samples
Samle No. Synonymous SNP NS SNPs Stopgain SNV Stoploss SNV Frameshift substitution Frameshift insertion Frameshift deletion Nonframeshift Indel Unknown
1 729 409 23 2 0 26 34 10 21
2 603 352 17 2 0 19 29 9 12
3 840 482 22 0 1 30 40 6 23
4 568 333 22 1 0 18 30 5 13
5 838 480 33 0 1 32 35 12 19
6 1,099 649 47 3 0 21 39 5 40
7 751 411 33 3 1 31 34 7 15
8 828 469 36 3 0 30 26 4 21
9 534 317 21 0 1 21 9 4 15
10 693 395 28 0 1 19 34 6 23
Mean 748.3 429.7 28.2 1.4 0.5 24.7 31 6.8 20.2
SD 166.25 97.16 9.07 1.34 0.5 5.65 8.83 2.69 8.05

AML, acute myeloid leukemia; SNP, single nucleotide polymorphism; NS, nonsynonymous; SNV, single nucleotide variation.

Table 2.
Classification of genes according to the count of mutations in each sample
Sample no. No. with more than 1 mutated genes No. with more than 2 mutated genes No. with more than 3 mutated genes No. with more than 4 mutated genes
1 454 30 7 3
2 369 31 3 1
3 513 47 9 3
4 370 30 4 0
5 532 39 7 3
6 665 72 14 5
7 465 41 5 2
8 506 46 10 1
9 342 20 2 0
10 442 29 5 1
Mean 465.8 38.5 6.6 1.9
Table 3.
List of 3 more mutated genes in 10 AML samples
Sample no. Symbols of 3 or more mutated genes
1 USP9Ya, MUC5Ba, TCF19c, MUC2c, C6orf10, VPS13A, TMEM131
2 USP9Ya, MUC5Ba, BRD2c
3 USP9Ya, SYNE1b, CDH23, TCF19c, MYH10, KIF16B, ITGAX, GRIK1, DMBT1
4 SYNE1b, LAMC3, HELZ2, DNAH8
5 MUC5Ba, MUC6b, TCF19c, FOXD4L6, ZC3H7B, MYOM2, USP48
6 USP9Ya, MUC5Ba, MUC6b, CDSNc, WDR81, DMBT1, CYFIP1, TMUB2, PITRM1, PCDHB10, MUC17, KIFC2, KIAA1199, ABCA7
7 USP9Ya, SYNE1b, THAP3, CYFIP1, ANKRD18A
8 MUC2c, HELZ2, TNRC6C, TNRC18, TECTA, MUC16, MLL3, KANSL1, GPR98, FAM195A
9 MUC5Ba, CDSNc
10 MUC6b, BRD2c, CDH23, OR6V1, DNAH17

a Genes mutated in 5 samples;

b Genes mutated in 3 samples;

c Genes mutated in 2 samples.

Table 4.
Comparison of list of 3 more mutated genes with COMIC database
COSMIC cancer type Hematopoietic and lymphoid_tissue Other cancer type None
Gene symbol ABCA7 BRD2 KANSL1
ANKRD18A C6orf10 FOXD4L6
CDH23 CDSN HELZ2
CYFIP1 DMBT1
DNAH17 GRIK1
DNAH8 KIF16B
FAM195A KIFC2
GPR98 MUC5B
ITGAX MUC6
KIAA1199 MYH10
LAMC3 OR6V1
MLL3 PITRM1
MUC16 TCF19
MUC17 THAP3
MUC2 TMUB2
MYOM2 TNRC18
PCDHB10 TNRC6C
SYNE1 USP48
TECTA USP9Y
TMEM131 WDR81
VPS13A ZC3H7B
Count 21 21 3


ABOUT
ARTICLE CATEGORY

Browse all articles >

BROWSE ARTICLES
FOR CONTRIBUTORS
Editorial Office
Room No. 806, 193 Mallijae-ro, Jung-gu, Seoul 04501, Korea
Tel: +82-2-558-9394    Fax: +82-2-558-9434    E-mail: kogo3@kogo.or.kr                

Copyright © 2024 by Korea Genome Organization.

Developed in M2PI

Close layer
prev next