Introduction
Breast cancer is known to one of the leading causes of cancer death among females [1]. A massive number of research studies on the genomic characterization of breast cancer, particularly the discovery of differentially expressed genes (DEGs), have revealed clinically relevant molecular subtypes [2], which has increased the accuracy of the prognosis [3–5] and has resulted in successful targeted therapy [6, 7]. During recent decades, resources based on high-throughput sequencing technologies, such as The Cancer Genome Atlas (TCGA) [8] and International Cancer Genome Consortium (ICGC) [9], have facilitated more accurate detection of DEGs and cancer driver genes. The identification of DEGs is prominent, in that it leads to more accurate subtyping and more precise treatment for various types of cancers.
In transcriptome analysis based on microarray [10] or RNA sequencing [11] by next-generation sequencing, DEGs are usually identified by statistical tests, such as t test, nonparametric test, and Bayesian models [12]. Subsequent analysis of pathways and functional enrichment tests for DEGs are performed to increase the understanding of molecular mechanisms [13].
In the case of breast cancer, it is well known that molecular subtype and patient age are strongly associated with clinical features, such as survival rate. Fredholm et al. [14] reported that the 5-year survival rate was lowest in the of 25–34-year-old age group and decreased with increasing age. Likewise, Gnerlich et al. [15] reported that younger women were more likely to die from breast cancer than older ones, based on the statistics of 243,012 breast cancer patients. Recently, Azim et al. [16] studied genomic aberrations in young and elderly breast cancer patients based on TCGA data. They found that older patients had more somatic mutations and copy number variations (CNVs) and that 11 mutations and two CNVs were independently associated with age at diagnosis.
In this work, we aimed to classify human genes based on age-specific differential expression between normal and breast cancer cells. DEGs were identified based on their p-values for differential gene expression between tumor and matched normal cells. DEGs and non-DEGs were then classified based on age-specific differential expression by the three age groups we defined. To show an application of the classification, we compared the accuracy of prediction models that distinguish normal and tumor cells, constructed by support vector machine (SVM) using various combinations of genes by class. The performance of SVM was measured by the average area under the receiver operating characteristics curve value after 1,000 times bootstrap.
Methods
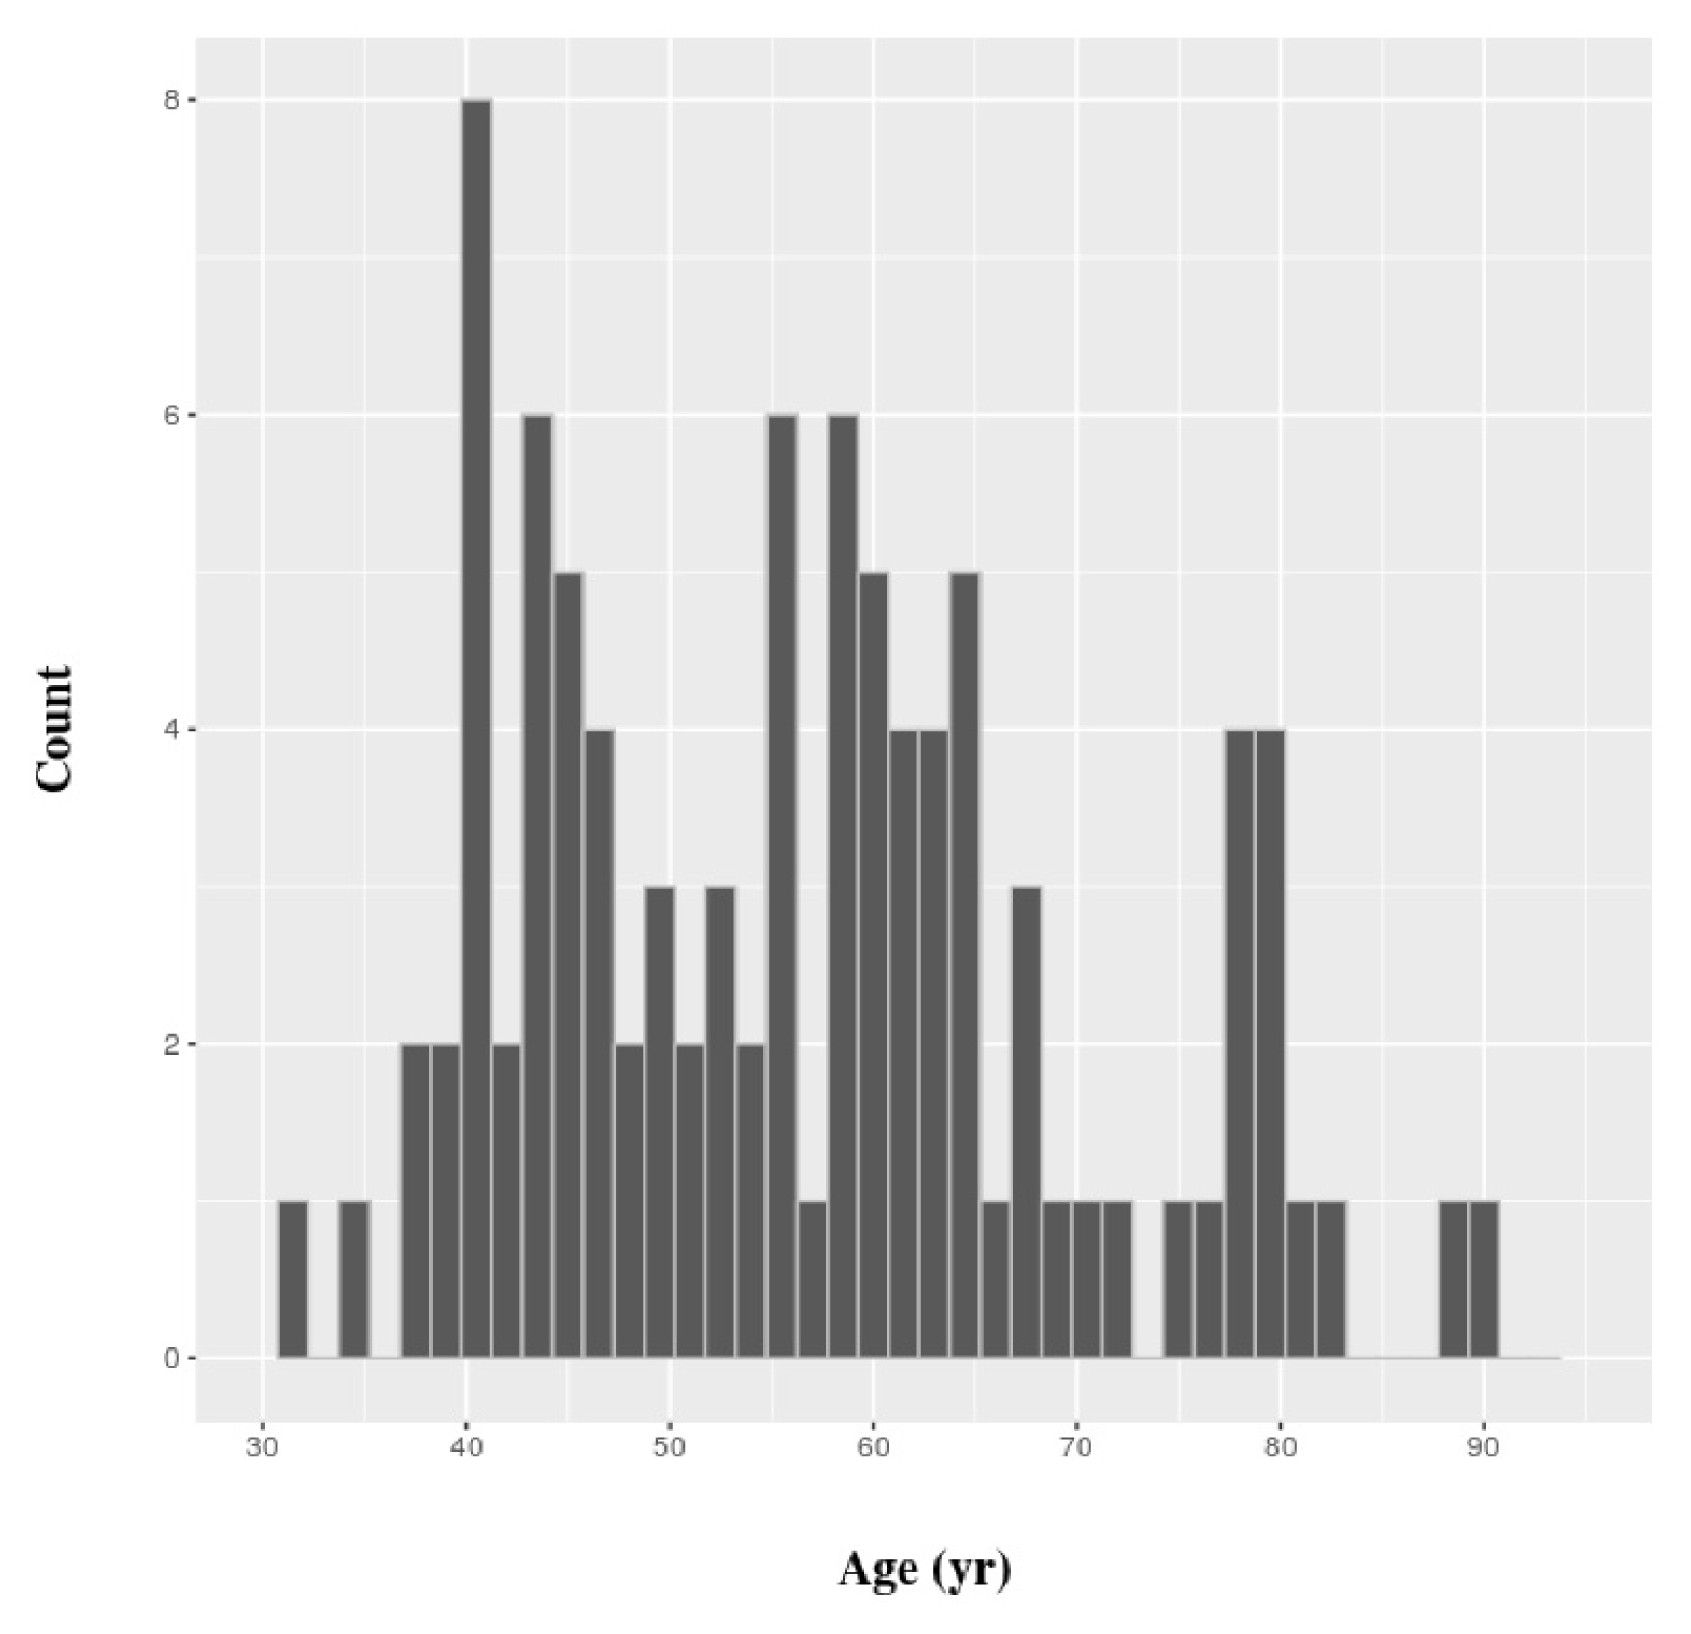
All gene expression values in this work were gathered from TCGA. Eligible patients had complete clinical data and a gene expression dataset of breast cancer cells and matched normal cells. Eventually, we retrieved the gene expression values of tumor and matched normal cells of 96 patients. The distribution of their ages is shown in Fig. 1. The values for gene expression level that we used were generated by the Illumina Hi-Seq platform (Illumina, Inc., San Diego, CA, USA) and normalized by root square error methods [17]. All subsequent statistical analyses were carried out using R, version 3.2.3. SVM classifiers were constructed using the e1071 package of R, and a simple linear kernel was used. Functional enrichment analysis of gene classes was performed in ToppGene Suite [18].
Young patients were defined as ≤45 years of age, and elderly patients were defined as those ≥60 years of age (Fig. 1). The rest of the patients were defined as “intermediate.” The statistical significance of differential expression between tumor and matched normal cells was determined by paired t test, based on a p-value threshold of 8.48 × 10⁻⁷. The threshold value was set based on the Bonferroni correction, because a test was performed for each age group, and three age groups were defined for each of the 19,646 genes.
Results and Discussion
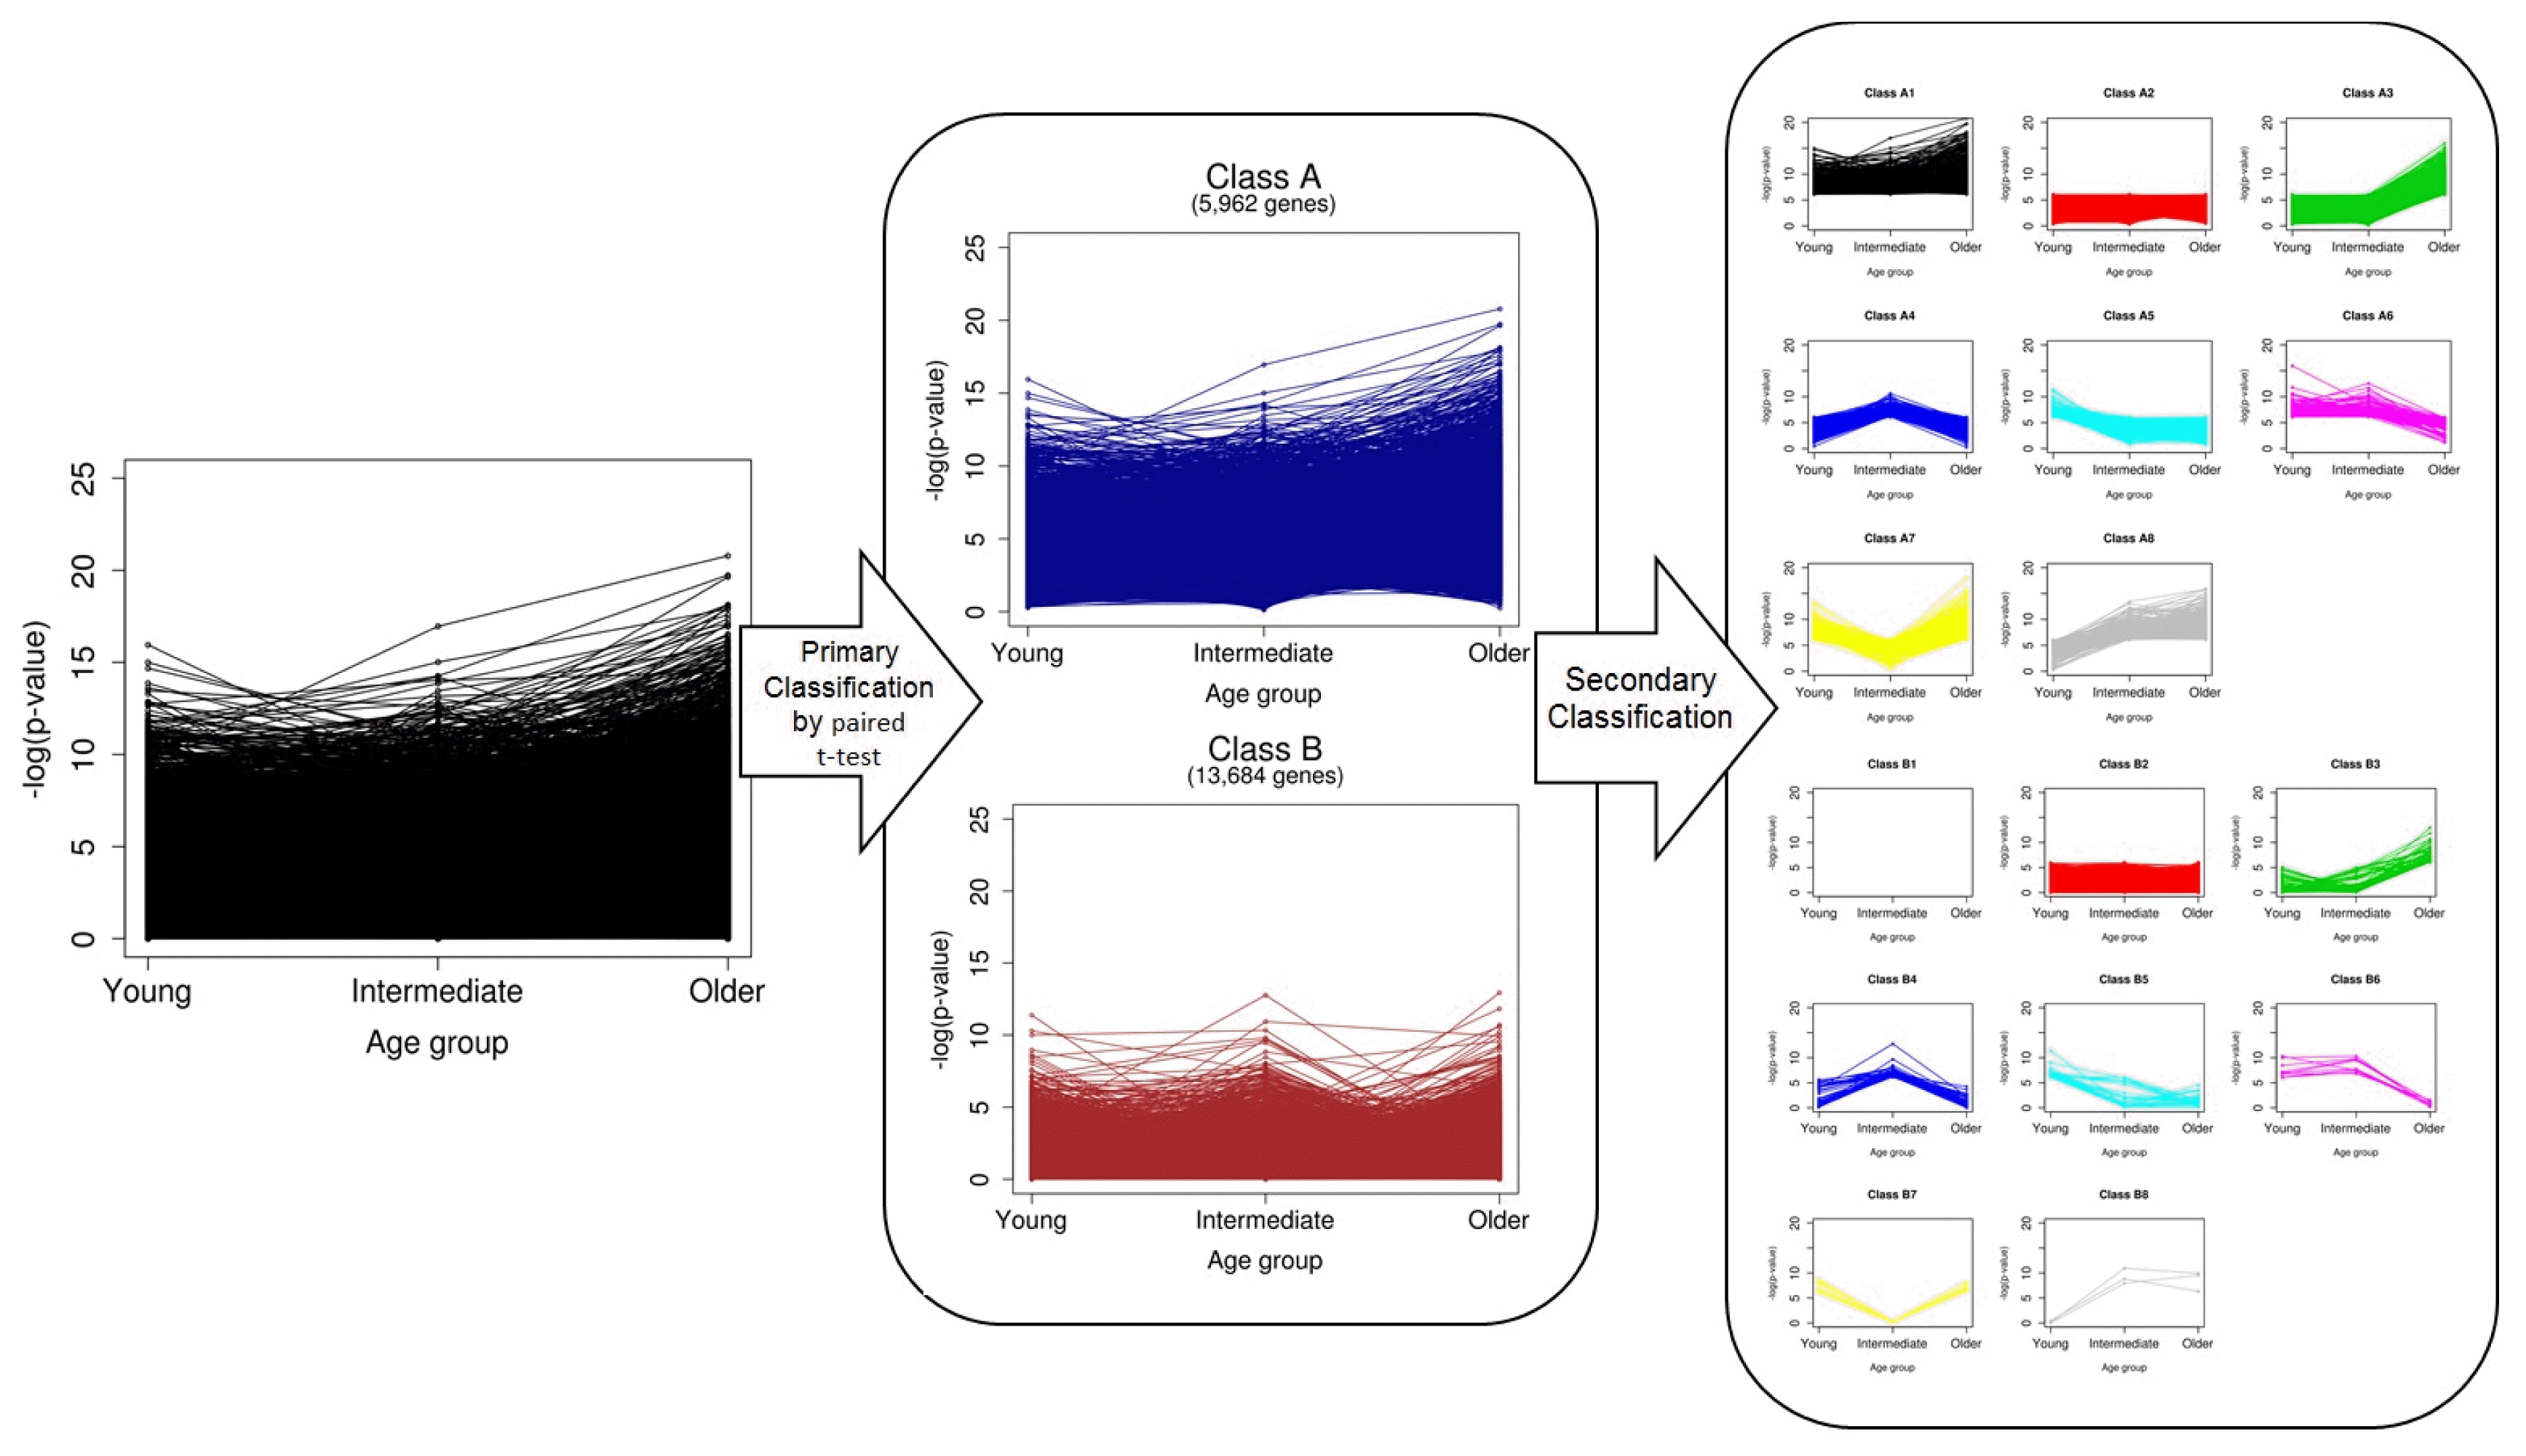
The overall scheme of our classification is depicted in Fig. 2. We first divided genes into two classes (A and B) by paired t test without considering age. A total of 5,962 genes in class A were defined as significant DEGs in breast cancer, and 13,684 in class B were nonsignificant. Ones who want to find biomarkers or driver genes are likely to investigate only genes in class A. However, we classified the genes of each class once again into eight groups, based on the pattern of p-values, which were calculated separately for every age group (secondary classification in Fig. 2). After a second round of classification, the genes were eventually divided into 16 classes (A1–B8) (Supplementary Table 1). The numbers of genes of the classes are shown in Table 1.
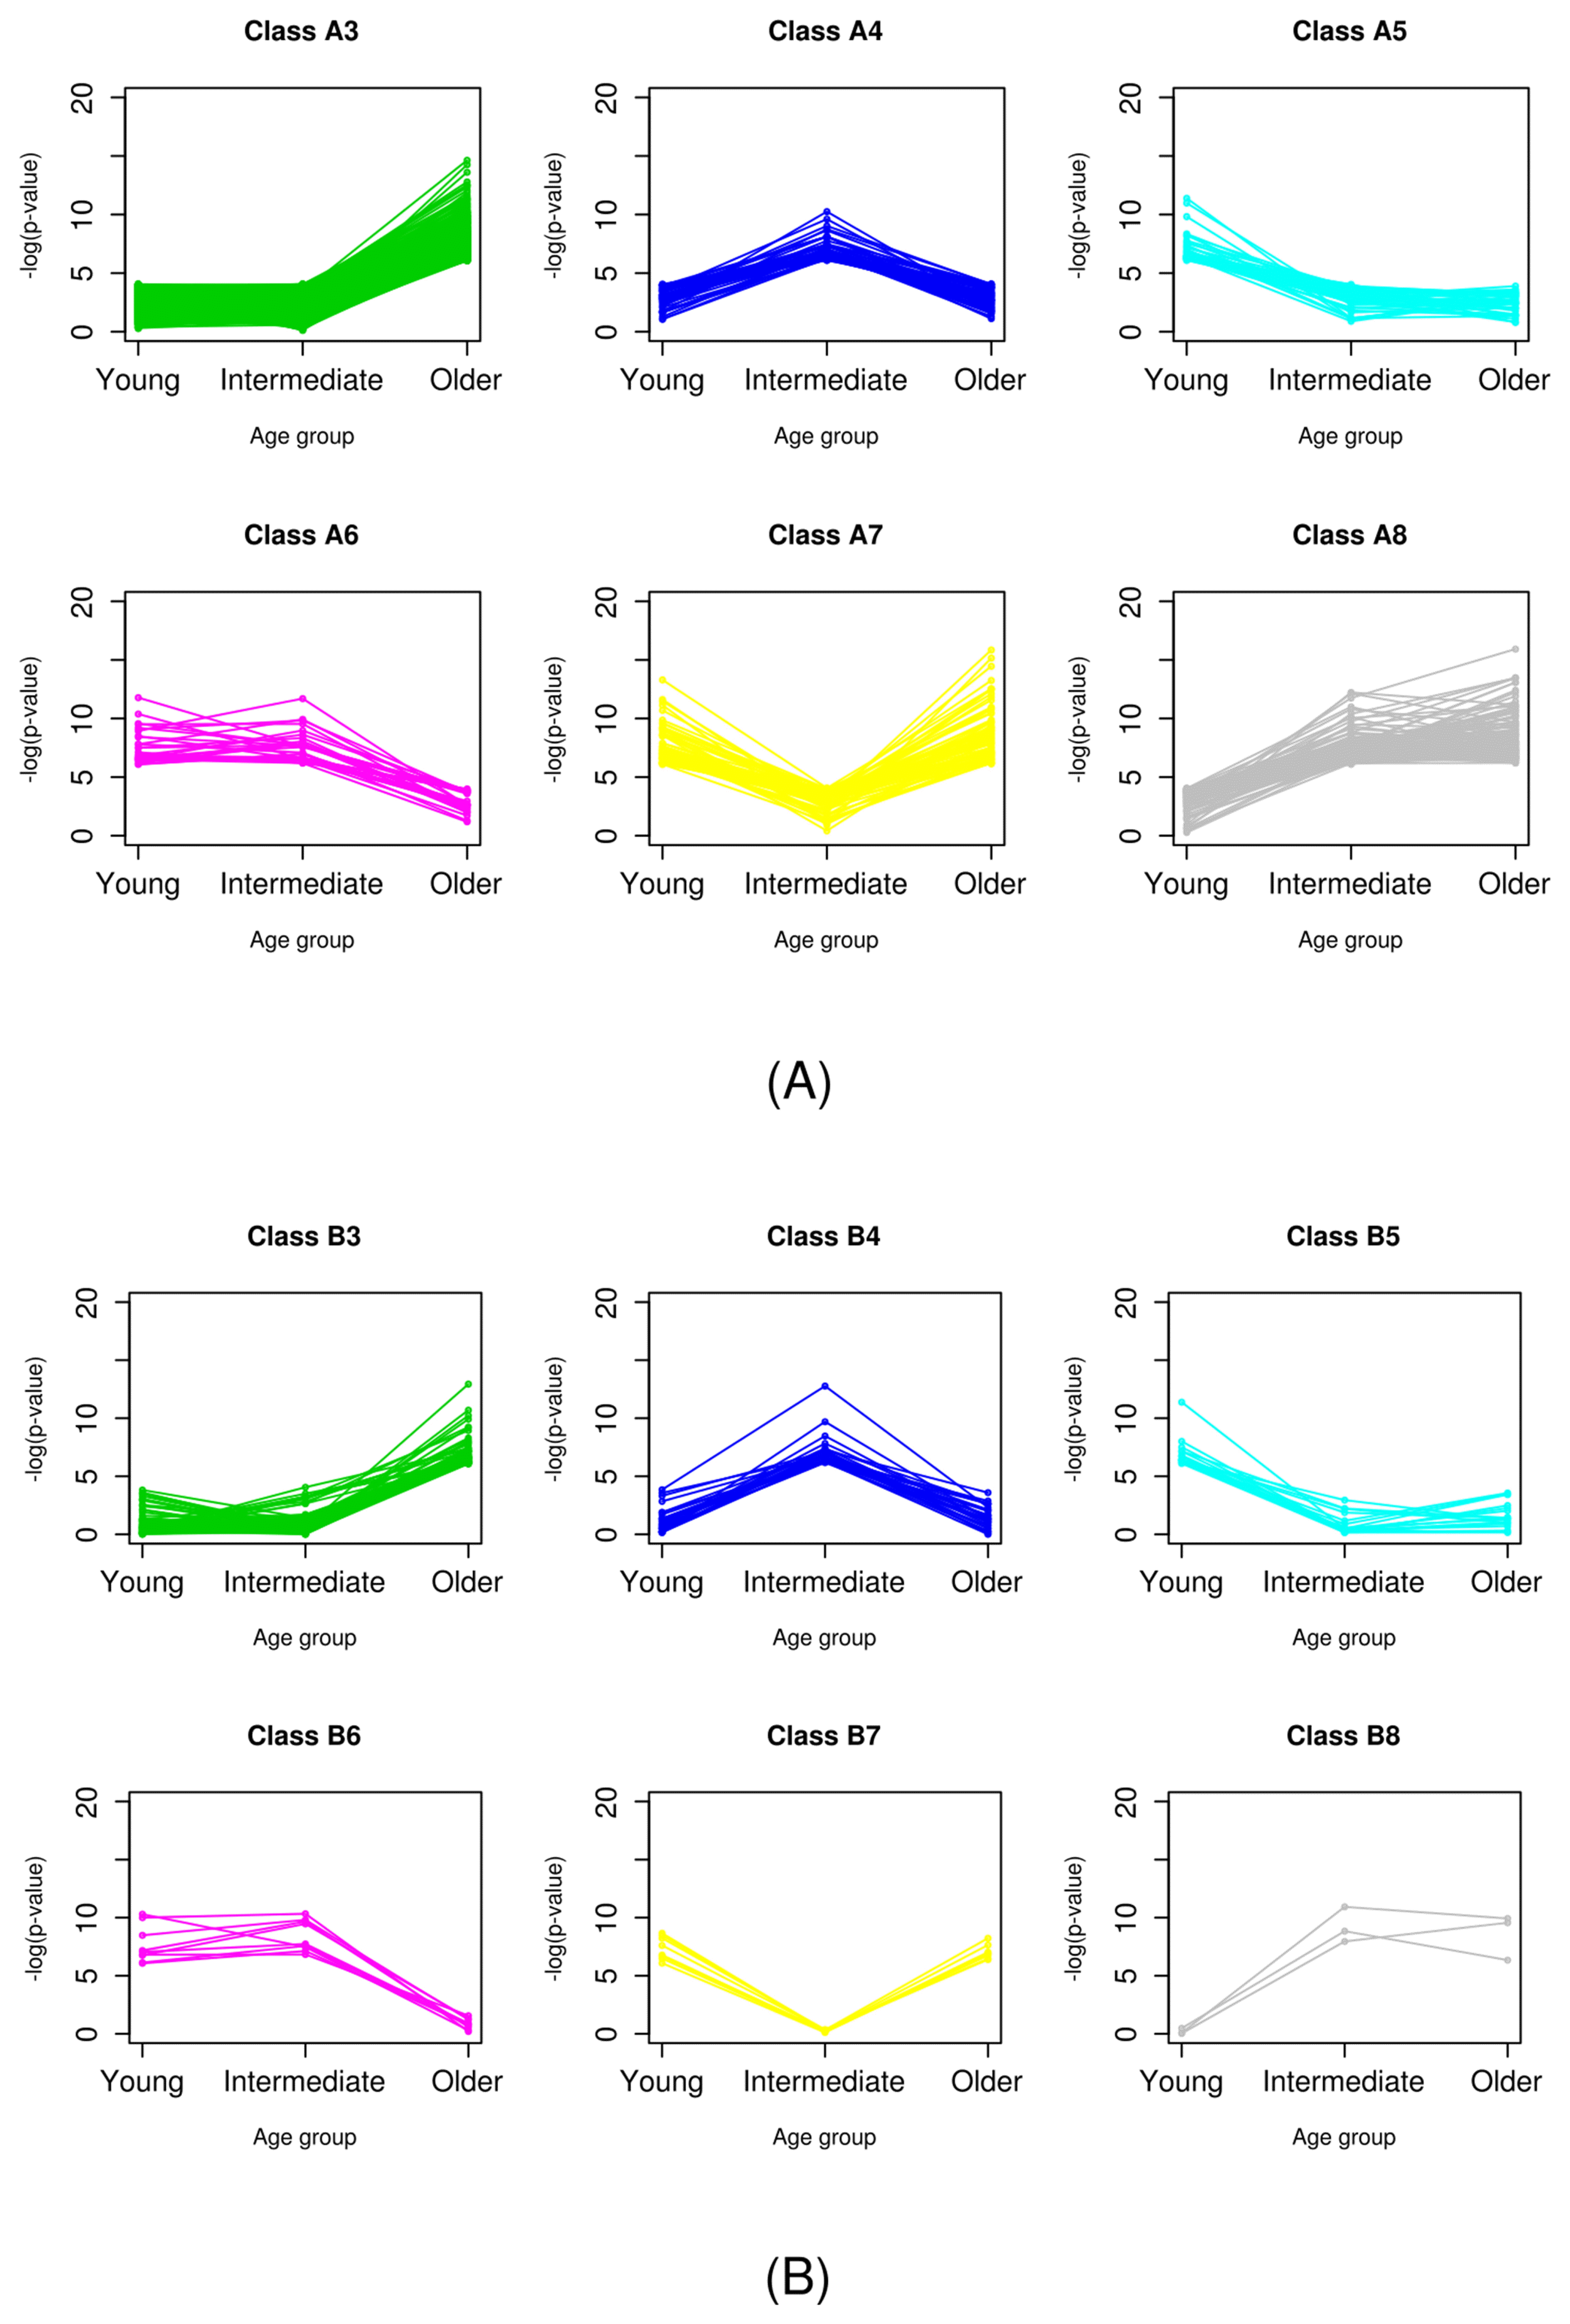
It was easily observed that there was no gene classified as class B1. Probably, this was because the significance of genes in class B was already tested in the primary classification step, and no genes showed significance over all age groups. The 377 genes in class A1 exhibited differential expression for every age group and all samples. These genes are the most powerful DEGs between normal and breast cancer cells. Genes of class 2, which did not have significantly different expression in any age group, accounted for the majority in both classes A and B. Indeed, classes 1 and 2 did not have any age-specific significance. Thus, we focused on the genes of classes 3–8, which showed age-specific differential expression (Fig. 3).
Functional enrichment analysis for each class was performed, but we could not find any relevant or intriguing biological implications or pathways related to breast cancer. Hence, we decided to provide the results of the analysis as raw data (Supplementary Table 2) rather than trying an unfeasible deduction.
To show an example of how the classification can be applied, we constructed prediction models that aimed to distinguish normal and breast cancer cells, using the expression values of various combinations of genes. We defined two types of combinations comprising gene lists. For type I combinations, genes were chosen evenly from each class. By contrast, genes were chosen randomly for type II combinations without considering gene class. For example, if we make a list composed of three genes from classes 3, 4, and 5, the type I combination should consist of a gene from class 3, another from class 4, and the other one from class 5, but a type II combination could be composed of any genes randomly chosen from the pool of the three classes.
We compared the accuracies of the SVM of type I and II combinations for three subsets each for classes A and B (Table 2). The performance of type I was significantly better than that of type II, except in two cases (classes 6–8 in both classes A and B), the genes of which were significantly differentially expressed in the two age groups.
These results highlight the value of gene classification based on our method. Based on the first classification, 13,684 genes in class B were probably considered genes that cannot distinguish normal and breast cancer cells. However, by adapting one more classification step based on age-specific differential expression, we identified 171 age-specific DEGs in classes B3–B8. Despite the underestimated value of the classes, we showed that a balanced selection of genes from these classes could be applied as biomarkers, identifying breast cancer from normal cells. For example, genes that are known to be high-penetrance breast cancer susceptibility genes, such as TP53, STK11, and CDH11, and moderate-penetrance genes, such as RAD50, RAD51C, RAD51D, NBS1, and FANCM, were classified in class B2 [19]. In addition to proposing the possibility of genes in class B as biomarkers, even for class A, we exhibited that our method of selecting biomarker genes based on secondary classification could be useful in making a combination of biomarker genes for a more accurate prediction by using different classes complementarily.
In summary, we retrieved a gene expression dataset of breast cancer and matched normal cells from TCGA and then classified the genes into 16 classes by two-step classification. This classification could be applied to generate a more accurate prediction model for identifying cancer. Furthermore, we expect that our scheme of classification could be used for other types of cancer data.