Genomics Inform Search

CLOSE


Genomics Inform > Volume 10(3); 2012 > Article
Kim, Yoo, Park, Yoo, Kang, Jin, Min, Paek, and Lim: DNA Barcoding of Fish, Insects, and Shellfish in Korea

Abstract

DNA barcoding has been widely used in species identification and biodiversity research. A short fragment of the mitochondrial cytochrome c oxidase subunit I (COI) sequence serves as a DNA bio-barcode. We collected DNA barcodes, based on COI sequences from 156 species (529 sequences) of fish, insects, and shellfish. We present results on phylogenetic relationships to assess biodiversity the in the Korean peninsula. Average GC% contents of the 68 fish species (46.9%), the 59 shellfish species (38.0%), and the 29 insect species (33.2%) are reported. Using the Kimura 2 parameter in all possible pairwise comparisons, the average interspecific distances were compared with the average intraspecific distances in fish (3.22 vs. 0.41), insects (2.06 vs. 0.25), and shellfish (3.58 vs. 0.14). Our results confirm that distance-based DNA barcoding provides sufficient information to identify and delineate fish, insect, and shellfish species by means of all possible pairwise comparisons. These results also confirm that the development of an effective molecular barcode identification system is possible. All DNA barcode sequences collected from our study will be useful for the interpretation of species-level identification and community-level patterns in fish, insects, and shellfish in Korea, although at the species level, the rate of correct identification in a diversified environment might be low.

Introduction

DNA barcoding is a simple and useful step toward understanding the ecosystem. It also serves to further our interests in biodiversity research [1]. A short standardized sequence (400-800 bp) of DNA can be used to distinguish individuals of a species. This approach was taken, because genetic diversity between species is markedly greater than that within species [2]. Numerous computational analysis methods and systems have been introduced for this purpose [3-5]. The use of this system can provide rapid, accurate, cost-effective, and automatable process for species identification. The success rate of each barcoding application varies significantly among groups. Moreover, global datasets that represent extensive ecosystems are expected to be subjected to particular difficulties, especially in groups in which recent speciation rates are high and effective population sizes are large and reasonably stationary [6]. Several studies of species-level identification have covered many groups of organisms, including birds, fishes, and various arthropods [4, 6-8].
In order to use the barcoding system for species identification, cytochrome c oxidase subunit I (COI) sequences were obtained in this study from 529 sequences, representing 156 species from fish, insects, and shellfish in the Korean peninsula.

Methods

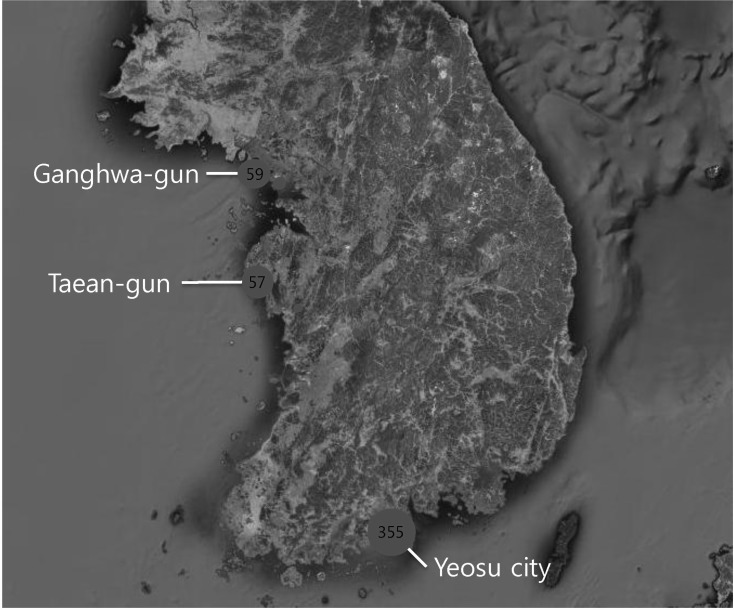
The first community-level barcoding studies were conducted in the most diverse terrestrial and marine ecosystems in an inland and coastal area of South Korea (include reference). We collected samples to obtain an overview of the variation patterns for 529 COI sequences among 68 fish species, 29 insect species, and 59 shellfish species. Multiple specimens were collected for most of the species. Fish and shellfish were collected from Yeosu in Jeollanam-do; shellfish were collected from Taean; and insects were collected from Chungcheongnam-do, Gangwon-do, Gyeongsangbuk-do, and Jeollabuk-do in South Korea. Samples were collected using different, technically appropriate methods (Fig. 1, Supplementary Table 1) [9]. If possible, the samples were obtained from widely distributed places in South Korea.
Genomic DNA was isolated from samples using the Qiagen DNeasy 96 blood and tissue kit (Qiagen, Valencia, CA, USA) according to the instructions. DNA fragments of target genes were amplified by polymerase chain reaction (PCR) with primers for the COI gene (primer sequences: LCO1490 GGTCAACAAATCATAAAGATATTGG and HCO 2198 TAAACTTCAGGGTGACCAAAAAATCA) [10]. PCR amplification was performed using Top-Taq PreMix (2×; CoreBio, Seoul, Korea) under the following conditions: denaturation (1 min at 94℃), annealing at 51℃ for amplification of the COI gene, and extension (2 min at 72℃). PCR products were purified with the Core-One PCR purification kit (CoreBio), and TA cloning was performed using the pGEM-T Easy Vector system (Promega, Madison, WI, USA) by Macrogen Inc. The clones for each marker were sequenced with forward (SP6) and reverse (T7) primers using an ABI 3730XL sequencer (Applied Biosystems, Foster City, CA, USA). The sequences reported in this paper have been deposited in GenBank under accession numbers HM180413-HM180941.
To obtain the species information for each operational taxonomic unit (OTU) in a phylogenetic tree, a BLAST search was performed using the BLASTN program from NCBI [11]. A cutoff value for the BLAST result was established as follows: query coverage > 90% and identity > 75% for COI. The levels of sequence divergence within and between the selected species were investigated using the pairwise Kimura 2 parameter (K2P) distance model [12]. The neighbor-joining tree, with gap positions ignored on a pairwise basis, was constructed using the neighbor-joining (NJ) method with K2P distances in MEGA4 [13]. These distances were hierarchically arranged in accordance with intraspecific and interspecific species differences within each genus. When the sequence dataset consisted of only 2 genera from the same family, an intergeneric comparison within the family was not performed.

Results and Discussion

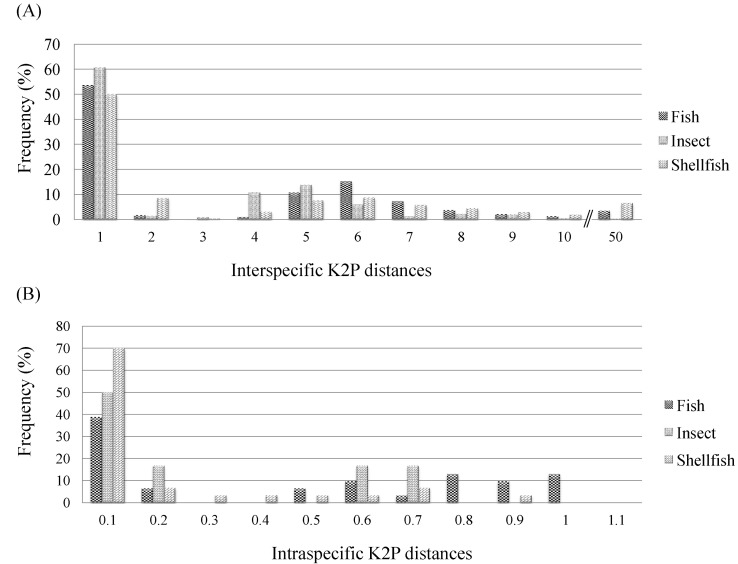
After BLASTN annotation analyses were conducted, K2P distances were compared at different taxonomic levels, revealing distinct features in the sequences both within and between species. With respect to the COI sequences of the 156 species represented, the interspecific K2P distances for the COI sequences from the 68 fish species, the 59 shellfish species, and the 29 insect species ranged from 0% to 45.25% (fish, 0% to 40.99%; insects, 0% to 10.34%; shellfish, 0% to 45.25%) (Fig. 2A), whereas the intraspecific K2P distances with ≥3 sequences ranged from 0% to 0.985% (fish, 0% to 0.985%; insects, 0.005% to 0.635%; shellfish, 0% to 0.817%) (Fig. 2B). The average interspecific distances and average intraspecific distances were, respectively, 3.58 and 0.14 in shellfish, 3.22 and 0.41 in fish, and 2.06 and 0.25 in insects (Table 1). In shellfish, the greatest interspecific K2P differences were 25.57-fold higher than the intraspecific values. The overall base composition in each species of fish, insect, and shellfish was as follows: T (thymine) ranged from 27.4% to 33.7% (highly abundant); G (guanine) ranged from 16.8% to 21.5% (not highly abundant) (Table 1). These findings for fish were consistent with previous studies showing that T occurred more frequently and G occurred less frequently than A (adenine) and C (cytosine) [8].
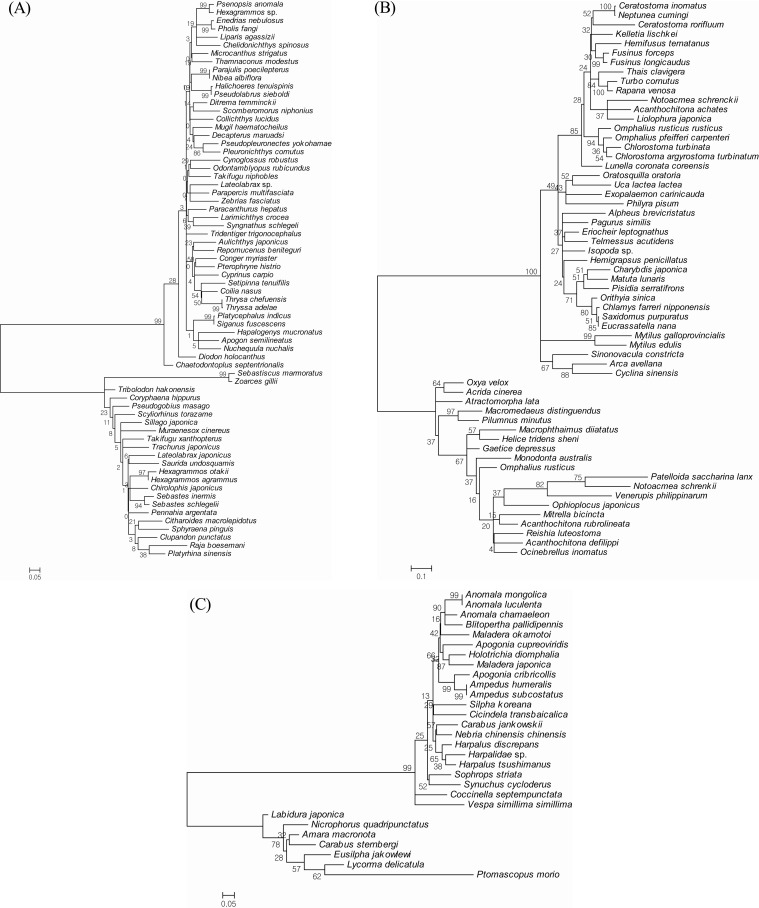
In our polytypic species analysis with more than 3 individuals in each species, the average intraspecific difference was approximately 0.5%, and the maximum intraspecific divergence was only 1.86% (Table 2). The highest overall GC% content was found in the 18 species of fish. Lower values were found in the 2 species of insects and in the 6 species of shellfish (Table 2). The fish Chelidonichthys spinosus had a high GC% content of 50.9%. The mean GC% content of the 18 barcoded fish species was higher than that of the 6 shellfish species (46.9 ± 2.2% vs. 38.0 ± 4.9%) (see also Table 2). Sixteen of the 21 species with GC% content ≥45% were fish, whereas only 1 shellfish species exhibited GC% content ≥45%. The GC% content can be used in a new approach to evaluate animal evolutionary relationships, although the relationship between GC% content and the evolutionary branching date is not very accurate [14]. Moreover, the average divergence of congeneric species pairs was greater than that found for intraspecific differences, but 10 species in 5 genera had interspecific distances below 0.1% (Table 3). These species included Hexagrammos agrammus/H. otakii, Ampedus humeralis/A. subcostatus, Anomala luculenta/A. mongolica, Chlorostoma argyrostoma turbinatum/C. turbinate, and Omphalius rusticus rusticus/O. pfeifferi carpenteri. In addition, the NJ tree exhibited shallow interspecific divergence except at the first deep divergence (Fig. 3). In fish, several clades had a high level of bootstrap support (≥97%) (Fig. 3A). These clades included Thrysa chefuensis and T. adelae, Hexagrammos otakii and H. agrammus. In insects, the clades that had a high level of bootstrap support (≥95%) included Fusinus forceps, F. longicaudus, Mytilus galloprovincialis, and M. edulis. In shellfish, 2 clades separated out with a high level of bootstrap support (≥99%) (Fig. 3B). These clades included Anomala mongolica and A. luculenta, Ampedus humeralis and A. subcostatus (Fig. 3C).
In conclusion, we obtained DNA barcodes using COI sequences from fish, insects, and shellfish. The aims of this research were species identification and contribution to biodiversity research. At the species level, the rate of correct identifications might be low in a diversified environment. However, DNA barcoded sequences can be used for the interpretation of species-level identification and community-level patterns in fish, insects, and shellfish.

Acknowledgments

This work was supported by a Korea Science and Engineering Foundation (KOSEF) grant, funded by the Ministry of Education, Science and Technology of Korea (No. 2012-0006000) in 2012.

Supplementary materials

Species identity and collection information for barcoded fish, insects, and shellfish in Korea. Supplementary data including one table can be found with this article online at http://www.genominfo.org/src/sm/gni-10-206-s001.pdf.
gni-10-206-s001.pdf

References

1. Ward RD, Hanner R, Hebert PD. The campaign to DNA barcode all fishes, FISH-BOL. J Fish Biol 2009;74:329–356. PMID: 20735564.
crossref pmid
2. Kress WJ, Erickson DL. DNA barcodes: genes, genomics, and bioinformatics. Proc Natl Acad Sci U S A 2008;105:2761–2762. PMID: 18287050.
crossref pmid pmc
3. Chu KH, Xu M, Li CP. Rapid DNA barcoding analysis of large datasets using the composition vector method. BMC Bioinformatics 2009;10(Suppl 14):S8. PMID: 19900304.
crossref
4. Hebert PD, Cywinska A, Ball SL, deWaard JR. Biological identifications through DNA barcodes. Proc Biol Sci 2003;270:313–321. PMID: 12614582.
crossref pmid pmc
5. Singer GA, Hajibabaei M. iBarcode.org: web-based molecular biodiversity analysis. BMC Bioinformatics 2009;10(Suppl 6):S14. PMID: 19534739.
crossref
6. Elias M, Hill RI, Willmott KR, Dasmahapatra KK, Brower AV, Mallet J, et al. Limited performance of DNA barcoding in a diverse community of tropical butterflies. Proc Biol Sci 2007;274:2881–2889. PMID: 17785265.
crossref pmid pmc
7. Hajibabaei M, Janzen DH, Burns JM, Hallwachs W, Hebert PD. DNA barcodes distinguish species of tropical Lepidoptera. Proc Natl Acad Sci U S A 2006;103:968–971. PMID: 16418261.
crossref pmid pmc
8. Ward RD, Zemlak TS, Innes BH, Last PR, Hebert PD. DNA barcoding Australia's fish species. Philos Trans R Soc Lond B Biol Sci 2005;360:1847–1857. PMID: 16214743.
crossref pmid pmc
9. Goole maps. 2012. Accessed 2012 Jul 16. Seoul: Google, Available from: http://maps.google.co.kr.

10. Folmer O, Black M, Hoeh W, Lutz R, Vrijenhoek R. DNA primers for amplification of mitochondrial cytochrome c oxidase subunit I from diverse metazoan invertebrates. Mol Mar Biol Biotechnol 1994;3:294–299. PMID: 7881515.
pmid
11. McGinnis S, Madden TL. BLAST: at the core of a powerful and diverse set of sequence analysis tools. Nucleic Acids Res 2004;32:W20–W25. PMID: 15215342.
crossref pmid pmc
12. Kimura M. A simple method for estimating evolutionary rates of base substitutions through comparative studies of nucleotide sequences. J Mol Evol 1980;16:111–120. PMID: 7463489.
crossref pmid
13. Tamura K, Dudley J, Nei M, Kumar S. MEGA4: Molecular Evolutionary Genetics Analysis (MEGA) software version 4.0. Mol Biol Evol 2007;24:1596–1599. PMID: 17488738.
crossref pmid
14. Du H, Hu H, Meng Y, Zheng W, Ling F, Wang J, et al. The correlation coefficient of GC content of the genome-wide genes is positively correlated with animal evolutionary relationships. FEBS Lett 2010;584:3990–3994. PMID: 20691688.
crossref pmid
Fig. 1
Map showing the locations of the cruises and the materials collected in this study. Each circle represents one sampling locality, and circle size is proportional to the number of samples in our study. Google Map was used (http://maps.google.co.kr) [9].
gni-10-206-g001.jpg
Fig. 2
Distribution of interspecific Kimura 2 parameter (K2P) distances for cytochrome c oxidase subunit I (COI) sequences from the 68 fish species, the 59 shellfish species, and the 29 insect species. Vertical lines show the mean pairwise distance at each level. The X- and Y-axes represent K2P distance values and the percentage of individuals, respectively. (A) Interspecific K2P distances. (B) Intraspecific K2P distances.
gni-10-206-g002.jpg
Fig. 3
The neighbor-joining tree of fish, insects, and shellfish based on cytochrome c oxidase subunit I (COI) sequences. (A) Fish. (B) Insects. (C) Shellfish.
gni-10-206-g003.jpg
Table 1.
Mean percentage base composition, comparing COI sequences and K2P distance among fish, insects, and shellfish
Group No. of species Mean of K2P distance
Base (%)
Interspecies Intraspecies A C G T
Fish 68 3.215 0.41 25.9 ± 0.444 25.3 ± 0.588 21.5 ± 0.613 27.4 ± 0.525
Insects 29 2.063 0.25 31.1 ± 0.625 18.6 ± 0.542 16.8 ± 0.348 33.5 ± 0.757
Shellfish 59 3.577 0.14 29.2 ± 0.743 18.7 ± 0.370 18.4 ± 0.340 33.7 ± 0.856

When multiple individuals were collected for any one species, a single sequence was selected at random. COI, cytochrome c oxidase subunit I; K2P, Kimura 2 parameter.

Table 2.
Maximum intraspecific distance and GC% content among fish, insects, and shellfish (threshold > 0.5%)
Category Species Maximum intraspecific distance No. of intraspecies GC content (%)
Fish Parajulis poecilepterus 1.862 16 46.4
Chelidonichthys spinosus 1.553 5 50.9
Sebastes inermis 1.521 22 46.5
Enedrias nebulosus 1.399 5 47.5
Chirolophis japonicus 1.387 3 46.9
Raja boesemani 1.370 5 46.9
Muraenesox cinereus 1.324 3 44.7
Takifugu niphobles 1.309 14 47.2
Collichthys lucidus 1.291 6 47.8
Sebastiscus marmoratus 1.291 3 47.8
Scyliorhinus torazame 1.288 3 47
Takifugu xanthopterus 1.256 9 47.6
Pholis fangi 1.232 5 47.4
Nuchequula nuchalis 1.163 3 45.6
Pseudogobius masago 1.131 3 39.8
Sillago japonica 1.064 7 47.2
Hexagrammos otakii 0.998 10 48.2
Hexagrammos agrammus 0.923 7 48.2
Insects Lycorma delicatula 0.953 3 34.1
Amara macronota 0.896 3 32.3
Shellfish Gaetice depressus 1.394 5 35.8
Patelloida saccharina lanx 1.359 9 47.3
Reishia luteostoma 1.225 10 38.5
Oratosquilla oratoria 1.145 7 34.8
Mitrella bicincta 1.141 10 33.7
Saxidomus purpuratus 0.525 3 37.9
Table 3.
Maximum Kimura 2 parameter (K2P) distances with congeneric species pairs
Category Species pairs Maximum K2P distances
Fish Hexagrammos agrammus/Hexagrammos otakii 0.047
Hexagrammos otakii/Hexagrammos sp. 1.389
Hexagrammos sp./Hexagrammos agrammus 0.952
Sebastes inermis/Sebastes schlegelii 1.631
Insects Ampedus humeralis/Ampedus subcostatus 0
Anomala chamaeleon/Anomala luculenta 0.124
Anomala luculenta/Anomala mongolica 0
Anomala mongolica/Anomala chamaeleon 0.124
Apogonia cribricollis/Apogonia cupreoviridis 0.280
Carabus jankowskii/Carabus sternbergi 1.005
Harpalus discrepans/Harpalus tsushimanus 0.113
Maladera japonica/Maladera okamotoi 0.222
Shellfish Acanthochitona achates/Acanthochitona defilippi 1.231
Acanthochitona defilippi/Acanthochitona rubrolineata 0.251
Acanthochitona rubrolineata/Acanthochitona achates 1.693
Ceratostoma inornatus/Ceratostoma rorifluum 0.195
Chlorostoma argyrostoma turbinatum/Chlorostoma turbinata 0.002
Mytilus edulis/Mytilus galloprovincialis 0.201
Notoacmea schrenckii/Notoacmea schrenkii 1.299
Omphalius pfeifferi carpenteri/Omphalius rusticus 1.089
Omphalius rusticus/Omphalius rusticus rusticus 1.031
Omphalius rusticus rusticus/Omphalius pfeifferi carpenteri 0.050
TOOLS
Share :
Facebook Twitter Linked In Google+
METRICS Graph View
  • 35 Crossref
  •    
  • 6,417 View
  • 103 Download
Related articles in GNI


ABOUT
ARTICLE CATEGORY

Browse all articles >

BROWSE ARTICLES
FOR CONTRIBUTORS
Editorial Office
Room No. 806, 193 Mallijae-ro, Jung-gu, Seoul 04501, Korea
Tel: +82-2-558-9394    Fax: +82-2-558-9434    E-mail: kogo3@kogo.or.kr                

Copyright © 2024 by Korea Genome Organization.

Developed in M2PI

Close layer
prev next