The Usage of an SNP-SNP Relationship Matrix for Best Linear Unbiased Prediction (BLUP) Analysis Using a Community-Based Cohort Study
Article information
Abstract
Best linear unbiased prediction (BLUP) has been used to estimate the fixed effects and random effects of complex traits. Traditionally, genomic relationship matrix-based (GRM) and random marker-based BLUP analyses are prevalent to estimate the genetic values of complex traits. We used three methods: GRM-based prediction (G-BLUP), random marker-based prediction using an identity matrix (so-called single-nucleotide polymorphism [SNP]-BLUP), and SNP-SNP variance-covariance matrix (so-called SNP-GBLUP). We used 35,675 SNPs and R package "rrBLUP" for the BLUP analysis. The SNP-SNP relationship matrix was calculated using the GRM and Sherman-Morrison-Woodbury lemma. The SNP-GBLUP result was very similar to G-BLUP in the prediction of genetic values. However, there were many discrepancies between SNP-BLUP and the other two BLUPs. SNP-GBLUP has the merit to be able to predict genetic values through SNP effects.
Introduction
Many important human traits are moderately to highly heritable [1]. Yang et al. [2] found that roughly 45% of the genetic variance of human height can be explained by the regression on common single-nucleotide polymorphisms (SNPs). So-called dark matter of the genome in human height complex traits, especially, can be explained by the existence of gene-by-gene or gene-by-environment interactions [3,4,5]. Although the causal variants are not in complete linkage disequilibrium (LD) with the SNPs and although SNP-SNP interaction effects do exist, the traditional independent and identically distributed (IID) assumption has been used for so-called SNP-best linear unbiased predictor (SNP-BLUP). We calculated an SNP-SNP relationship matrix from a genomic relationship matrix (GRM) for best linear unbiased prediction (BLUP) analysis. This usage is called SNP-genomic linear unbiased prediction (SNP-GBLUP). The prediction of SNP effects is the best feature of this BLUP. This fact can help BLUP scientists predict the genetic values of other sample groups. Also, through the SNP-SNP relationship matrix, scientists can view the SNP-SNP interaction via the covariance terms of that matrix.
We used the BLUP to estimate the numerical values of genetic factors that reside in an individual's DNA information. The expression of diverse and complicated genetic factors can lead to phenotypic quantitative values, and the genetic factors can translate into numerical values. SNPs can be the representatives of genetic factors. Therefore, the invisible but real SNP effects can be translated into numerical values.
BLUP, including best linear unbiased estimation (BLUE), is a standard method for predicting the random effects and fixed effects of a mixed model [6]. In general, random effects can be SNP effects, and fixed effects can be factors, such as sex. This method was originally designed in the field of animal breeding for estimating breeding values but is now applicable to many areas of research [6]. In particular, the advent of DNA sequencing technology has made it possible for the application of the BLUP-BLUE mixed model to predict SNP effects. The BLUP method, originally developed by Henderson, which is now applicable to animals, plants, and humans, uses statistical regression and exploits fixed effects as well as random effects. It is a general model that is able to find polygenic effects. In fact, polygenic effects are the replacement of quantitative trait loci (QTL) effects or randomly distributed genomewide effects. The mixed linear model, including BLUP and BLUE, is in the form:
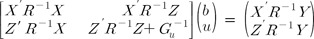
Here, Gu-1 is the inverse matrix of the variance-covariance matrix of random effects, which indicates the SNP-SNP variance-covariance matrix. The GRM, G, can be calculated using R package "rrBLUP." For the feasible and precise prediction of the breeding value of organisms, genome-wide studies are quickly becoming mainstream. SNP information can show us the precise and broad application of BLUP, because it is widely applicable, and hundreds of thousands of genetic markers (SNPs) can be tested for association with a phenotype [7].
We used three methods: GRM-based BLUP (G-BLUP), SNP-BLUP, and SNP-GBLUP. G-BLUP is a GRM-based method. SNP-BLUP is assumed to be IID between SNPs [8, 9]. SNP-GBLUP exploits the SNP-SNP relationship matrix. We found out the calculation method of the SNP-SNP variance covariance matrix using the GRM G [9, 10, 11]. The tabular method, to calculate the Gu matrix, developed by Fernando and Grossman [12], uses the IBD concept, which is complicated and vulnerable to incorrect calculations in organisms. There is no R package available in Gu matrix calculation (http://www.r-project.org). However, the G matrix can be calculated from R codes [12, 13]. We proposed a simple method for calculating the Gu matrix from the G matrix. The SNP-SNP relationship matrix means the variance-covariance matrix between SNPs.
Height in humans is a classical quantitative trait, is easy to measure, and has high heritability. The heritability of height has been estimated to be ~0.8 [14, 15, 16, 17, 18]. We analyzed human height using the BLUP method. There were 997 individuals and 35,675 total SNPs in the analysis. Despite the use of many SNPs, we did not achieve satisfactory heritability results (about 30% of 0.8 total heritability). However, it was consistent with the results, which showed that 45% of height variance can be explained by considering all SNPs simultaneously.
Methods
Data preparation
We used the Ansan-Anseong cohort dataset in Korea. This dataset was established for a Korean chronic diseases study, with Ansan and Anseong representing urban and rural areas of Korea, respectively. The subjects were men between 40-69 years of age who had been residents of the region for at least 6 months. The basic survey was conducted from 2000 to 2001, and our study was based on the 3rd Ansan-Anseong cohort dataset version 2.1. We chose height as the phenotypic data and sex as a fixed effect. The SNPs of the cohort dataset were implemented using Affymetrix Genome-wide Human SNP Array 5.0 (Affymetrix, Santa Clara, CA, USA). The mean call rate was 99.01%, and the genetic analysis result, proved by SNPstream UHT 12 plex, was 99.934%. The total number of genotyped SNPs was 352,228, and they were filtered using the conditions of minor allele frequency (MAF; <0.01), Hardy-Weinberg equilibrium (<0.0001), and missing genotyping (missing >0.2). The SNPs were pruned using PLINK (http://pngu.mgh.harvard.edu/~purcell/plink), leaving 35,675 SNPs for the analysis of human height; 997 individuals were involved in the analysis.
The GRM was calculated by using R package "rrBLUP" with the option "Expectation-Maximization (EM) algorithm." Then, using the restricted maximum likelihood method (REML) of the same packages, we calculated the SNP effects, genetic values, error variance, and genetic value variance. The EM imputation algorithm was used for the GRM, because we dealt with high-density SNPs. The REML method is used in a rather small size sample instead of the ML method.
The method of statistical SNP-SNP variance-covariance matrix calculation
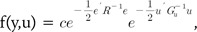
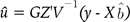
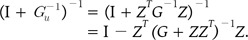
From the regression Eq. (1), Henderson [19] used the ML method to derive the BLUP equation, which is in the form:
Then, we used Zu as the independent variable instead of u, which denotes the breeding value or genetic value Zu for the derivation of BLUP. We assumed the normality condition of the genetic value Zu and random effect u. Based on these assumptions, the variance-covariance matrix of genetic values, Zu, is the GRM, G.
From Eqs. (3) and (4),
 (5)
(5)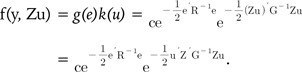 (6)
(6)Eqs. (5) and (6) represent the probability density function (pdf) of the BLUP model (Eq. 1). Eqs. (5) and (6) are equivalent, and we can easily know that Gu-1 = ZTG-1Z. This important relationship links the SNP-SNP variance covariance matrix Gu to the GRM G.
The generalized least squares for the BLUP
We used the "rrBLUP" package for calculating the G matrix and predicting the genetic values of men's height complex traits. "rrBLUP" uses a practically generalized least squares (GLS) solution for the BLUP. For the G-BLUP, we used the G matrix, which was calculated from the R "rrBLUP" package using information on 35,675 SNPs. For the random effects estimation, such as SNP effects, we used two methods. One was SNP-BLUP, which is assumed to be IID between SNPs, and the other was SNP-GBLUP, which uses the statistical SNP-SNP variance covariance matrix. We will call this the SNP-SNP relationship matrix.
 (7)
(7) (8)
(8)The Sherman-Morrison-Woodbury lemma
From the relationship Gu-1 = ZTG-1Z, we should calculate the inverse matrix of the Gu-1 matrix. Because a lot of time was needed for calculating the inverse matrix directly, we used the Sherman-Morrison-Woodbury (SMW) lemma [20, 21, 22, 23]. The formula was as follows:
 (10)
(10)Calculating the SNP-SNP relationship matrix Gu using the lemma was faster than the direct calculation, because we used larger SNPs than the sample size.
Results
Genetic value prediction and SNP-GBLUP
The result of the genetic value prediction is shown in Fig. 1 (Fig. 1A, G-BLUP; Fig. 1B, SNP-BLUP; Fig. 1C, SNP-GBLUP). These results show the genetic value variances are nearly identical between G-BLUP and SNP-GBLUP. However, SNP-BLUP is very disparate from the other two BLUPs. Fig. 2 shows the histogram of SNP random effects (Fig. 2A, SNP-BLUP; Fig. 2B, SNP-GBLUP). Both cases indicate that the SNP effects in both BLUPs are distributed normally and that they suit the normal assumption of SNP effects. However, the result of the genetic values was very different in both cases, as shown in Fig. 3 and Supplementary Table 1. Supplementary Table 1 shows the height phenotype and the genetic value prediction of the three BLUPs. G-BLUP and SNP-GBLUP showed identical results. The estimated residual error variance was 21.39 in the three BLUP cases. The fixed effect was 166.6 (men) and 153.3 (women) in both G-BLUP and SNP-GBLUP and 167.4 (men) and 154.1 (women) in SNP-BLUP.
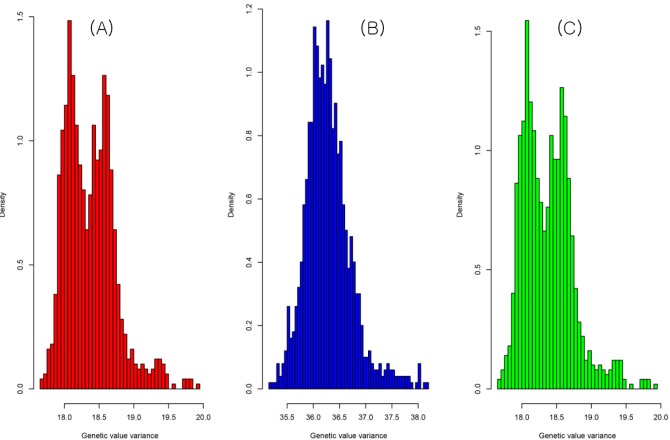
The histogram of genetic value variances of G-BLUP (A), SNP-BLUP (B), and SNP-GBLUP (C). The shapes of the histograms of G-BLUP and SNP-GBLUP were nearly identical. However, the shape of the histogram of SNP-BLUP was disparate from the other two BLUPs. G-BLUP, genomic relationship matrix-based best linear unbiased prediction; SNP-BLUP, single nuleotide polymorphism (SNP)-best linear unbiased predictor; SNP-GBLUP, SNP-genomic linear unbiased prediction.
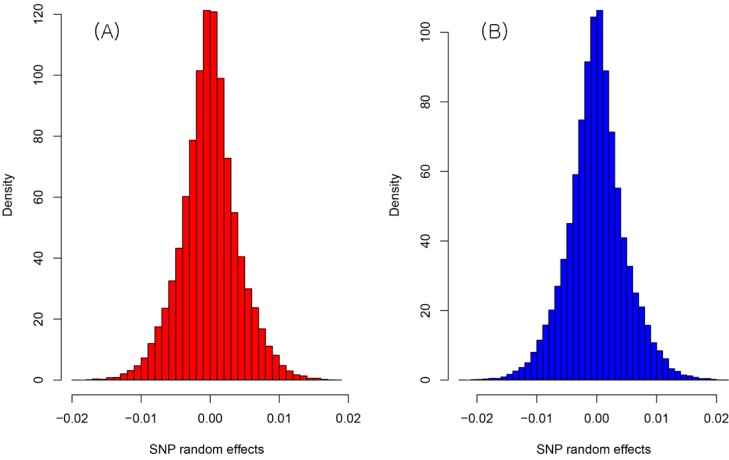
The histogram of the SNP effects of SNP-BLUP (A) and SNP-GBLUP (B). They were approximately distributed normally. However, the predicted genetic values were very dissimilar. SNP-BLUP, single nuleotide polymorphism (SNP)-best linear unbiased predictor; SNP-GBLUP, SNP-genomic linear unbiased prediction.
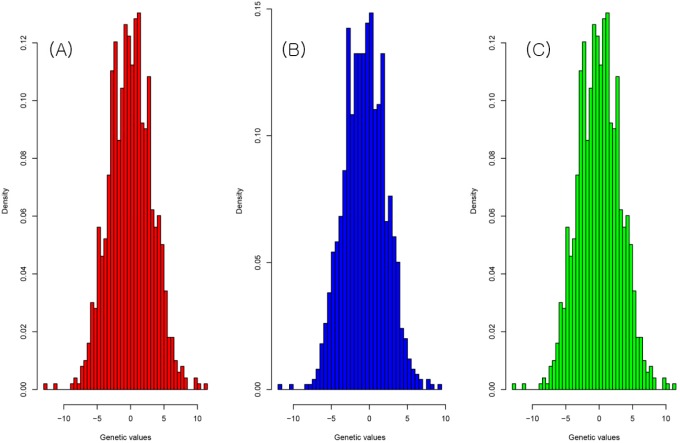
The histogram of the genetic values of G-BLUP (A), SNP-BLUP (B), and SNP-GBLUP (C). The genetic value distribution was similar to the normal distribution. G-BLUP, genomic relationship matrix-based best linear unbiased prediction; SNP-BLUP, single nuleotide polymorphism (SNP)-best linear unbiased predictor; SNP-GBLUP, SNP-genomic linear unbiased prediction.
SNP-SNP relationship matrix
Supplementary Table 2 shows the calculated 1-8th SNP components of the Gu square matrix obtained using the SMW lemma. The variance components (diagonal parts) were the values close to 1. It suggests that the Gu matrix can be interpreted as the SNP-SNP relationship matrix. The covariance components can be interpreted as the SNP-SNP relationships or, in other words, SNP-SNP interaction terms, because the variance components represent the SNPs' relationships themselves.
Estimated heritability
We estimated the narrow-sense heritability (h2) using simple regression between the genetic values and the height phenotypic values. The heritability was 0.24 in G-BLUP and SNP-GBLUP and 0.20 in SNP-BLUP. According to Yang et al.'s article [2], only 45% of variance can be explained by total SNPs. Therefore, our estimated heritability was not poor, and of the generally accepted narrow-sense heritability of 0.8, we explained 33% in G-BLUP and SNP-GBLUP. We explained 53% of the heritability when using total SNPs. Also, we found the method that is widely applicable, SNP-GBLUP, because it can predict the SNP effects. It is impossible in G-BLUP, and Gu matrix components can be used widely, such as in genome-wide association studies (GWASs), because they can be interpreted as representing the interaction terms between SNPs.
Discussion
SNP-GBLUP and its applicability
The G-BLUP uses the GRM. This matrix contains the information between individuals. However, SNP-BLUP and SNP-GBLUP use the direct information between SNPs. SNP-BLUP is assumed to be IID between SNPs. This IID assumption is good but not accurate, because it ignores the interaction terms between SNPs. Instead, SNP-GBLUP uses the covariance structures directly. This BLUP is more proximal to actuality than SNP-BLUP.
The covariance terms of the SNP-SNP relationship matrix can be used as interaction terms in phenotype-related analysis. It can provide the scientist with clues for SNP-SNP interactions. The covariance terms of it are independent of the phenotypic values, because they came from the Z matrix and GRM. However, after proper constant multiplication, as in BLUP, they may be interpreted as interaction terms between SNPs.
Probably, the SNP effects through SNP-GBLUP rather than SNP-BLUP can be used in Bayesian BLUP. Bayesian BLUP excludes the low or zero effects of SNPs. The accurately calculated SNP effects through SNP-GBLUP can be classified into low-effect SNPs and high-effect SNPs as absolute values. Low-effect SNPs can be excluded, and Bayesian BLUP can exploit only high-effect SNPs [24, 25, 26].
Heritability and the GLS approach in BLUP
Narrow-sense heritability (h2) reflects the additive effects of QTL. The estimated heritability from our data was smaller than the generally accepted heritability. This is because causal variants were not in complete LD with the SNPs that were genotyped. Incomplete LD might occur if causal variants have a lower MAF than genotyped. The effects of the SNPs are treated statistically as random, and the SNPs have a small effect on the trait [2]. However, we achieved better heritability than the predicted value in common GWASs-i.e., only ~5% of the phenotypic variance in human height [27].
The present studies aim at predicting genetic values using the covariance structures between SNPs via GRM [28]. The numerator relationship matrix can be replaced by a genome-based GRM [29]. This G-BLUP, using GRM, uses information of SNPs [30]. We used three methods-particularly, the method of normal distribution-based SNP-SNP covariance structures. These structures were constructed using GRM and the Z design matrix. Algorithmically, the calculation of GRM uses the frequency of genotyped SNPs and the Z matrix. Also, in the previous study, the SNP-SNP covariance structures assumed that the identity matrix was multiplied by proper constants. However, we calculated the SNP-SNP relationship matrix using GRM and the Z matrix. This square matrix contains the information of relations between SNPs and can make it possible to estimate the SNP effects. Also, adequate use of the SMW lemma could make it plausible to estimate the SNP effects and genetic values simultaneously with faster computation time [21]. We expect that SNP-SNP covariance structures can make it feasible for calculating the genetic values and SNP effects that are linked to the QTL more accurately.
Genetic value estimation combines the performance and kinship information, which is based on a known pedigree [31]. The accuracy of genomic prediction depends on many factors, such as the genetic architecture of the trait and the population, the methodology of estimating the SNP effects, the distribution of the markers, and the degree of LD [32]. These can be important for accurate BLUP analysis, and there can be two approaches for solving BLUP. The GLS approach and Henderson's ML-based approach lead to identical solutions. The "rrBLUP" package uses the GLS approach. In that package, when the GRM is calculated, the imputation uses the mean method or EM algorithm. Especially, the EM algorithm can be used for haplotype inferences with SNPs. The EM algorithm is the most popular statistical algorithm because of its interpretability and stability. This algorithm is a deterministic procedure, consumes less computation time, and is easier for convergence checks [33]. The REML method is used in BLUP analysis with a small sample size. The use of REML for variance component estimation avoids the small sample bias associated with fixed effects and seems to avoid selection bias. Henderson [34] asserted the use of REML in BLUP models [35, 36]. Thus, we used the EM algorithm and REML method schemes.
Acknowledgments
We thank Dong-Hyun Shin and Min-Su Park for their help and Professor Hee-Seok Oh for helpful advice. The work was supported by the Project (PJ009260) of the National Livestock Institute of the Rural Development Administration, Republic of Korea. And this research was supported by the Bio & Medical Technology Development Program of the National Research Foundation (NRF) funded by the Ministry of Science, ICT & Future Planning (M3A9D1054622). We are also grateful to the provider of the KARE3 Ansan-Ansung cohort data.
References
Supplementary materials
Supplementary data including two tables can be found with this article at http://www.genominfo.org/src/sm/gni-12-254-s001.pdf.
Supplementary Table 1
This table shows the predicted genetic values of the 1st-500th human individuals according to the BLUP methods
Supplementary Table 2
The table indicates the SNP-SNP relationship matrix of the 1st-8th SNPs using the relationship of Gu-1 = ZTG-1Z and the Sherman-Morrison-Woodbury lemma